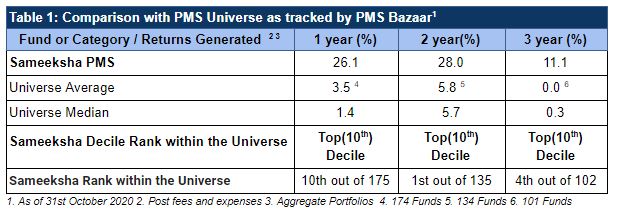
Sameeksha PMS (PMS = Portfolio Management service, an investment category suitable for qualified high networth investors, similar to a Hedge Fund in the US) retained its spot among the absolute best performers with top decile ranking across one two and three year time periods (Table 1). We were in fact 4th out of 102 funds based on three year data and first out of 135 funds for two year data.
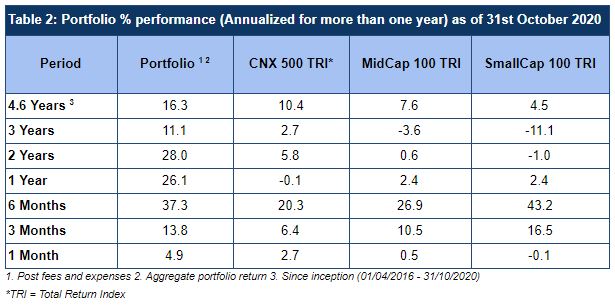
We had another good month on an absolute (up 4.9%) and relative basis (CNX500 TRI up 2.7% and small and midcap indices having flattish month). Table 2 captures this as well as details of our performance across all relevant time periods.
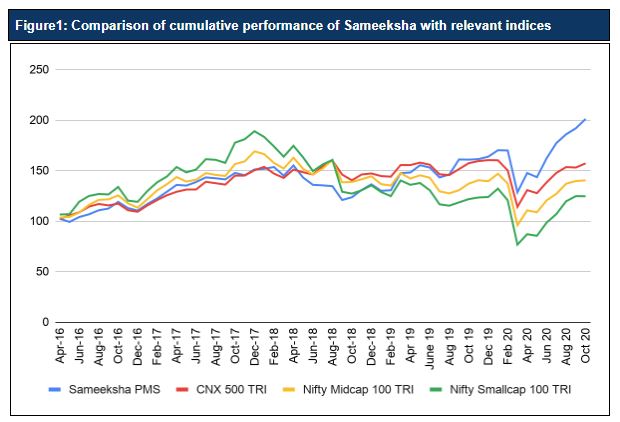
In Figure 1 we show cumulative performance from investing in Sameeksha and compare it to the performance of total return indices. Rupees 100 invested with Sameeksha would have grown to over 200 Rs over 4.6 years significantly outpacing CNX 500 TRI, Nifty MidCap 100 TRI and Nifty Smallcap 100 TRI. It is worth also noting that there aren’t any index funds available as of today to mimic the performance of such indices and that underscores the challenges faced by most fund managers in achieving even index performance as discussed next.
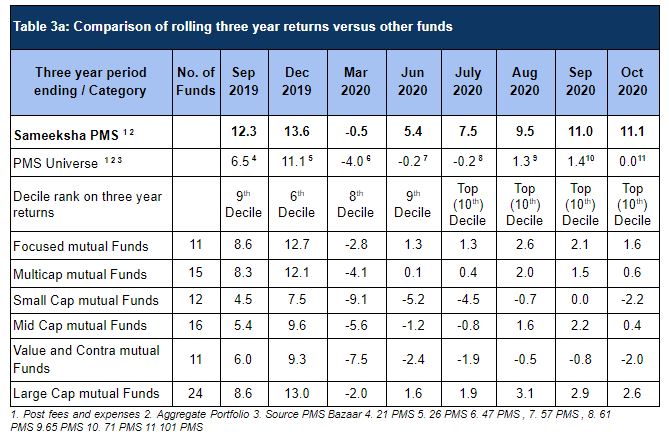
In Table 3a, we compare ourselves against the entire PMS universe and against various mutual fund categories. Focused and Multicap categories are the most relevant categories for comparison in our view. We have done far better than every relevant mutual fund category on a rolling three year basis for all the observation points.
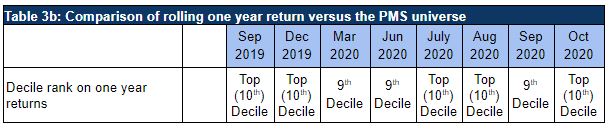
Within the PMS universe, we have been consistently ranked in the top two deciles on a one year basis. (Table 3b)
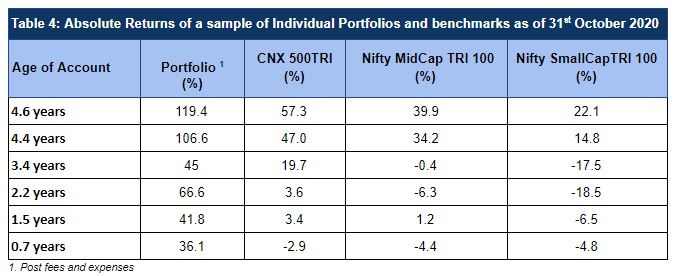
For us, it is important to deliver performance for our clients that join us at different points in time. In Table 4, we show performance of clients that have joined us at various points in time.
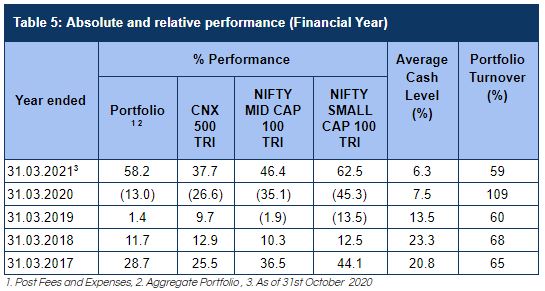
We capture our performance versus benchmarks on a financial year basis in Table 5. We have outperformed the key benchmark CNX500 materially for FY21 till date.
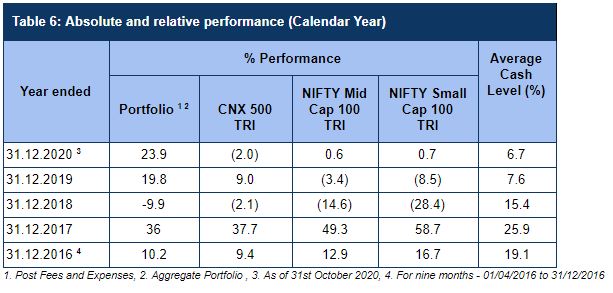
We capture our performance on a calendar year basis in Table 6.
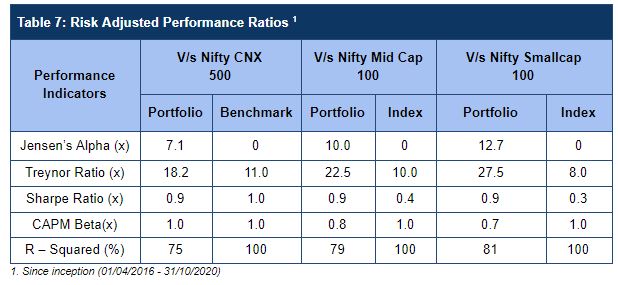
Our Risk Adjusted returns continue to remain favourable compared to Indices that we are comparable with since our inception of the fund (Table 7).
We welcome any follow up questions.
DIsclaimer : The information contained in this newsletter has not been verified by SEBI.