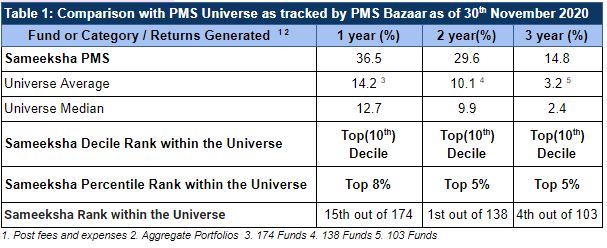
We are pleased to share with you our performance of Sameeksha PMS (Portfolio Management service, an investment category suitable for qualified high net worth investors) for the month of November 2020. For yet another month, we retain our leadership position amongst the most consistent performers in India with top decile ranking across time periods (Table 1). In fact, for two and three year periods, we were in the top 5% (number one for second month running based on performance over two years).
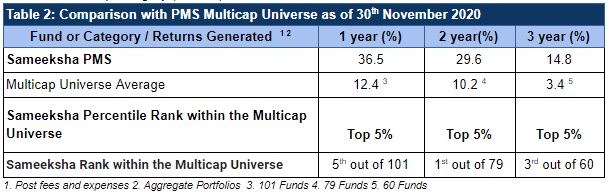
We follow a multicap strategy. As such, it makes sense to compare our performance among the universe of PMSes offering multicap strategy. Our rank is among the top 5% across all time periods within the multicap category (Table 2).
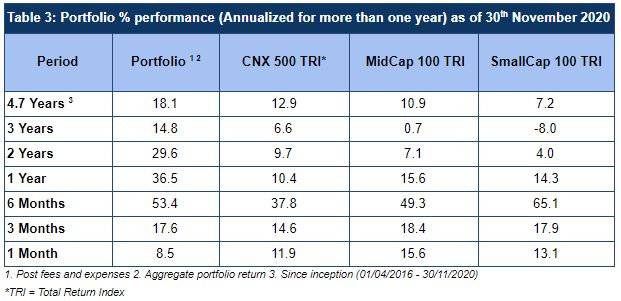
We continue to deliver material outperformance over the relevant benchmarks with CNX500 TRI being the most relevant (Table 3).
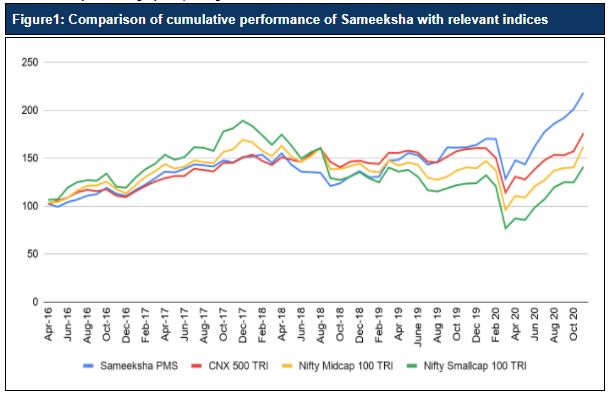
In Figure 1, we show how on a cumulative basis our divergence with the indices have widened since the inception of the fund. An investment of Rs. 100 with us since inception would have grown to Rs. 218 over 4.7 years, hugely outpacing the relevant indices.
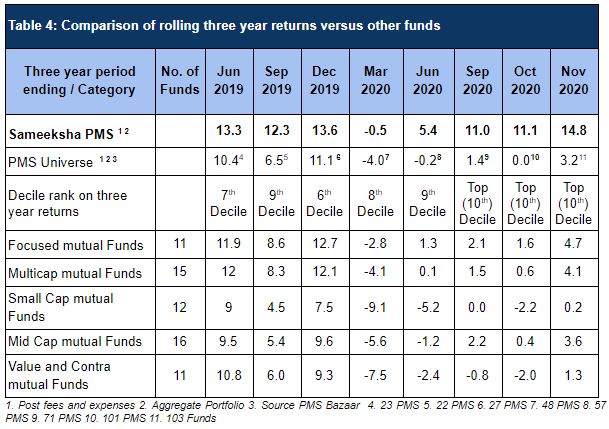
Consistency of performance is far more important versus one-off success. We have done very well within the PMS universe and versus relevant mutual fund categories on a rolling three year basis across all the observation periods. Even when we were not among the top 10-20% our performance was good and above median (Table 4).
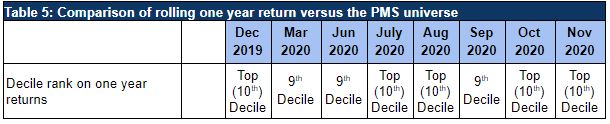
On a rolling basis we have been consistently ranked in the top two deciles among the PMS universe for one year periods (Table 5).
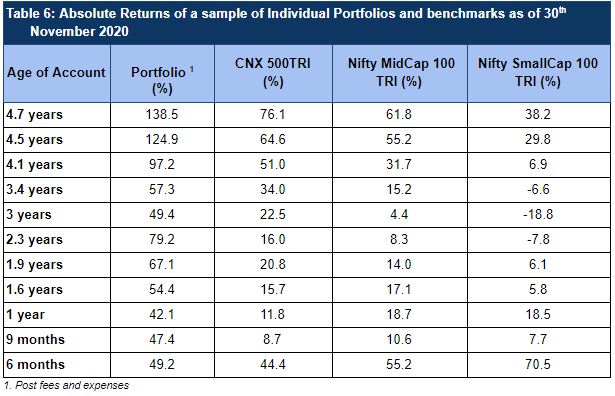
We also track how portfolios starting at different times have done with us (Table 6). Both absolute and relative performance of client portfolios have been quite strong irrespective of the start date.
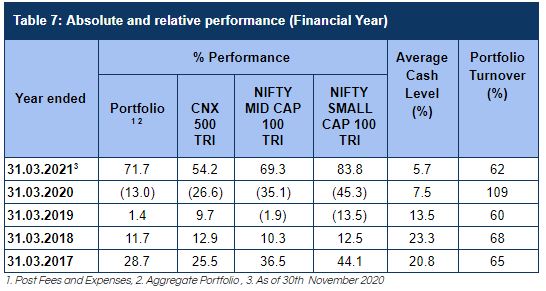
We capture our performance versus benchmarks on a financial year basis in Table 7. We have outperformed the key benchmark CNX500 materially for FY21 till date.
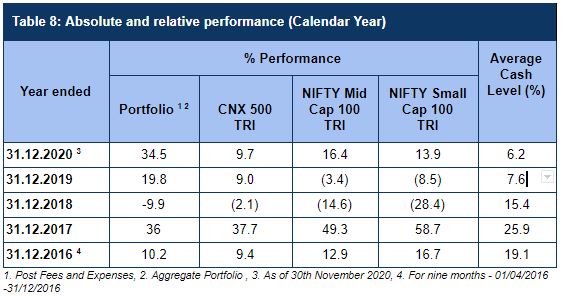
In Table 8, we capture our calendar year performance for years since the inception of the fund.
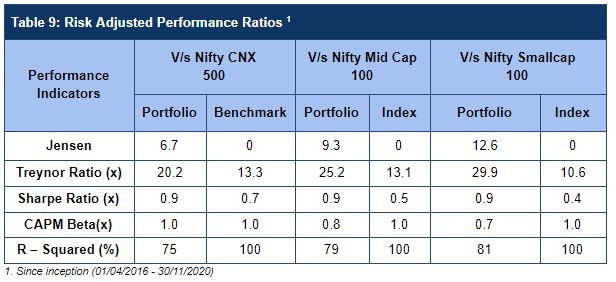
We have delivered good Risk Adjusted returns compared to Indices that we are comparable with since our inception of the fund (Table 9).
We welcome any follow up questions.
DIsclaimer : The information contained in this newsletter has not been verified by SEBI.