It is with immense gratitude and a deep sense of purpose that we write to you today to share a significant milestone. As of March 31st, 2026, Sameeksha India Equity Fund (SIEF) PMS, hereby referred to as Sameeksha India Equity PMS, has completed ten years and has immediately grabbed the top spot among all multicap and flexi-cap PMS strategies reporting to PMS Bazaar (Table 1). We are also number one among all PMSes across all categories barring only a single fund operating in the small-cap space.
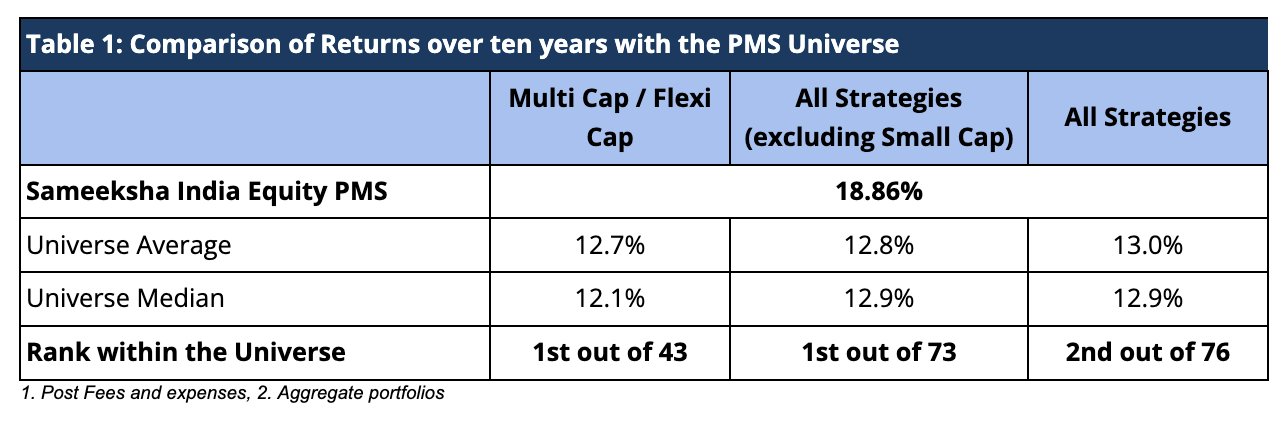
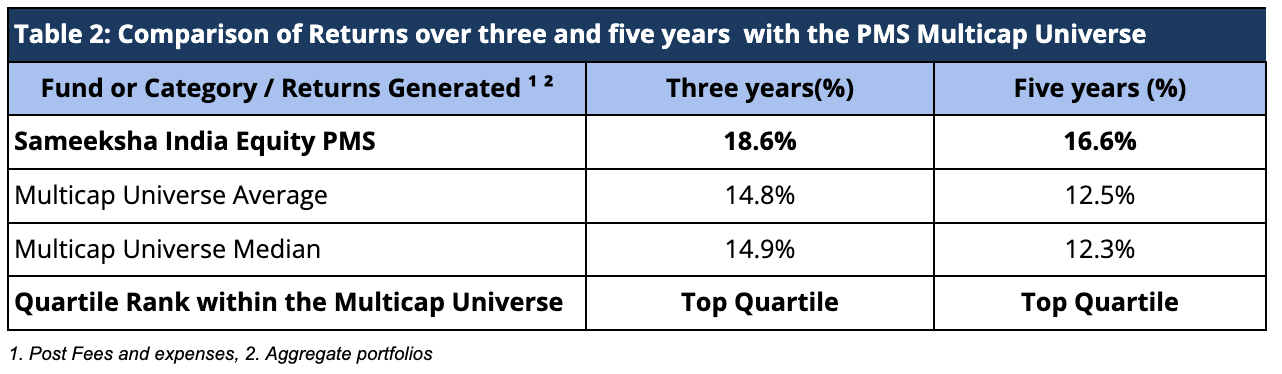
We have also registered top quartile rank for periods of five as well as three years ending 31st March 2026. (Table 2)
Please refer to the Appendix for a detailed discussion and breakdown of our Sameeksha India Equity PMS and Sameeksha India Equity AIF performance metrics, which includes the respective data for both.
We continue to stay focussed on our rigorous, process-driven approach to equity investing backed by heavy investments in technology and people. Over the past decade, we have continuously refined and strengthened our frameworks, but our foundational principles have never wavered.
Our performance is rooted in an uncompromising commitment to discipline. We have strictly adhered to our philosophy of buying only those stocks where we hold a fundamental understanding of their intrinsic value. By actively tuning out market noise and speculative trends, we have stayed true to our core mission: doing what is fundamentally right for our investors, at every step of the journey.
While we are proud to pause and celebrate this decade of excellence with you, we are profoundly aware that such milestones bring an even greater responsibility moving forward. We recognize that staying at the top demands more rigor, deeper research, and an even sharper focus on risk management.
We view this ranking not as a finish line, but as a renewed mandate to protect and grow your wealth with the exact same dedication and integrity that brought us here today. Please check out the link for a comprehensive overview of our complete range of investment strategies and how they might fit into your broader portfolio.
Thank you for your enduring trust, patience, and partnership. We look forward to navigating the next decade of opportunities together.
Sincerely,
Bhavin Shah
Founder and Fund Manager
Appendix: Sameeksha India Equity PMS & Sameeksha India Equity AIF Monthly Performance
Sameeksha India Equity PMS Performance and other details
Three important things must always be kept in mind when looking at performance data. First, for funds such as ours that do not follow a model portfolio strategy, the performance of individual clients over different durations is important to examine. Second, some PMSes may charge fees outside the PMS, which could make their performance data non-comparable to ours after fees. Third, it is important to look at not only portfolio returns but also risk-adjusted ratios. We provide data to address all three points later in this note.
Aggregate Portfolio Performance and ranking on a rolling period basis
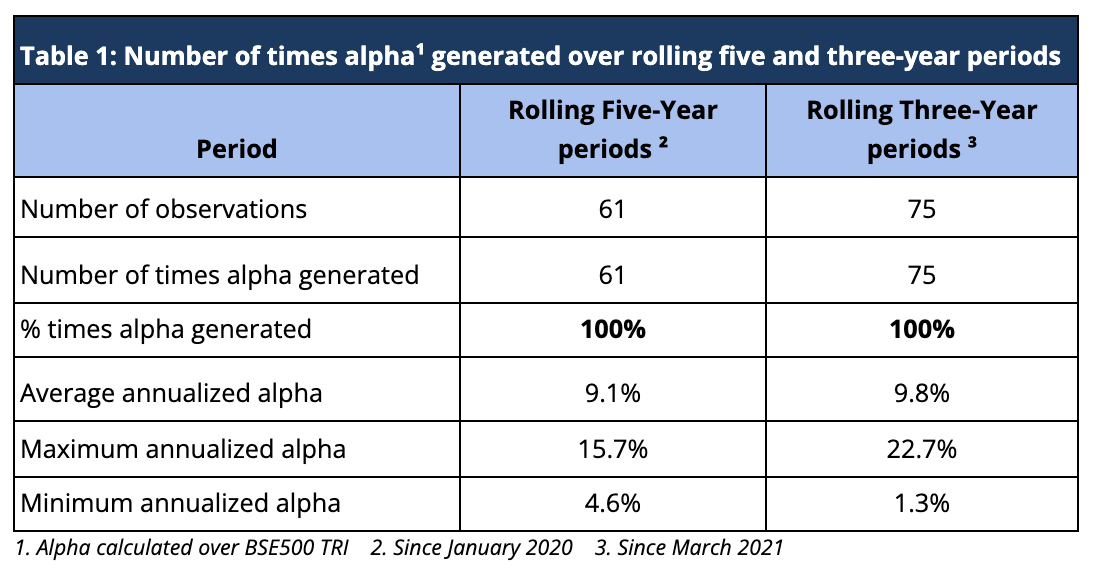
Rolling returns are a more useful indicator of consistency in performance versus single-period returns. For the rolling five-year periods applicable from March 2021 till date, Sameeksha India Equity PMS has delivered aggregate annualized alpha 100% of the time (61 out of 61 observations), ranging from ~5% to ~16%. For the rolling three-year periods applicable from January 2020 till date, Sameeksha India Equity PMS has delivered aggregate annualized alpha 100% of the time (75 out of 75 observations), ranging from ~1% to ~23% (Table 1). For both rolling five and three-year periods covered in Table 1, alpha has averaged around 9.1% and 9.8% respectively.
By averaging these rolling returns over different lookback periods, we gain a deeper understanding of how consistently the portfolio has delivered value over time, compared to the BSE 500 TRI benchmark (Table 2).
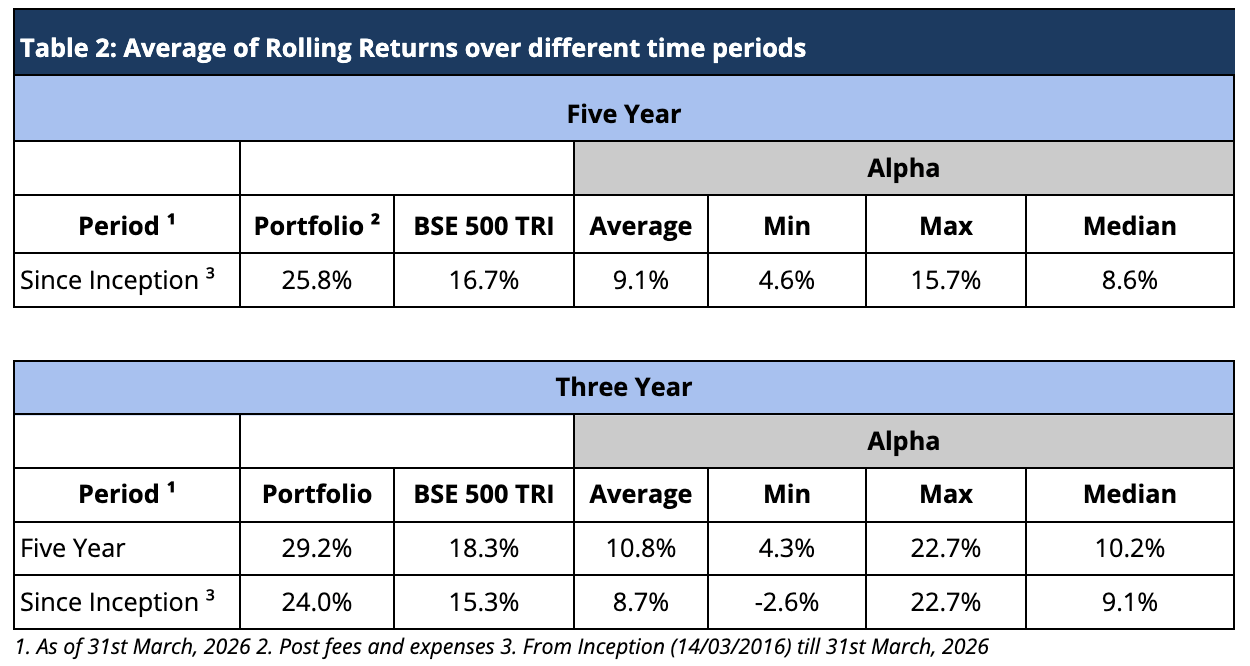
The results reveal a strong and persistent pattern of outperformance. Across all measured periods, average three-year or five-year rolling returns have consistently outpaced the benchmark. What stands out in particular is the stability of alpha across different lookback periods. This consistency suggests that the portfolio’s success is not driven by isolated bets or favorable market timing, but rather by a disciplined and repeatable process. The rolling return framework helps illustrate that this performance is not a result of temporary market positioning but instead reflects a reliable, long-term approach to investing.
Risk Adjusted Ratios: Not all returns are the same, Higher Returns at lower Risk
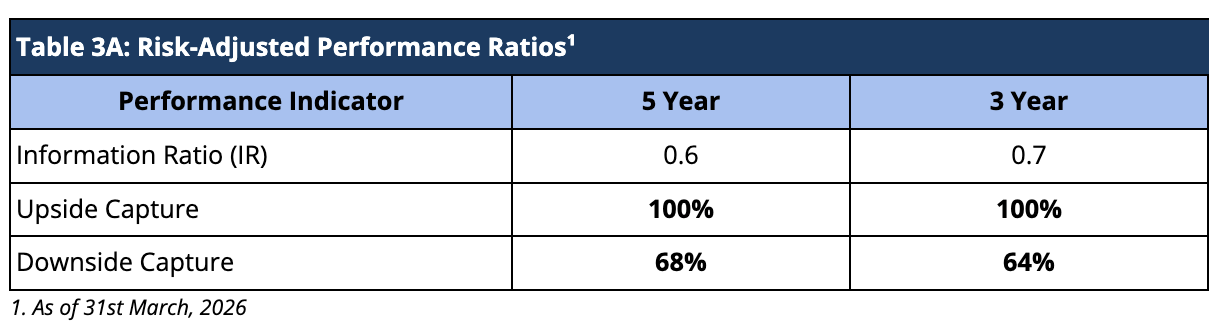
When compared on a risk-adjusted basis, our Sameeksha India Equity PMS has shown an even stronger performance. The Information Ratio (IR) measures the excess return of a portfolio over a benchmark per unit of active risk. A higher Information Ratio suggests better risk-adjusted performance.
Moreover, Upside Capture measures how well a fund performs as compared to a benchmark when the benchmark has positive returns. A higher upside capture ratio (>100%) indicates that the fund captures more of the benchmark’s positive movements. Whereas, Downside Capture measures how well a fund performs compared to a benchmark when the benchmark has negative returns. A lower downside capture ratio (<100%) indicates that the fund preserves capital better during market downturns (Table 3A).
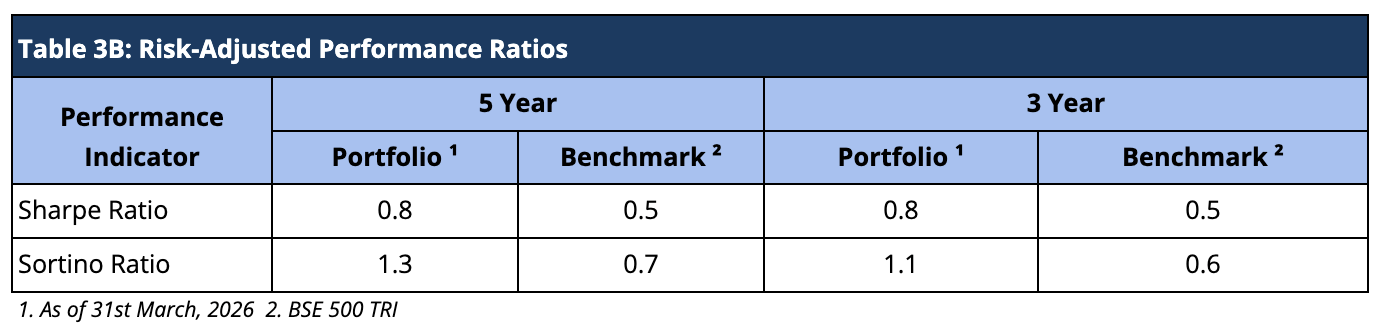
Furthermore, other risk-adjusted returns – Sharpe ratio is also significantly higher. The Sortino ratio measures the risk-adjusted return of an investment, focusing only on the downside risk. A higher Sortino ratio indicates better risk-adjusted returns, particularly concerning downside risk (Table 3B).
Aggregate Portfolio Returns over various time periods
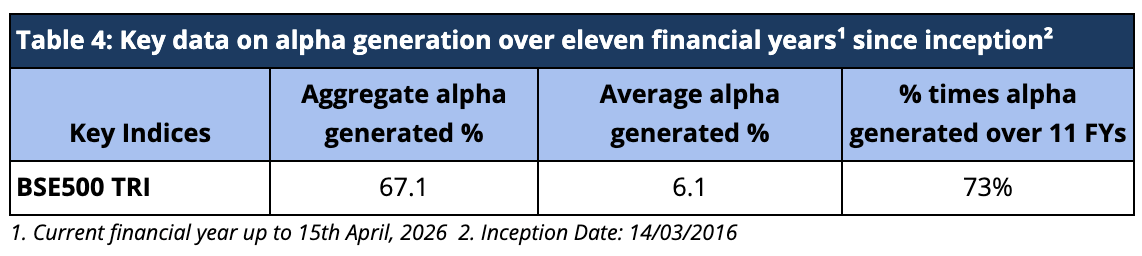
Sameeksha India Equity PMS has delivered a substantial aggregate annual alpha of 67.1% over BSE 500 TRI over the eleven financial years (including the current incomplete financial year), implying an average alpha of 6.1% since inception (Table 4).
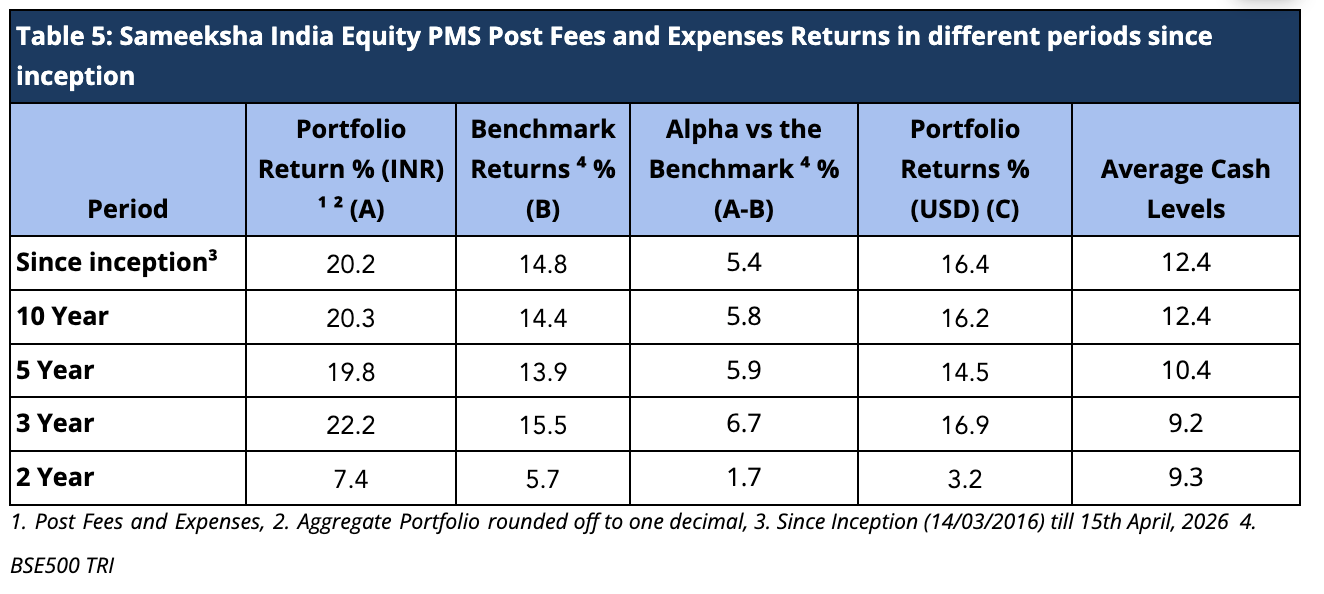
It is important to note that we have maintained relatively higher levels of cash (12.4% on average over the entire period since inception) from time to time throughout the management of the portfolio. Notwithstanding the same, from inception, over ten years and five years respectively, we have generated returns of 20.2%, 20.3% and 19.8% in INR terms and 16.4%, 16.2%, and 14.5% in USD terms, thus generating substantial alpha over the Indian benchmark BSE500 TRI. Also, we have delivered strong returns relative to benchmark across various key time periods (Table 5).
Aggregate Portfolio Performance on a financial year basis
We have started Financial Year 2027 on a strong note. Year-to-date, Sameeksha India Equity PMS has delivered a return of 13.6%, outperforming the BSE 500 TRI benchmark, which stands at 10%. This represents an outperformance of 3.6% so far in FY 2026–27. Over the years, our track record remains consistent—we have outperformed the benchmark in eight out of the last eleven financial years (including the current ongoing year). More importantly, the cumulative outperformance of 82% during these years significantly outweighs the total underperformance of 14.9% in the remaining three years.
Sameeksha India Equity Fund AIF Performance
Aggregate Fund Returns over various time periods
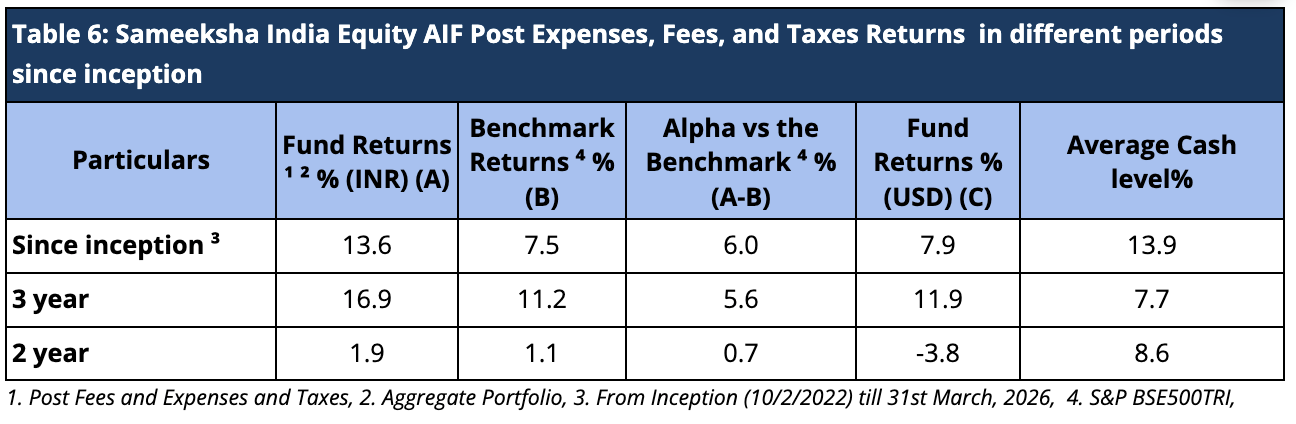
In our Sameeksha India Equity Fund (SIEF) AIF, hereby referred to as Sameeksha India Equity AIF, since inception, we have maintained relatively higher levels of cash (13.9% on average over the entire period from inception) from time to time throughout the management of the fund. Notwithstanding the same, from inception, over three years and two years, we have generated returns of 13.6%, 16.9% and 1.9% in INR terms beating the benchmark BSE 500 TRI returns, respectively, after fees, expenses and taxes in since Inception, three-year and two-year time periods (Table 6).
Risk Adjusted Ratios
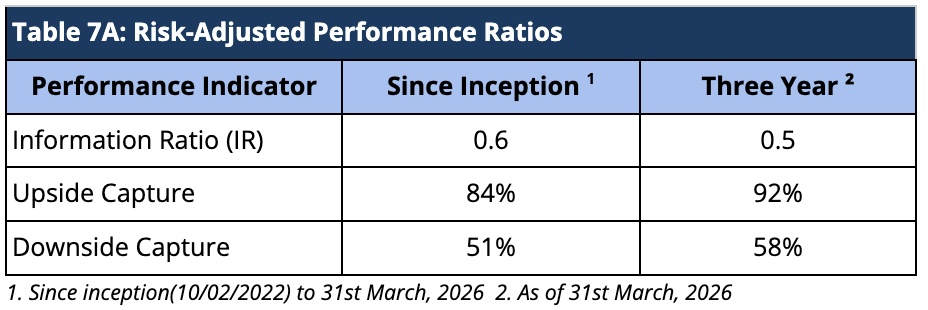
When compared on a risk-adjusted basis, our Sameeksha India Equity AIF has shown an even stronger performance. The Information Ratio (IR) measures the excess return of a portfolio over a benchmark per unit of active risk. A higher Information Ratio (IR) suggests better risk-adjusted performance.
Moreover, Upside Capture measures how well a fund performs as compared to a benchmark when the benchmark has positive returns. A higher upside capture ratio (> 100%) indicates that the fund captures more of the benchmark’s positive movements. Whereas, Downside Capture measures how well a fund performs compared to a benchmark when the benchmark has negative returns. A lower downside capture ratio (< 100%) indicates that the fund preserves capital better during market downturns (Table 7A).
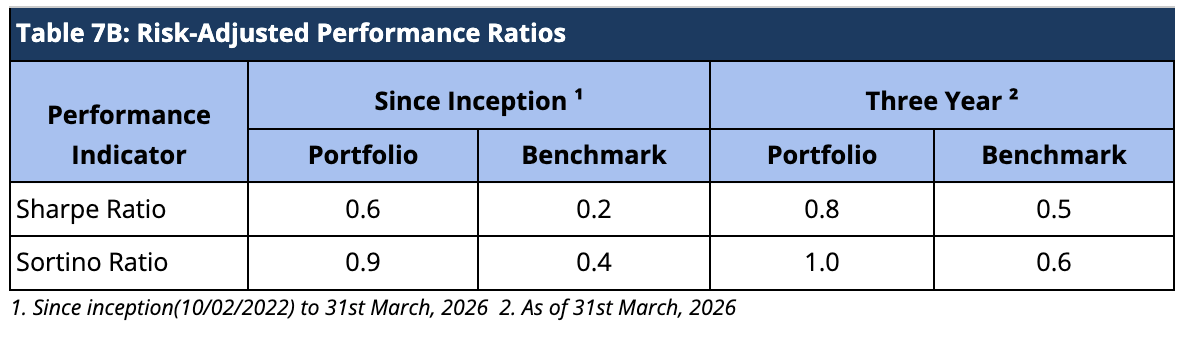
Furthermore, other risk-adjusted returns – Sharpe ratio is also significantly higher. The Sortino ratio measures the risk-adjusted return of an investment, focusing only on the downside risk. A higher Sortino ratio indicates better risk-adjusted returns, particularly concerning downside risk (Table 7B).
Disclaimer – The information contained in this update is provided by our fund accounting platform and is not audited. This document is for informational purposes only and is not intended for solicitation to residents of the United States or any other jurisdiction that would subject Sameeksha Capital or its affiliates to any registration requirement within such jurisdiction or country. It does not constitute an offer to buy or sell securities or financial instruments. Recipients are advised to conduct their own research and seek professional advice before making any investment decisions.