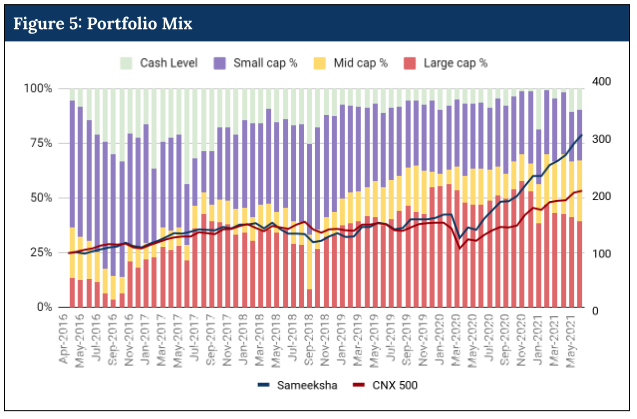
Cash levels
The cash level in our portfolio is a function of two main factors: First, our ability to find sufficient bottoms-up ideas and our position sizes for such ideas. We may not hold much cash if we find enough ideas to invest that meet our absolute return criteria and all the cash is used up in building appropriate position sizes in such names while taking into account our guideline for maximum number of positions to be held. Second, our call on equity exposure based on our top-down view of the market. To develop a top-down view, we evaluate several factors including economic indicators and overall economic backdrop, interest rates and potential direction of the same and market valuation taking into account the interest rates. While we do not have specific targets for portfolio mix across large, mid and small cap, we have learned to moderate or increase our exposure to small and mid cap stocks depending on the attractiveness of such names. We prefer to go light on small and mid cap if such stocks appear to be richly valued.
Right from the beginning, we have focussed on investing in companies that meet our absolute return criteria. Furthermore, we have criteria to follow for position size. These two factors determine how much of our portfolio remains invested in equities from time to time on a bottom-up basis.
We started our research process six months prior to the launch of our fund. However, based on the time required to take each of our ideas through our research process, we did have a challenge of not having enough ready ideas to invest during the eighteen months of operation, especially when we sold a position that achieved our price objective. Despite holding a relatively large cash level, we delivered performance at par with CNX500 during this period (Figure 1). As such, we were having almost 35% of our portfolio in cash the day demonetisation was announced.
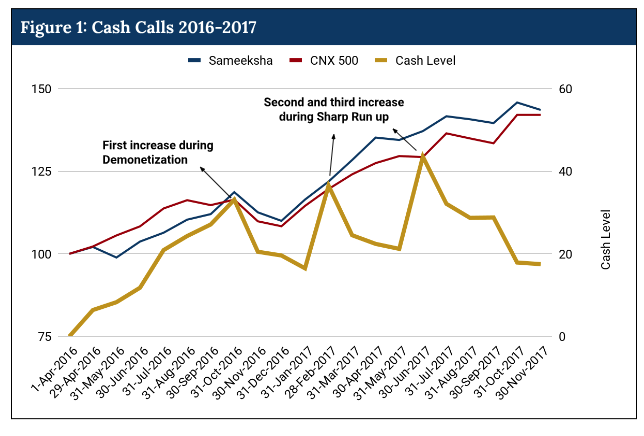
Drop in share prices during demonetization gave us an opportunity to buy some high quality stocks at right prices and that also translated into some outperformance. However, we sold some of our positions too soon purely because some stocks achieved our price objective set two years out. As such, we never saw cash levels in our fund drop below 20% till the end of 2017. Notwithstanding the fact that we had average cash levels of 23% from inception (1st April 2016) till 30th November 2017, we managed to match returns of that of CNX500.
Not all our calls related to managing cash levels have been fruitful. In the euphoric period of late 2017 and early 2018, we made the mistake of raising equity exposure with our cash levels reducing from >20% to below 10% levels. Furthermore, our exposure to mid and small cap stocks went up during this period. Though such stocks met our absolute return criteria, we ended up downtrading – bought smaller companies with somewhat weaker businesses relative to larger companies with strong moat. In hindsight, this decision proved costly when the markets corrected later in 2018 with small and mid cap indices suffering more severe correction (Figure 2).
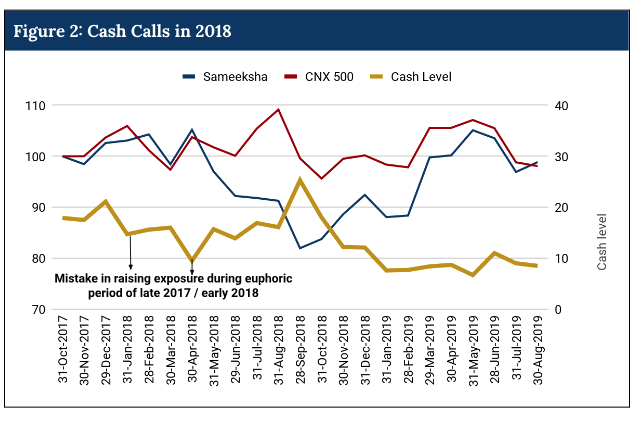
Though many of our positions in small and mid cap stocks recovered sharply over time, we had to ride through a period of underperformance. We have rebounded strongly from this underperformance but we wish to improve our strategy based on this experience. First, we want to do a thorough revisit of names that reach our target price. In some instances, such companies may be in a phase of strong operating performance and we should redo our forecast and assess the value again before deciding to sell. Second, shifting from large cap to mid and small cap must be done only if there is overall value in the mid and small cap space. Some bit of top down analysis of relative valuation can help. In an extended phase of upcycle in stocks, one starts to struggle finding value in large cap and there is a risk of buying small/mid cap name with relatively unproven business model due to the allure of valuation. However, such stocks can suffer greatly when the market corrects and given the potential risks in execution, such stocks have to be bought only if risk reward is very favorable. Cash may be a better option during such phase of the market although when to hold how much cash is a matter of art.
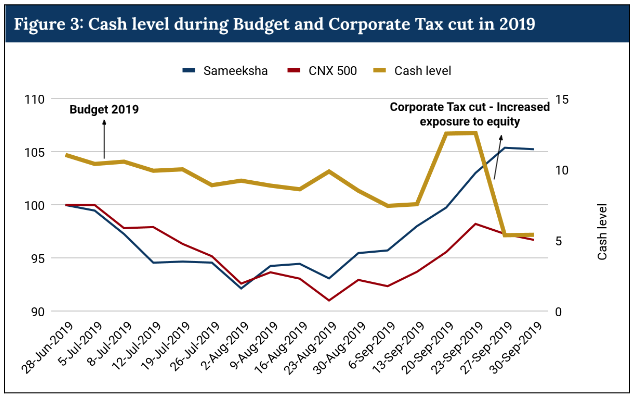
We also considered raising the cash level when the annual budget was announced in July 2019. The finance minister proposed an introduction of long term capital gains tax and many other measures that were unlikely to please the market and the budget was void of any major reforms contrary to the expectations. In hindsight some increase in cash levels would have been good. However, we were perhaps biased by our faith in this government to do quick course correction when they see that they have made a mistake. Later in September 2019, they announced a major cut in corporate tax and it gave a big boost to the equity market. Thankfully, we participated in that fully this time (Figure 3). Our takeaway from this episode is to show patience if a decision taken by the government may actually be reversed.
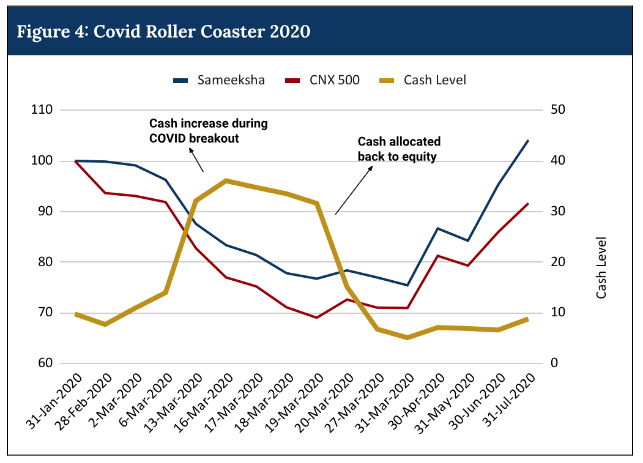
Our biggest and swiftest cash call was taken during early stages of the spread of covid back in March 2020. We reduced our equity exposure sharply by increasing our cash levels from ~10% to 33% within a span of a few trading days. However, soon after the market crash, we assessed the situation to be ripe for investments especially in light of the massive stimuli being announced across the world and we deployed much of the cash back over the next few trading days. To summarize, we went from 10% cash level to 33% and back again to less than 10% levels – all in a span of three weeks (Figure 4). These decisions clearly helped us to generate alpha for our clients.
Allocation across market cap categories
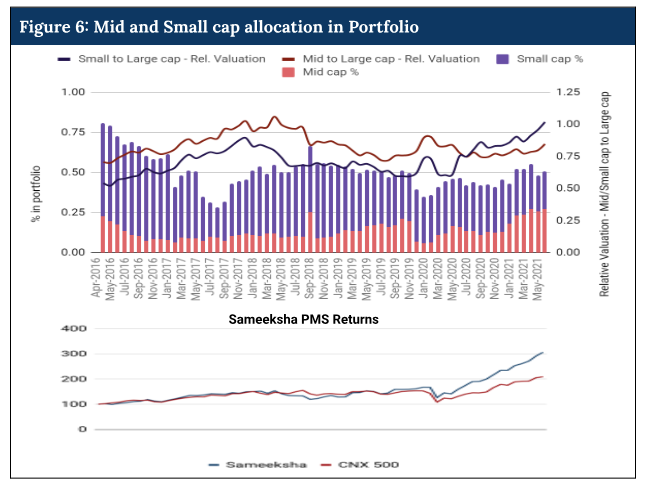
While the portfolio allocation between large, mid and small caps are largely influenced by bottom-up calls through stock picks, we also monitor them through our relative valuation of the relevant indices – Nifty 50, Nifty Midcap 150, and Nifty Smallcap 250. For both the mid caps and small caps, the portfolio allocation has largely been in line with our relative valuation of midcap and small cap indices (Nifty Midcap 150 and Nifty Smallcap 250 respectively) to large cap index (Nifty 50). Interestingly, due to our focus on understanding value and position sizing rules, our exposure to mid and small cap decreased as the relative valuation of mid and small cap increased and vice versa.
Over the investment period, our mid cap allocation has been comparatively lower to that of small caps (Figure 6). However, the trend has reversed in recent times with mid caps gaining more and more allocation. This may also be attributed to the fact that with larger portfolio size, we may find it easier to build larger positions in mid cap instead of small cap. Valuation of mid cap and small cap stocks tend to follow a similar path.
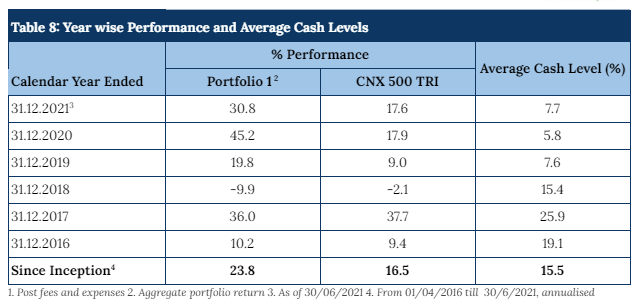
It is interesting to look at how our fund performed over the years in the context of equity exposure (Table 7). Except for 2018, we have met or exceeded the benchmark returns despite holding varying levels of cash. Our meaningful underperformance in 2018 despite having an average cash level of 15% was because of exposure to small and midcap significantly above benchmark and there was a big correction in those segments in 2018.
As our coverage of stocks expanded we have been generally able to fully deploy our funds resulting in lower average cash levels in recent years and higher alpha. Because we have always had some cash, our portfolio beta has been similar to benchmark despite having higher weight of small and mid cap relative to benchmark and our risk adjusted ratios have been quite strong (See Appendix 1, Table 7). We have also generated strong alpha over the entire period from inception till date especially due to strong alpha in recent years.
Appendix 1: Update on the performance of our fund
Appendix 2: Structural factors and Economic Reforms driving Indian economy
Appendix 3: Investment philosophy and lessons learned
Appendix 5: Examples of strong positive and negative performance contributors