We have outperformed the large, mid and small-cap indices over the past five years. Net of fees and expenses, we have generated annualized portfolio returns of ~24%, well ahead of the CNX 500 TRI (15.4% CAGR), MidCap 100 TRI (15.5%) and SmallCap 100 TRI (12.0%). We have also outperformed each index over the 3-year period.
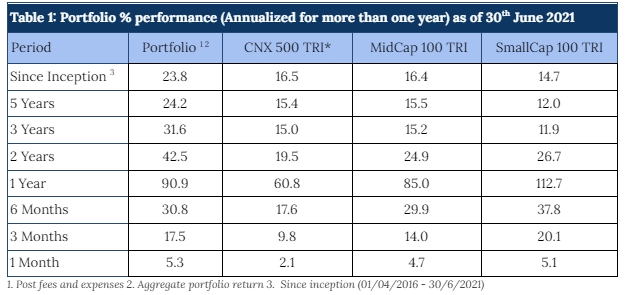
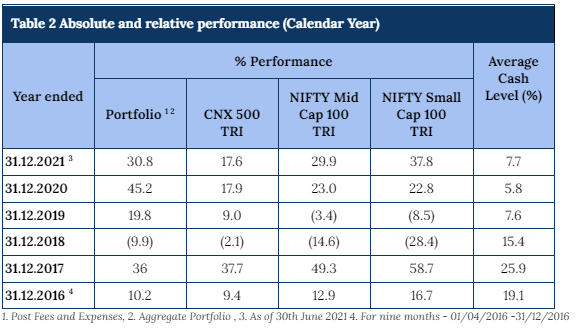
For the last two completed calendar years, our outperformance versus the benchmarks has been quite strong (Table 2).
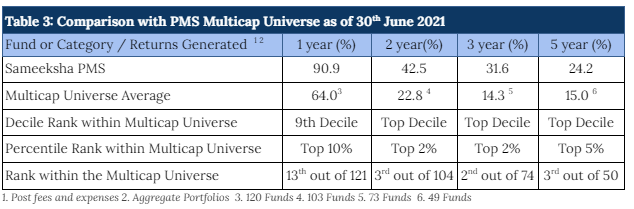
We have retained our rankings within the top 10 percentiles across the periods (Table 3) and have remained among the top 5 PMSes for the periods of two, three and five years.
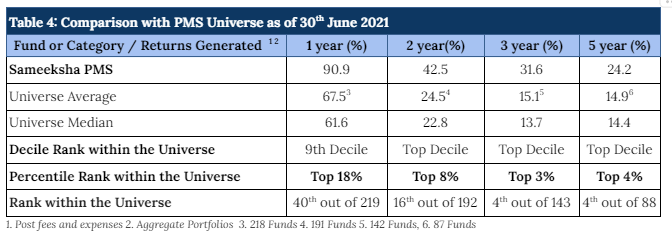
In comparison with the entire PMS universe, we have sustained our top ranking for longer durations of two, three and five years. Sharp rally in small cap and mid cap stocks has enabled PMSes focussed on those categories to deliver strong performance. Still, we have come through within the top two deciles across all PMSes (Table 4).
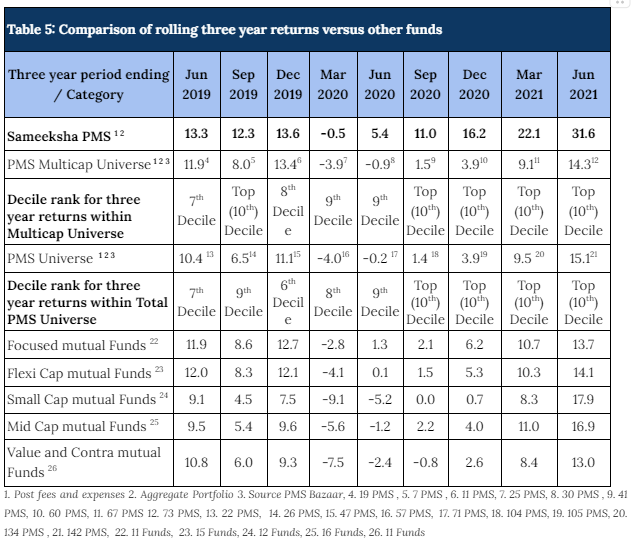
Rolling returns provide a much better picture than single period returns – which can often be distorted with one-off performances. For a three year period ending June 2021, we have meaningfully outperformed all the major relevant mutual fund categories that we are comparable with and have maintained our top decile ranking across both our comparable universe of Multicap PMSes as well as across the entire PMS universe (Table 5).
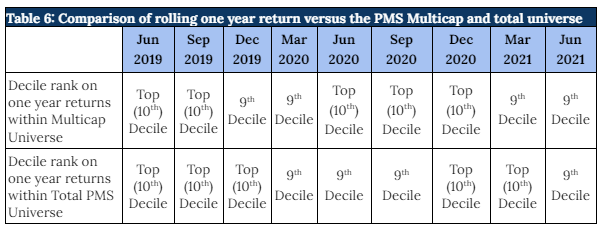
Similarly, our rolling one year returns have been strong and we have maintained our rankings in the top two deciles, across the PMS universe, consistently in the last two years (Table 6).
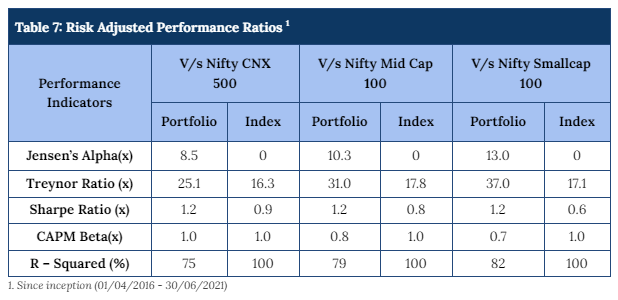
Our PMS outperformance of the benchmark indices has been achieved despite maintaining average cash levels of above 10% over the entire period. As a result, our strong alpha has translated into strong risk adjusted returns as well, with a risk adjusted alpha generation of 8.5% annually over the broad market benchmark since its inception (Table 8). Furthermore, other risk adjusted returns – Sharpe ratio and Treynor ratio, are also significantly higher than the benchmark indices.
Appendix 2: Structural factors and Economic Reforms driving Indian economy
Appendix 3: Investment philosophy and lessons learned
Appendix 4: Cash Calls and Portfolio mix across market cap buckets
Appendix 5: Examples of strong positive and negative performance contributors