* For Five Year period
In the month of October, the benchmark S&P BSE 500 TRI fell 2.9%. Against that, Sameeksha PMS (Portfolio Management Service = Separately Managed Accounts) gained 1.2% (net of all fees and expenses), resulting in a meaningful outperformance. Sameeksha AIF (Alternative Investment Fund = “Hedge Fund”) also gained 1.7% (post expenses pre tax), also indicating meaningful outperformance.
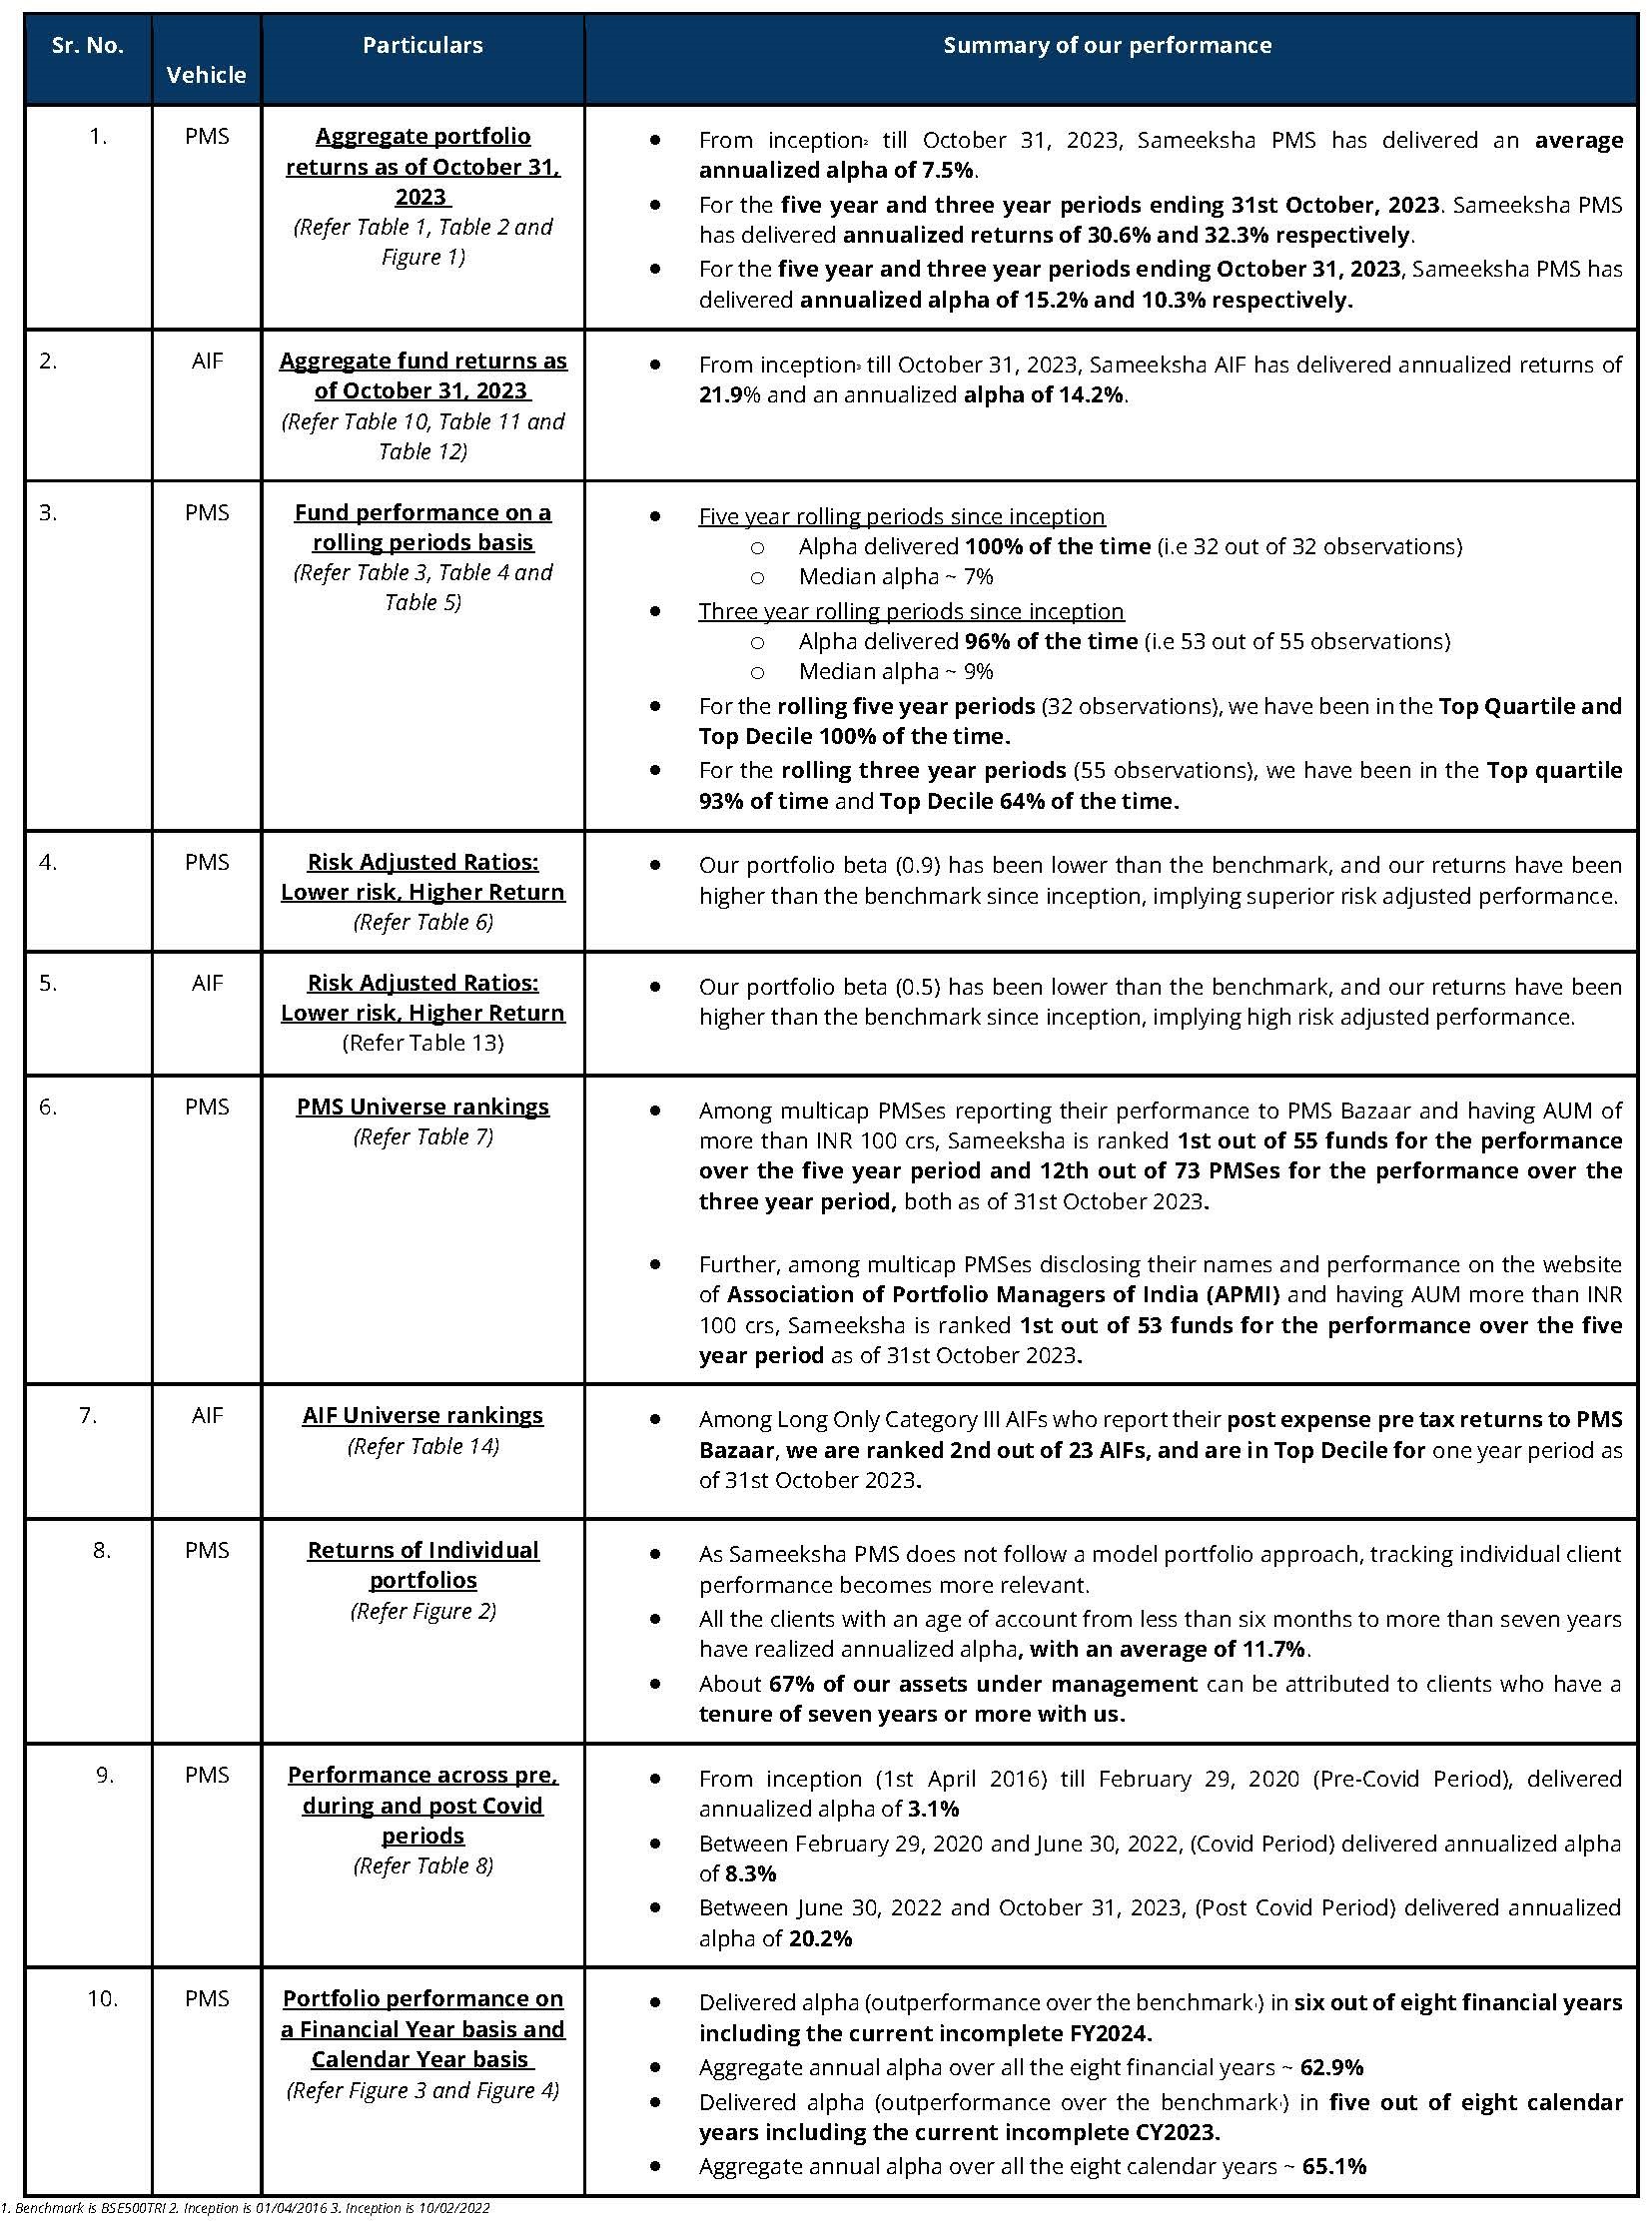
We summarize key aspects of our performance as follows:
PMS Performance and other details
Three important things must always be kept in mind when looking at performance data. First, for funds such as ours that do not follow model portfolio strategy, the performance of individual clients for different duration is important to look at. Second, some PMSes may be charging fees outside the PMS and hence after fees, performance data may not be comparable to ours. Third, it is important to look at not only portfolio returns but also risk adjusted ratios. We provide data to address all three points later in this note.
Aggregate Portfolio Returns over various time periods
Sameeksha PMS has delivered a substantial aggregate annual alpha of 62.9% over BSE500 TRI over the eight financial years (including the current incomplete financial year) implying an average alpha of 7.9% since inception (Table 1).
| Table 1: Key data on alpha generation over eight2 financial years since inception1 | |||
| Key Indices | Aggregate alpha generated % | Average alpha generated% | % times alpha generated over 8 FYs |
| BSE500 TRI | 62.9 | 7.9 | 75% |
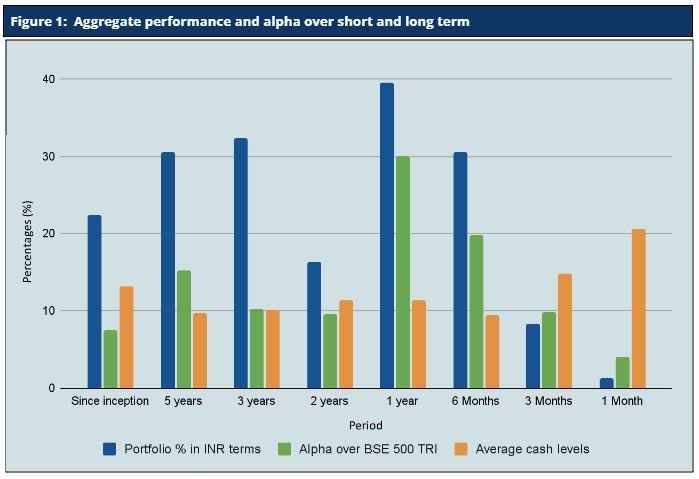
It is important to note that we have maintained relatively higher levels of cash (13.2% on average over the entire period from inception) from time to time over the duration of managing the portfolio. Notwithstanding the same, from inception, over five years and over three years respectively, we have generated returns of 22.4%, 30.6% and 32.3% in INR terms and 18.8%, 27.6% and 27.5% in USD terms thus generating substantial alpha over the Indian benchmark BSE500 TRI returns and SPY ETF (ETF tracking US S&P 500 index), respectively. Also, we have delivered strong returns relative to benchmark across various key time periods (Table 2 and Figure 1).
| Table 2: Portfolio % performance since inception | |||||||
| Period | Portfolio Return % (INR) 1 2 (A) | S&P BSE 500 TRI % (B) | Alpha vs S&P BSE 500 TRI % (A-B) | Portfolio Returns % (USD) (C) | SPY ETF % (D) | Alpha vs SPY ETF % (C-D) | Average Cash Levels |
| Since inception3 | 22.4 | 15.0 | 7.5 | 18.8 | 9.7 | 9.1 | 13.2 |
| 5 Years | 30.6 | 15.4 | 15.2 | 27.6 | 9.3 | 18.3 | 9.7 |
| 3 Years | 32.3 | 22.0 | 10.3 | 27.5 | 8.6 | 19.0 | 10.2 |
| 2 Years | 16.3 | 6.7 | 9.6 | 10.3 | -4.6 | 14.9 | 11.4 |
| 1 Year | 39.6 | 9.6 | 30.0 | 38.7 | 8.3 | 30.4 | 11.4 |
| 6 Month | 30.7 | 10.9 | 19.8 | 28.3 | 0.5 | 27.7 | 9.4 |
| 3 Month | 8.4 | -1.4 | 9.8 | 7.0 | -8.6 | 15.7 | 14.8 |
| 1 Month | 1.2 | -2.9 | 4.1 | 0.9 | -2.2 | 3.1 | 20.7 |
Aggregate Portfolio Performance and ranking on a rolling periods basis
Rolling returns are a more useful indicator of consistency in performance versus single period returns. For rolling three year periods applicable to our entire operating history, Sameeksha PMS has delivered aggregate annualized alpha 96% of the times (53 out of 55 observations) ranging from 0.4% to 23%. For the rolling five year periods applicable, Sameeksha PMS has delivered aggregate annualized alpha 100% of the time (32 out of 32 observations) ranging from 5% to 16% (Table 3).
| Table 3: Number of times alpha1 generated over rolling five and three year periods | ||
| Particulars | Rolling Five Year periods | Rolling Three Year periods |
| Number of observations | 32 | 55 |
| Number of times alpha generated | 32 | 53 |
| % times alpha generated | 100% | 96% |
| Median annualized alpha | 7% | 9% |
| Maximum annualized alpha | 16% | 23% |
| Minimum annualized alpha | 5% | 0.4% |
For rolling three year periods applicable to our entire operating history, we have been ranked among the multicap universe in the Top Decile 64% of the time (35 out of 55 observations) and in the Top Quartile 93% of the time (51 out of 55 observations). For the remaining 7% observations, we were ranked in the Second Quartile (Tables 4 and 5). For rolling five year periods applicable to our entire operating history, we have been ranked among the multicap universe in the Top Decile 100% of the time (32 out of 32 observations).
| Table 4: Decile distribution of our rank within the Multicap PMS universe on a rolling basis since April 2019 | |||
| Particulars | Five years | Three years | One year |
| Number of Observations | 32 | 55 | 55 |
| Top Decile1 | 100% | 64% | 44% |
| 9th Decile2 | 0% | 25% | 22% |
| 8th Decile | 0% | 7% | 13% |
| 7th Decile | 0% | 2% | 2% |
| 6th Decile | 0% | 2% | 7% |
| 5th Decile | 0% | 0% | 4% |
| 4th Decile | 0% | 0% | 5% |
| 3rd Decile | 0% | 0% | 4% |
| Total | 100% | 100% | 100% |
| Table 5: Quartile distribution of our rank within the Multicap PMS universe on a rolling basis since April 2019 | |||
| Particulars | Five Years | Three Years | One Year |
| No. of Observations | 32 | 55 | 55 |
| Top Quartile 1 | 100% | 93% | 73% |
| 2nd Quartile 2 | 0% | 7% | 20% |
| 3rd Quartile | 0% | 0% | 4% |
| 4th Quartile | 0% | 0% | 4% |
| Total | 100% | 100% | 100% |
Risk Adjusted Ratios: Not All Returns Are The Same, Higher Returns At Lower Risk
When compared on a risk-adjusted basis, our PMS shows an even stronger performance with a risk-adjusted alpha generation of 7.6% over the broader market benchmark since its inception. While our portfolio beta has been materially lower than our benchmark, our returns have been higher than the benchmark since inception, implying superior strong risk adjusted returns.
Furthermore, other risk-adjusted returns – Sharpe ratio and Treynor ratio, are also significantly higher than the benchmark (Table 6).
| Table 6: Risk-Adjusted Performance Ratios 1 | ||
| Performance Indicators | V/s BSE 500 | |
| Portfolio | Index | |
| Jensen’s Alpha (x) | 7.6 | 0 |
| Treynor Ratio (x) | 23.7 | 15.5 |
| Sharpe Ratio (x) | 1.2 | 0.9 |
| CAPM Beta(x) | 0.9 | 1 |
Performance Within The PMS Universe
We continue to maintain our top rankings both within the multicap PMS universe as well as the entire PMS universe for key periods of three and five years. The multicap PMS universe rankings are more relevant to us since we follow the multicap strategy.
In the interest of a fair comparison, we present our rankings among those multicap PMSes with AUM more than INR 100 crs. Within this universe, we are 1st out of 55 PMSes for the five year period and 12th out of 73 PMSes for three year period, highlighting our superior performance over the long term periods (Table 7). Among the multicap universe (considering all AUM), we are consistently ranked in the Top Decile for the five year period for all 32 out of 32 observations reflecting well on the consistency of our performance.
| Table 7: Comparison with PMS Multicap Universe as of 31st October 2023 | ||||
| Fund or Category / Returns Generated 1 2 | Five year (%) | Three year (%) | Two year (%) | One year (%) |
| Sameeksha PMS | 30.6 | 32.3 | 16.3 | 39.6 |
| Multicap Universe Average | 17.5 | 24.6 | 8.9 | 18.3 |
| Decile Rank within the Multicap Universe | Top Decile | 9th Decile | 9th Decile | Top Decile |
| Percentile Rank within the Multicap Universe | Top 1% | Top 16% | Top 16% | Top 5% |
| Rank within the Multicap Universe 3 4 5 6 | 1st out of 55 | 12th out of 73 | 14th out of 84 | 5th out of 85 |
Returns Of Individual Portfolios
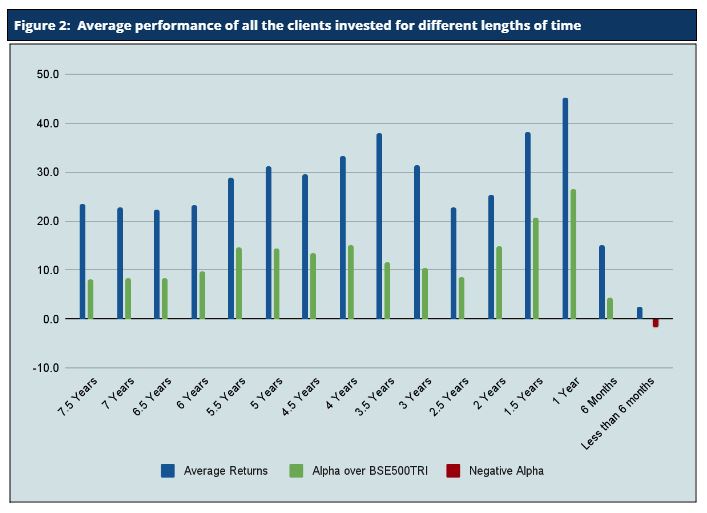
Because we don’t follow model portfolio strategy, the performance of individual clients is far more important than overall portfolio aggregate returns (Figure 2). For investors who are with us for 3 years and more, Sameeksha PMS has returned a very substantial alpha with an average annualized alpha of approx. 9.1% for the three year period ending 31st October, 2023. Similarly, for investors who are with us for 5 years or more, Sameeksha PMS has returned substantial alpha with an average annualized alpha of approx. 15.3% for the five year period ending 31st October, 2023. The Figure below shows the average annualized returns and alpha over different periods of time of all the clients as on 31st October, 2023.
Performance Of PMS Over The Covid Timeline (Pre, During, And Post)
The Covid Pandemic induced significant volatility in the equity markets. Hence, it is useful to look at the performance across three time slices : Pre Covid, During Covid and Post Covid. Sameeksha PMS has outperformed the benchmark across all of these three time periods with meaningful alpha (Table 9). This consistency of performance may be an important factor in comparing us with the other funds.
| Table 8: Absolute and Annualised returns1 – Pre, During, and Post Covid | ||||||
| Duration | Absolute Portfolio Returns(%) (A) | Absolute BSE500TRI Returns (%) (B) | Alpha % (A-B) | Annualised Portfolio Returns (%) (C) | Annualised BSE500TRI Returns (%) (D) | Alpha % (C-D) |
| 01.04.2016 to 29.02.2020 (Pre Covid) | 67.6 | 50.6 | 17.0 | 14.1 | 11.0 | 3.1 |
| 01.03.2020 to 30.06.2022 (During Covid) | 76.0 | 50.4 | 25.6 | 27.5 | 19.1 | 8.3 |
| 01.07.2022 to 31.10.2023 (Post Covid) | 56.3 | 26.9 | 29.4 | 39.8 | 19.6 | 20.2 |
Aggregate Portfolio Performance on a financial year and calendar year basis
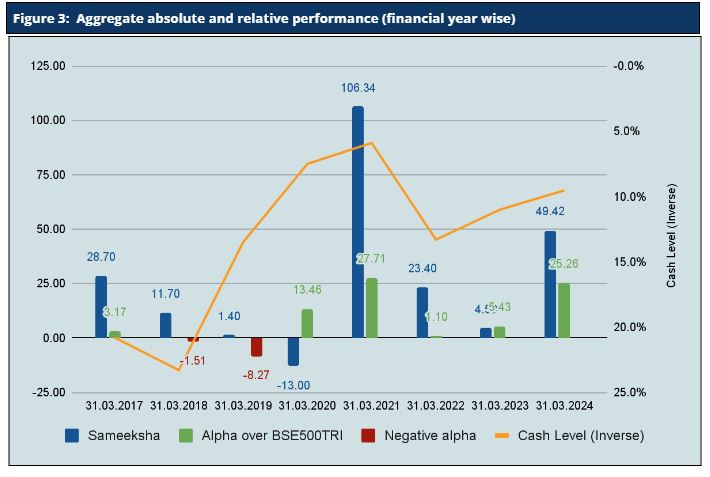
For the month of October, Sameeksha PMS has outperformed the benchmark BSE 500 TRI by generating 1.2% returns against the benchmark BSE500TRI returns of (2.9)%. For Financial Year 2023-24 till date, we have outperformed BSE500 TRI by 21.8%. Looking at our performance over the financial years (Figure 3), we have outperformed our benchmark in six out of eight financial years (including the current incomplete financial year). Key however is that the sum of outperformance of 72.7% in those six years far exceeds the sum of underperformance of 9.8% in the remaining two years. Furthermore, if we are able to sustain the outperformance achieved so far in this financial year for the rest of the year, it will become a streak of five consecutive years of generating alpha.
For the calendar year 2023 till date, we are outperforming the benchmark BSE500 TRI by 26.8%. We have outperformed the benchmark in five out of eight calendar years and the sum of outperformance of 81.6% in five years far exceeds the sum of underperformance of 16.5% in the remaining three years. (Figure 4)
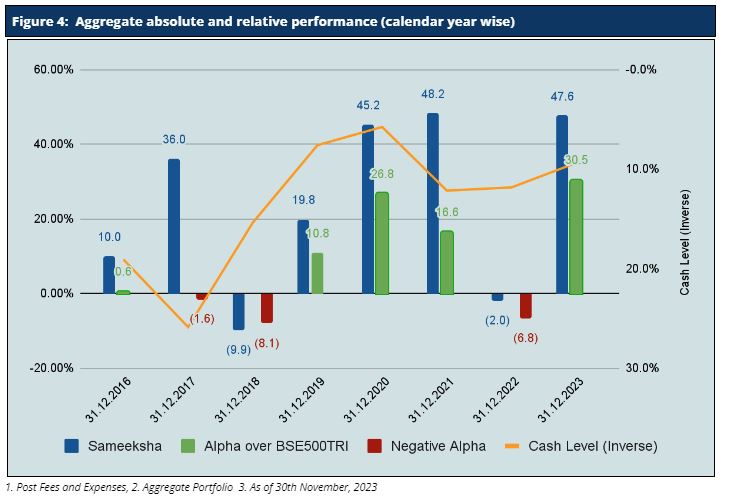
It is important to note that we delivered this alpha despite maintaining an average cash level of 13.23% across the eight financial years.
Cumulative Performance versus the benchmark
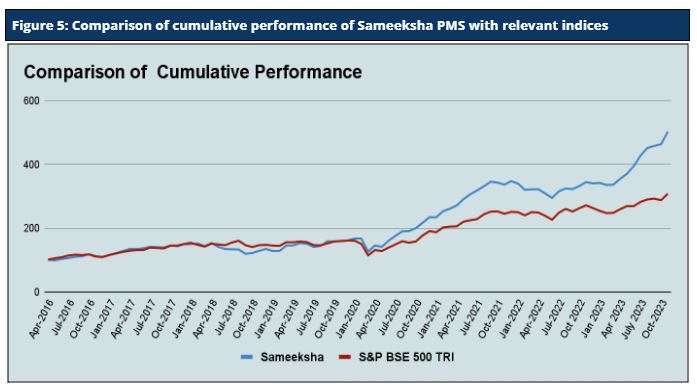
Sameeksha PMS’s outperformance over its benchmark has continued to widen positively over the years. An investment of Rs. 100 with us since inception (April 2016) would have grown to Rs. 464 , far outpacing what one would have earned by investing in a fund that achieved benchmark returns (Figure 5).
Analyzing the sector performance during the month
During the month, appropriate exposure towards the Finance, IT, Diamond & Jewellery and Hospitality sectors contributed towards our outperformance. However, what hurt us is our participation in the Gas Transmission, Chemicals, Realty, and Healthcare sectors that did not do well in the index. Below is the attribution analysis for the month of October 2023 (Table 9).
| Table 9: Sectorwise Attribution Analysis for the month ending October 2023 | |||
| Sector | Portfolio Contribution | Benchmark Contribution1 | Difference |
| Finance | 1.35% | -0.06% | 1.41% |
| IT | 0.47% | -0.32% | 0.79% |
| Diamond & Jewellery | 0.48% | 0.02% | 0.46% |
| Hospitality | 0.40% | -0.03% | 0.43% |
| Bank | -0.47% | -0.82% | 0.35% |
| Retailing | 0.27% | 0.00% | 0.27% |
| FMCG | 0.09% | -0.15% | 0.24% |
| Crude Oil | 0.00% | -0.17% | 0.17% |
| Capital Goods | 0.03% | -0.12% | 0.15% |
| Iron & Steel | 0.00% | -0.15% | 0.15% |
| Aviation | 0.15% | 0.01% | 0.14% |
| Power | 0.00% | -0.13% | 0.13% |
| Infrastructure | 0.00% | -0.10% | 0.10% |
| Media & Entertainment | 0.08% | -0.01% | 0.09% |
| Automobile & Ancillaries | -0.06% | -0.12% | 0.06% |
| Non – Ferrous Metals | 0.00% | -0.06% | 0.06% |
| Telecom | 0.00% | -0.06% | 0.06% |
| Logistics | 0.00% | -0.03% | 0.03% |
| Inds.Gases & Fuels | 0.00% | -0.03% | 0.03% |
| Textile | 0.02% | -0.01% | 0.03% |
| Consumer Durables | 0.00% | -0.03% | 0.03% |
| Diversified | 0.00% | -0.02% | 0.02% |
| Construction Materials | 0.00% | -0.01% | 0.01% |
| Plastic Products | 0.00% | -0.01% | 0.01% |
| Ship Building | 0.00% | -0.01% | 0.01% |
| Abrasives | 0.00% | -0.01% | 0.01% |
| Business Services | 0.00% | 0.00% | 0.00% |
| Agri | 0.00% | 0.00% | 0.00% |
| Paper | 0.00% | 0.00% | 0.00% |
| Miscellaneous | 0.00% | 0.00% | 0.00% |
| Ratings | 0.00% | 0.00% | 0.00% |
| Alcohol | 0.00% | 0.01% | -0.01% |
| Electricals | -0.05% | -0.04% | -0.01% |
| Mining | 0.00% | 0.03% | -0.03% |
| Insurance | -0.07% | -0.01% | -0.06% |
| Trading | -0.12% | -0.03% | -0.09% |
| Healthcare | -0.29% | -0.20% | -0.09% |
| Chemicals | -0.35% | -0.14% | -0.21% |
| Realty | -0.18% | 0.04% | -0.22% |
| Gas Transmission | -0.47% | -0.04% | -0.43% |
AIF Performance and other details
Aggregate Fund Returns over various time periods
Since inception, we have maintained relatively higher levels of cash (21.6% on average over the entire period from inception) from time to time over the duration of managing the fund. Notwithstanding the same, from inception and over one year, we have generated returns of 21.9% and 36.0% in INR terms and 15.2% and 33.5% in USD terms beating the benchmark BSE500 TRI returns and ETF tracking S&P 500 index, respectively after fees before taxes. (Table 10).
| Table 10: Sameeksha AIF performance2 in different periods since inception | |||||||
| Particulars | Fund Returns % (INR) (A) | S&P BSE 500 TRI% (B) | Alpha vs S&P BSE 500 TRI% (A-B) | Fund Returns % (USD) (C) | SPY ETF (%) (D) | Alpha vs SPY ETF (%) (C-D) | Average Cash level% |
| Since inception 1 | 21.9 | 7.7 | 14.2 | 15.2 | -4.1 | 19.2 | 21.6 |
| 1 year | 36.0 | 9.6 | 26.4 | 33.5 | 8.3 | 25.2 | 7.6 |
| 6 Months | 27.4 | 10.9 | 16.5 | 21.8 | 0.5 | 21.2 | 6.7 |
| 3 Months | 8.6 | -1.4 | 10.0 | 4.5 | -8.6 | 13.1 | 11.9 |
| 1 Month | 1.7 | -2.9 | 4.6 | 1.1 | -2.2 | 3.3 | 16.1 |
Aggregate Fund Performance On A Financial Year And Calendar Year Basis
For the month of October, Sameeksha AIF has outperformed the benchmark BSE 500 TRI by generating 1.7% returns (including the current incomplete financial year) against the benchmark BSE500TRI returns of (2.9)%. Looking at our performance over the financial years (Table 11), we have outperformed our benchmark in FY 2023 and we continue to outperform in the current incomplete FY 2024. For the financial year 2024 till date, we have positioned ourselves well by outperforming the benchmark BSE500 TRI by 17.1%.
| Table 11: Financial year wise fund performance since inception | |||
| Particulars | Portfolio Returns % 3 | S&P BSE 500 TRI % | Alpha vs S&P BSE 500 TRI |
| FY242 | 33.1 | 16.0 | 17.1 |
| FY23 | 5.4 | -0.9 | 6.3 |
For the calendar year 2023 till date, we have outperformed the benchmark BSE500 TRI by 23.8%. Despite being a new fund with gradual deployment of cash, we were still able to produce alpha for calendar year 2022 and outperformed the benchmark BSE500 TRI by 3.6%. (Table 12)
| Table 12: Calendar year wise fund performance since inception | |||
| Particulars | Portfolio Returns % 3 | S&P BSE 500 TRI % | Alpha vs S&P BSE 500 TRI |
| CY232 | 33.2 | 9.4 | 23.8 |
| CY223 | 7.4 | 3.8 | 3.6 |
Risk Adjusted Ratios
When compared on a risk-adjusted basis, our AIF shows an even stronger performance with a risk-adjusted alpha generation of 15.2% over the broader market benchmark since its inception. While our portfolio beta has been materially lower than our benchmark, our returns have been higher than the benchmark implying superior strong risk adjusted returns.
Furthermore, other risk-adjusted returns – Sharpe ratio and Treynor ratio, are also significantly higher than the benchmark indices (Table 13).
| Table 13 : Risk Adjusted ratios 1 | ||
| Particulars | Portfolio | S&P BSE 500 TRI |
| Jensen’s Alpha (x) | 15.2 | 0.0 |
| CAPM Beta (x) | 0.5 | 1.0 |
| Sharpe Ratio (x) | 2.0 | 0.6 |
| Treynor (x) | 36.3 | 8.3 |
Performance Within The AIF Universe
We present our rankings among Long Only Category III AIFs who report their post expense pre tax returns. For the period ending 31st October, 2023, we are ranked 2nd out of 23 AIFs (Table 14), or Top Decile.
| Table 14 :Comparison of Sameeksha AIF with Long Only AIFs (post exp pre tax returns) | |
| Returns Generated | 1 year |
| Sameeksha AIF | 36.0% |
| Average | 22.5% |
| Median | 21.6% |
| Median Among Top 5 AIFs | 32.1% |
| Sameeksha AIF Rank within the Multicap Category | 2nd out of 23 |
| Sameeksha AIF Decile 1 Rank within the Universe | Top Decile |
| Sameeksha AIF Percentile Rank | Top 5% |
Cumulative Performance Versus The Benchmark
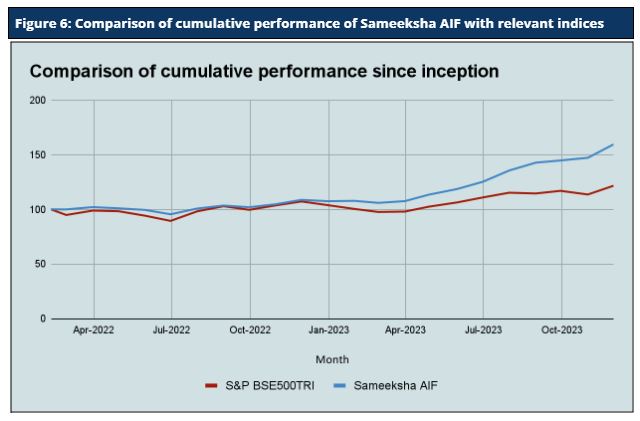
Sameeksha AIF’s outperformance over its benchmark has continued to widen positively since inception. An investment of Rs. 100 with us since inception (Feb 10,2022) would have grown to Rs. 147, far outpacing what one would have earned by investing in a fund that achieved benchmark returns (Figure 6).
Analyzing The Sector Performance During The Month
During the month, our weightage to sectors such as Finance, IT, Hospitality, Banks, and FMCG worked well for us. However, what hurt us is our participation in the Gas Transmission, Chemicals, and Healthcare sectors that did not do well in the index. Below is the attribution analysis for the month of October 2023 (Table 15).
| Table 15: Sectorwise Attribution Analysis for the month ending October 2023 | |||
| Sector | Portfolio Contribution | Benchmark Contribution1 | Difference |
| Finance | 1.12% | -0.05% | 1.17% |
| IT | 0.46% | -0.32% | 0.78% |
| Hospitality | 0.45% | -0.03% | 0.48% |
| Bank | -0.37% | -0.82% | 0.45% |
| Diamond & Jewellery | 0.37% | 0.02% | 0.35% |
| FMCG | 0.07% | -0.15% | 0.22% |
| Retailing | 0.21% | 0.00% | 0.21% |
| Crude Oil | 0.00% | -0.17% | 0.17% |
| Capital Goods | 0.04% | -0.12% | 0.16% |
| Iron & Steel | 0.00% | -0.15% | 0.15% |
| Automobile & Ancillaries | 0.02% | -0.12% | 0.14% |
| Power | 0.00% | -0.13% | 0.13% |
| Aviation | 0.12% | 0.01% | 0.11% |
| Infrastructure | 0.00% | -0.10% | 0.10% |
| Non – Ferrous Metals | 0.00% | -0.06% | 0.06% |
| Telecom | 0.00% | -0.06% | 0.06% |
| Media & Entertainment | 0.05% | -0.01% | 0.06% |
| Logistics | 0.00% | -0.03% | 0.03% |
| Inds. Gases & Fuels | 0.00% | -0.03% | 0.03% |
| Textile | 0.02% | -0.01% | 0.03% |
| Consumer Durables | 0.00% | -0.03% | 0.03% |
| Diversified | 0.00% | -0.02% | 0.02% |
| Construction Materials | 0.00% | -0.01% | 0.01% |
| Plastic Products | 0.00% | -0.01% | 0.01% |
| Ship Building | 0.00% | -0.01% | 0.01% |
| Abrasives | 0.00% | -0.01% | 0.01% |
| Business Services | 0.00% | 0.00% | 0.00% |
| Agri | 0.00% | 0.00% | 0.00% |
| Paper | 0.00% | 0.00% | 0.00% |
| Electricals | -0.04% | -0.04% | 0.00% |
| Miscellaneous | 0.00% | 0.00% | 0.00% |
| Ratings | 0.00% | 0.00% | 0.00% |
| Alcohol | 0.00% | 0.01% | -0.01% |
| Insurance | -0.02% | -0.01% | -0.01% |
| Mining | 0.00% | 0.03% | -0.03% |
| Healthcare | -0.26% | -0.20% | -0.06% |
| Trading | -0.11% | -0.03% | -0.08% |
| Chemicals | -0.27% | -0.14% | -0.13% |
| Realty | -0.12% | 0.04% | -0.16% |
| Gas Transmission | -0.39% | -0.04% | -0.35% |
Disclaimer – The information contained in this update is provided by our fund accounting platform and is not audited.