Financial year 2019 was a challenging year with slowing growth in both global as well as Indian economy. .
An impressive uptick in March ended FY 19 performance of Nifty on a promising note. However, Mid Cap and Small Caps ended in red for the fiscal. Some of the major factors that led to the correction in Mid and Small Cap space can be attributed to :
SEBI mutual fund re-categorization: After the re-classification by SEBI, active managers were forced to trim their position in Mid and Small Cap stocks which were being held in the Large cap funds leading to sell off of these stocks.
Overvaluation: For most of FY 19, Mid Cap and Small Caps were trading at premium to Large caps.Even after the correction, they are still trading at premium to Large caps, however the gap has narrowed down.
Corporate Governance: Corporate Governance issues in some of the Mid and Small Caps led to sell off in the majority of the stocks in this segment.
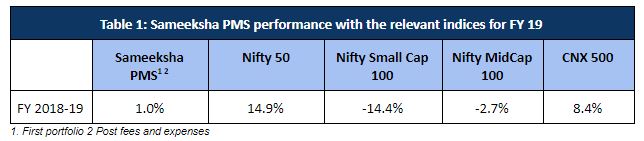
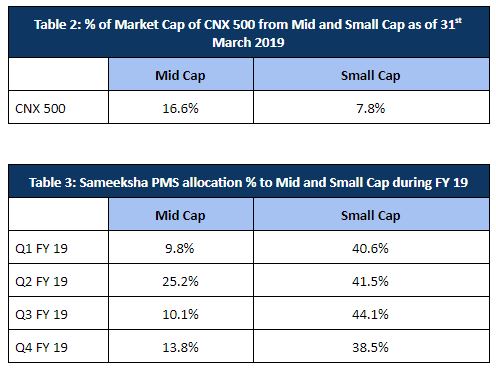
For the year as a whole, we underperformed CNX500, while doing better than small and mid cap indices (Table 1). CNX500 is a market cap weighted index and hence % weight in the index of Small and Mid cap stocks is relatively small (Table 2). On the other hand, we did have meaningful exposure to small and mid cap stocks (Table 3) resulting in under-performance versus CNX500.
Much of the portfolio return can be attributed to the de-rating of the small and mid-cap during the current fiscal.
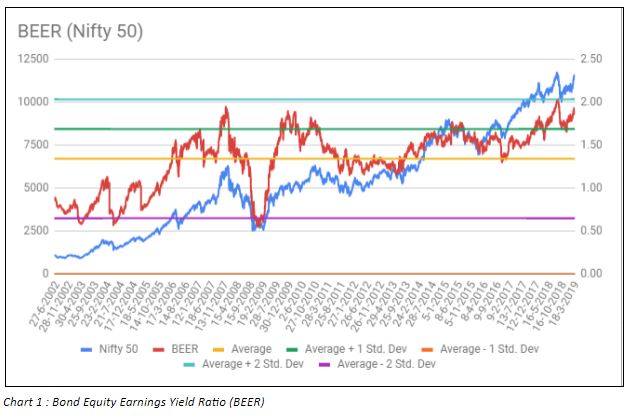
During FY 19, markets as such were overvalued. Based on Bond Equity Earnings Yield ratio (BEER) which compares attractiveness of Bond Markets compared to Equity Markets. As of March 2019, BEER for Nifty was trading at 2.25x which implied Bonds were twice as attractive as Equities and was above its Long Term Average + 2 Std. Deviation level. (Chart 1)
As such, at a broad level, our stock selection was not flawed. We invest with a long term view and will continue to hold our portfolio companies with the conviction that as they keep delivering on quality earnings and free cash flow growth, share prices will eventually reflect the fundamentals.
Another factor that affected our performance was our relatively outsized bet on a large cap stock. Due to stiff competition in the industry, earnings were depressed during the period resulting in moderate stock movement over the fiscal. However, we hope that strong fundamentals , and the stock will tend to benefit from its strong fundamentals and cash flow generation in the coming months.
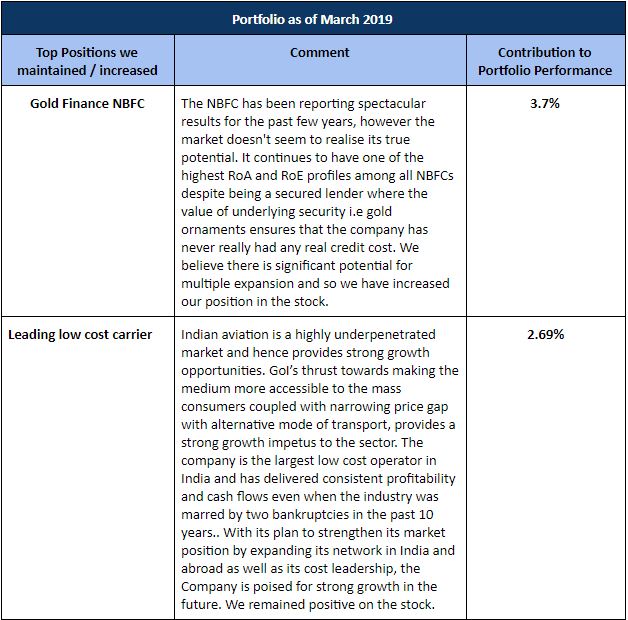
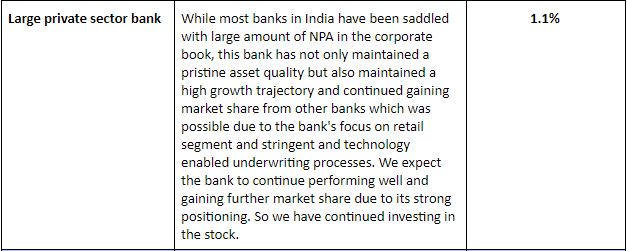
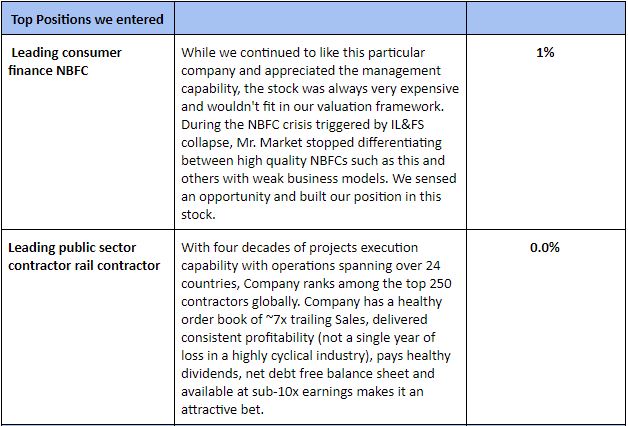
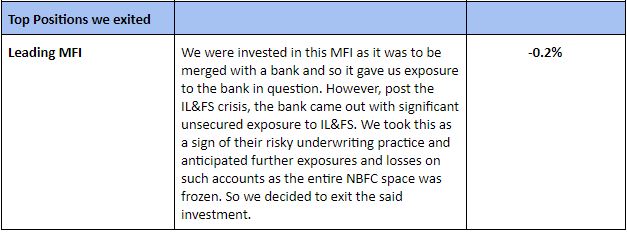
We mention below changes that we made to our top holdings from previous fiscal and stocks that exited and entered our Top Holdings.