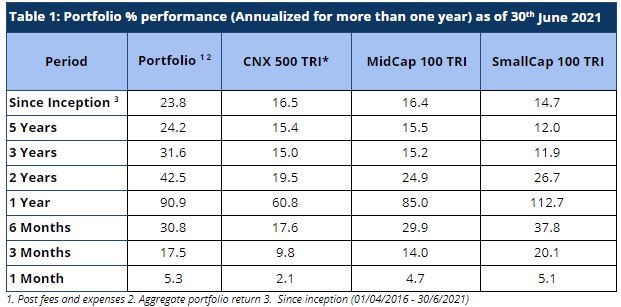
Sameeksha PMS continues to generate market-beating performance with a return of 5.3% versus the benchmark index CNX500 TRI returns of 2.1% for the month of June 2021. On an aggregate basis, Sameeksha PMS has delivered a CAGR return of ~24% versus CNX500 TRI return of 16.5% since inception. Portfolio returns for clients who have been with us for around five years or longer have been even higher. For all the relevant periods i.e., one year, two years, three years, five years and since inception, Sameeksha PMS has delivered strong alpha and achieved top decile ranking, a fairly uncommon achievement.
This outperformance has been achieved despite maintaining average cash levels of above 10% over the entire period. As a result, our strong alpha has translated into strong risk adjusted returns as well.
Portfolio Returns
Broader markets remained upbeat for June 2021 with CNX 500 TRI generating 2.1% returns. Sameeksha PMS delivered a strong performance for the month with a significant alpha of 3.2% over the benchmark index (Table 1).
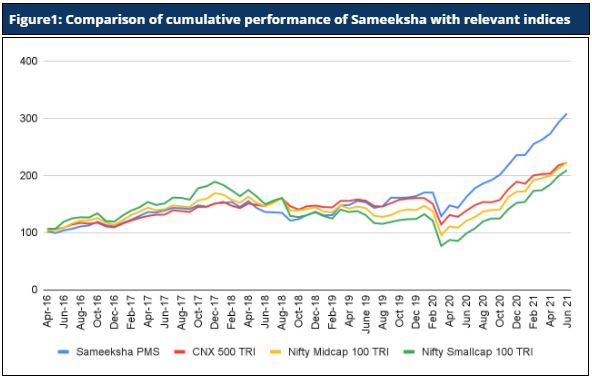
Strong alpha over longer periods can make a big difference to ending portfolio value. Rs. 100 invested at the time of inception in Sameeksha PMS has grown to Rs. 300+ (Figure 1), far outpacing what one would have earned by investing in a fund that achieved benchmark returns. We would note however that the vast majority of mutual funds and PMSes have found it difficult to beat the broad benchmark (CNX500 TRI).
Performance Within The PMS Universe
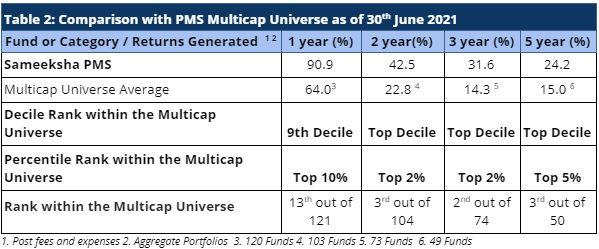
We continue to maintain our top rankings both within the multicap PMS universe as well as the entire PMS universe. The multicap PMS universe rankings are more relevant to us since we follow multicap strategy.
We have retained our rankings within the top 10 percentiles across the periods (Table 2) and have remained among the top 5 PMSes for the periods of two, three and five years.
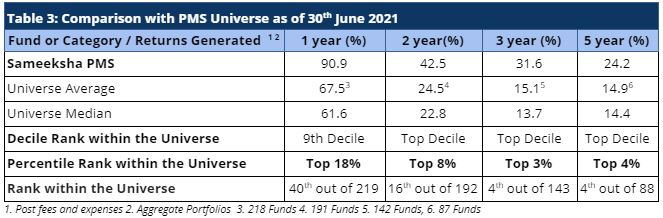
In comparison with the entire PMS universe, we have sustained our top ranking for longer durations of two, three and five years. Sharp rally in small cap and mid cap stocks has enabled PMSes focussed on those categories to deliver strong performance. Still, we have come through within the top two deciles across all PMSes (Table 3).
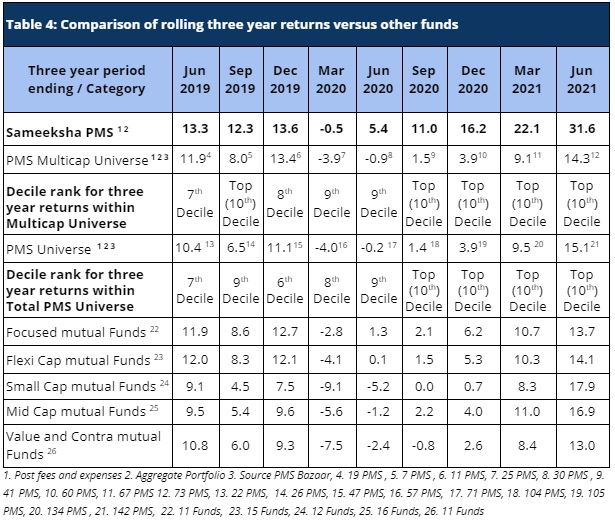
Comparison Of Rolling Returns With Other Funds
Rolling returns provide a much better picture than single period returns – which can often be distorted with one-off performances. For a three year period ending June 2021, we have meaningfully outperformed all the major relevant mutual fund categories that we are comparable with and have maintained our top decile ranking across both our comparable universe of Multicap PMSes as well as across the entire PMS universe (Table 4).
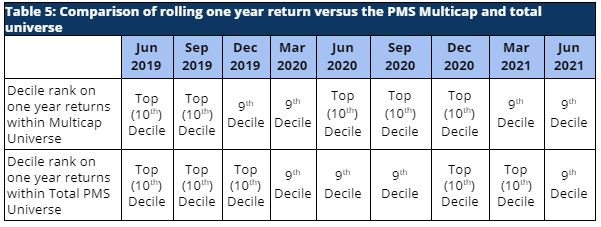
Similarly, our rolling one year returns have been strong and we have maintained our rankings in the top two deciles, across the PMS universe, consistently in the last two years (Table 5).
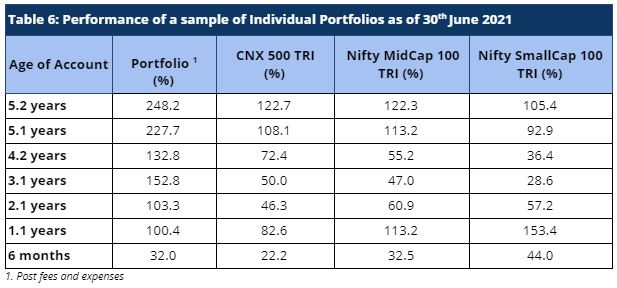
Performance Of Individual Portfolios
Irrespective of their investment timings, the portfolio returns of our clients continue to outpace the benchmarks by a significant margin (Table 6). For a long term investor, Sameeksha PMS has proven to be a valuable partner for their investments.
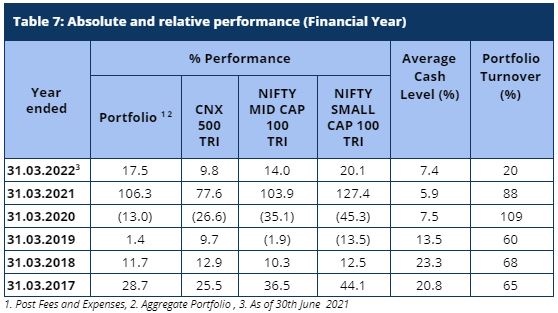
Fund Performance On A Financial Year Basis
Sameeksha PMS generated a return of 17.5% in three months (April – June 2021) of the current financial year ending March 2022, outperforming its benchmark index CNX 500 TRI – which returned 9.8% over the same period (Table 7). This outperformance has been achieved despite maintaining average cash levels of 7.4% – indicating strong risk adjusted returns as well.
For the invested portion of our portfolio (i.e. excluding cash) we have clearly out-performed our benchmark every financial year except one and our cumulative out-performance is far greater than the under-performance in that one year.
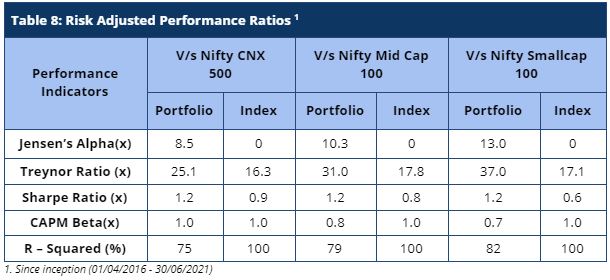
Risk Adjusted Ratios
Sameeksha PMS continues to deliver very strong risk adjusted performance (Table 8), with a risk adjusted alpha generation of 8.5% annually over the broad market benchmark since its inception.
Furthermore, other risk adjusted returns – Sharpe ratio and Treynor ratio, are also significantly higher than the benchmark indices (Table 8).
Please let us know if you have any questions.
Disclaimer : The information contained in this update is based on data provided by our fund accounting platform and is not fully audited.