*Period ending 28th February, 2026, ** Three-year period for PMS and AIF, also five year period for PMS, *** Rolling five-year returns of all the Multicap PMSes reporting to PMS Bazaar, **** For rolling five year periods from inception till date, ***** Five-year Period
February 2026 was a month of significant transition for the Indian economy, defined by a persistent tug-of-war between strong domestic fundamentals and a darkening global horizon. While the month began with a focus on the Union Budget and its long-term fiscal roadmap, the market mood was soon tempered by a series of external shocks, ranging from fresh U.S. tariff announcements on key exports like solar components to the unsettling military buildup in West Asia. These global pressures created a climate of risk aversion that kept indices under constant strain, yet the downside was consistently buffered by the immense resilience of local investors. On the macroeconomic front, India’s annualized retail inflation edged up to a ten-month high of 3.21% under the revised 2024 base year—primarily driven by a localized spike in food and precious metal prices—but this did little to dampen the broader growth narrative. In fact, underlying economic strength prompted an upgrade in GDP estimates to a range of 7.5% to 7.6%, underscoring a robust internal demand that remained shielded from the global fray. Ultimately, the month was a story of an economy anchoring itself against a gathering storm, successfully pricing in the energy shocks and geopolitical volatility that would only fully erupt with the outbreak of conflict on the final day of the month.
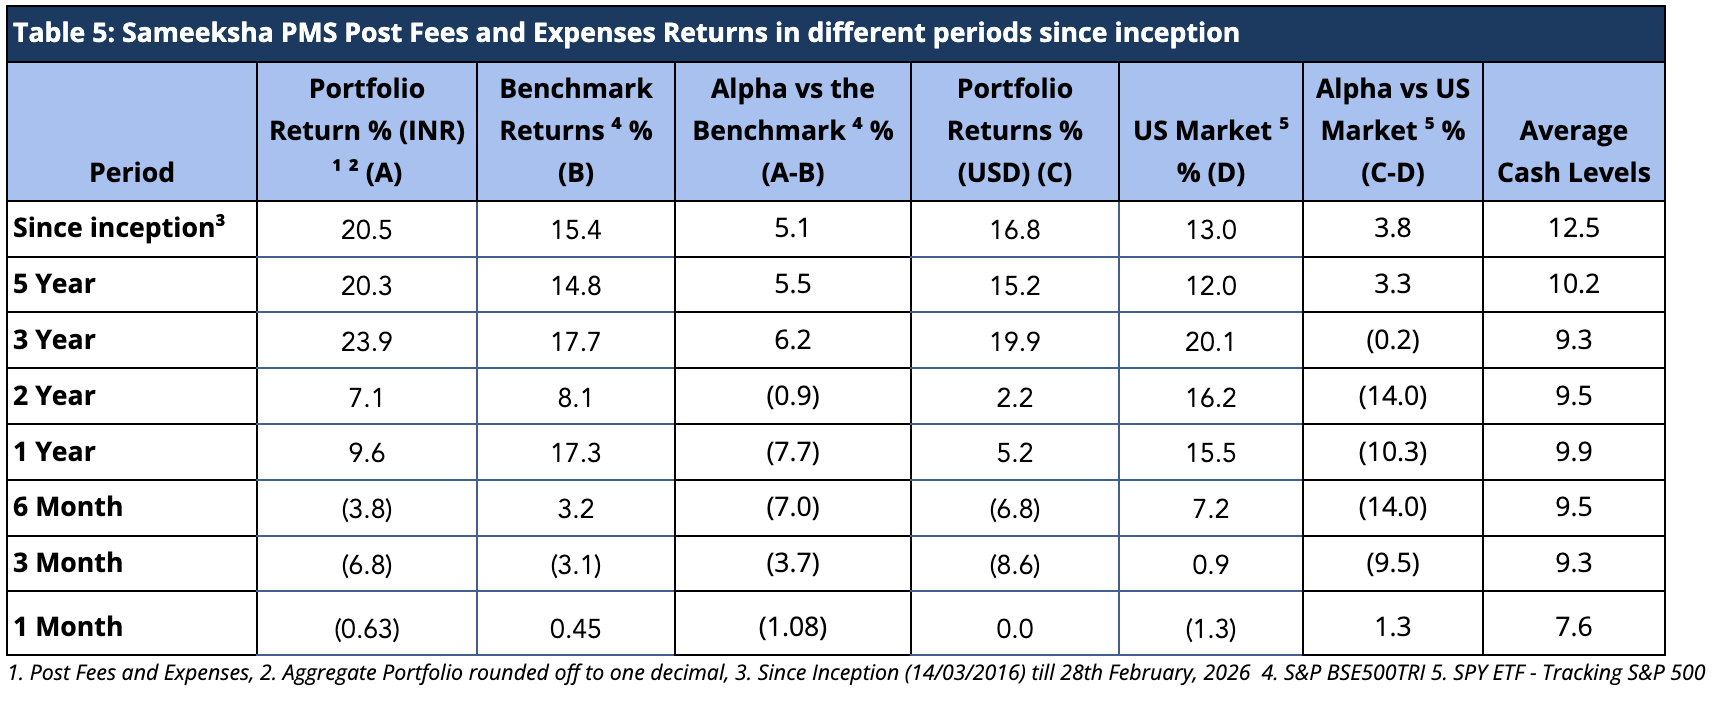
In February 2026, the benchmark S&P BSE 500 TRI rose by 0.45% and NIFTY Small Cap 250 TRI rose by 0.81%. Against that, Sameeksha PMS (Portfolio Management Service = Separately Managed Accounts) was down by 0.63% (net of all fees and expenses), indicating an underperformance of 1.08% against S&P BSE 500 TRI and an underperformance of 1.44% against NIFTY Small Cap 250 TRI; while having cash levels of 9.5% at the start of the month and 7.6% at the end of the month. Still, February marked the sixtieth consecutive month of delivering meaningful alpha on a rolling five year period basis.
Sameeksha Domestic AIF (Alternative Investment Fund = “Hedge Fund”) recently completed four years of operating history. This AIF ranks at number four out of fifty Long-Only AIFs reporting their performance to PMS Bazaar for three-year period ending 28th February, 2026. February marked thirteenth consecutive months of delivering alpha on a rolling three year period basis. In February, 2026, our AIF was down by 0.14% (post fees, expenses and taxes), indicating a slight underperformance of 0.59% over the benchmark.
After rising 535% on absolute terms and 51% annualized over a period from March 25, 2020 to September 23, 2024, Nifty Small Cap 250 TRI index has struggled, falling 11% since then till 28th February 2026. Given the weak performance of the Indian market over this period of almost eighteen months, it is worth looking back at our performance during this period of extended slump. During the said period, Nifty Small Cap 250 TRI is down 9.5%, BSE 500 TRI is down 3.3% and against that our PMS is down 2% on a post fees and expenses basis and our AIF is down 1.2% on post fees, expenses and tax basis. Considering consistently high (~60%) exposure to small cap and below space in our strategy, performance comparison with both the broad BSE 500 TRI and Nifty Small Cap 250 TRI is appropriate.
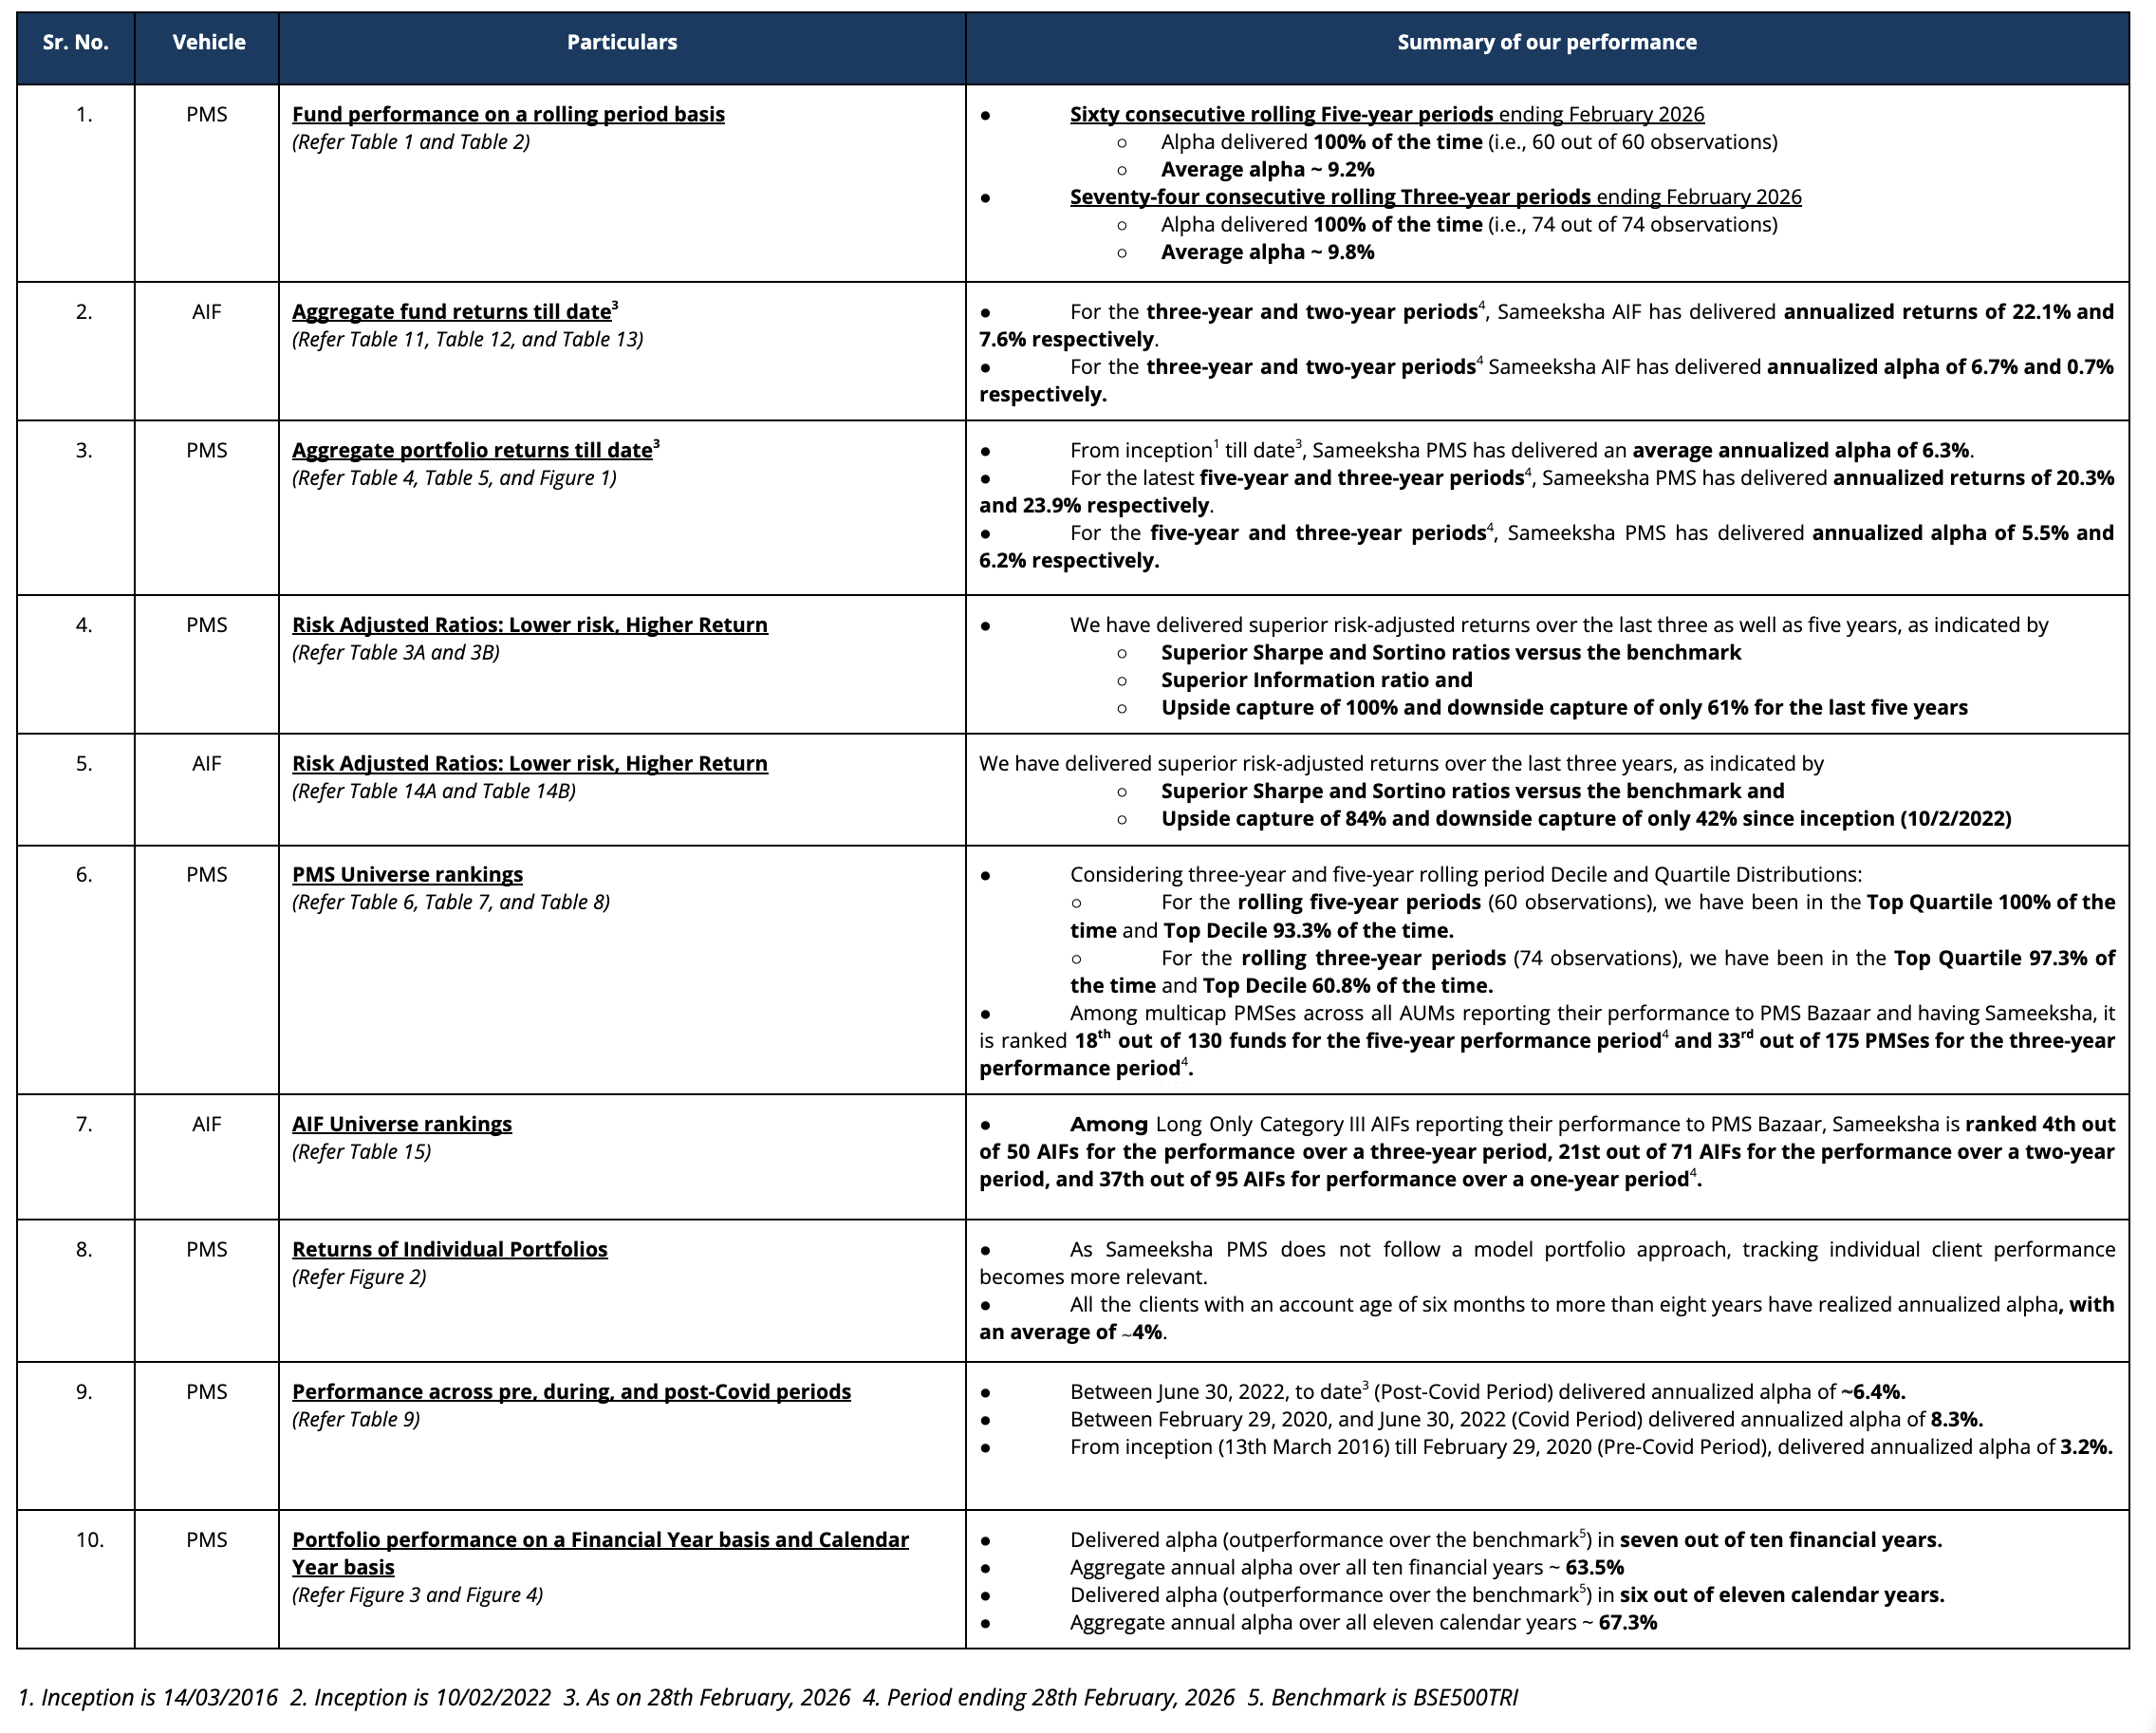
We summarize key aspects of our performance for period ending 28th February 2026 as follows:
PMS Performance and other details
Three important things must always be kept in mind when looking at performance data. First, for funds such as ours that do not follow a model portfolio strategy, the performance of individual clients over different durations is important to examine. Second, some PMSes may charge fees outside the PMS, which could make their performance data non-comparable to ours after fees. Third, it is important to look at not only portfolio returns but also risk-adjusted ratios. We provide data to address all three points later in this note.
Aggregate Portfolio Performance and ranking on a rolling period basis
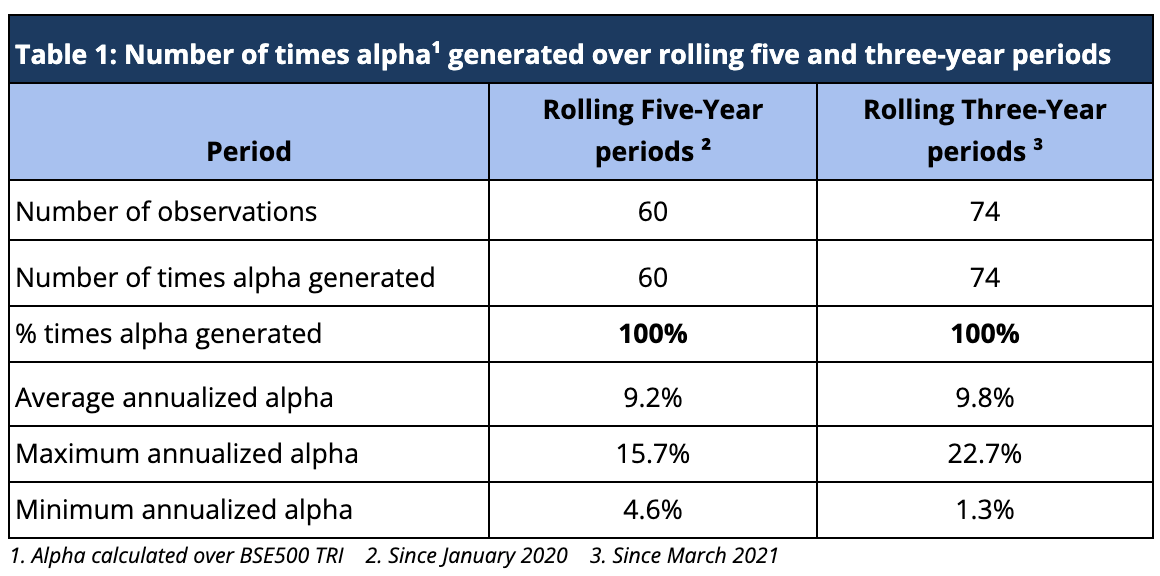
Rolling returns are a more useful indicator of consistency in performance versus single-period returns. For the rolling five-year periods applicable from March 2021 till date, Sameeksha PMS has delivered aggregate annualized alpha 100% of the time (60 out of 60 observations), ranging from ~5% to ~16%. For the rolling three-year periods applicable from January 2020 till date, Sameeksha PMS has delivered aggregate annualized alpha 100% of the time (74 out of 74 observations), ranging from ~1% to ~23% (Table 1). For both rolling five and three-year periods covered in Table 1, alpha has averaged around 9.2% and 9.8% respectively.
To analyze the rolling five-year and three-year returns, we did an insightful exercise, analyzing average five-year and three-year rolling returns across different time frames.
The table below (Table 2) presents Sameeksha PMS’s portfolio performance using rolling five-year and three-year returns. This method evaluates returns over overlapping periods ending on each date within a given time range. By averaging these rolling returns over different lookback periods, we gain a deeper understanding of how consistently the portfolio has delivered value over time, compared to the BSE 500 TRI benchmark.
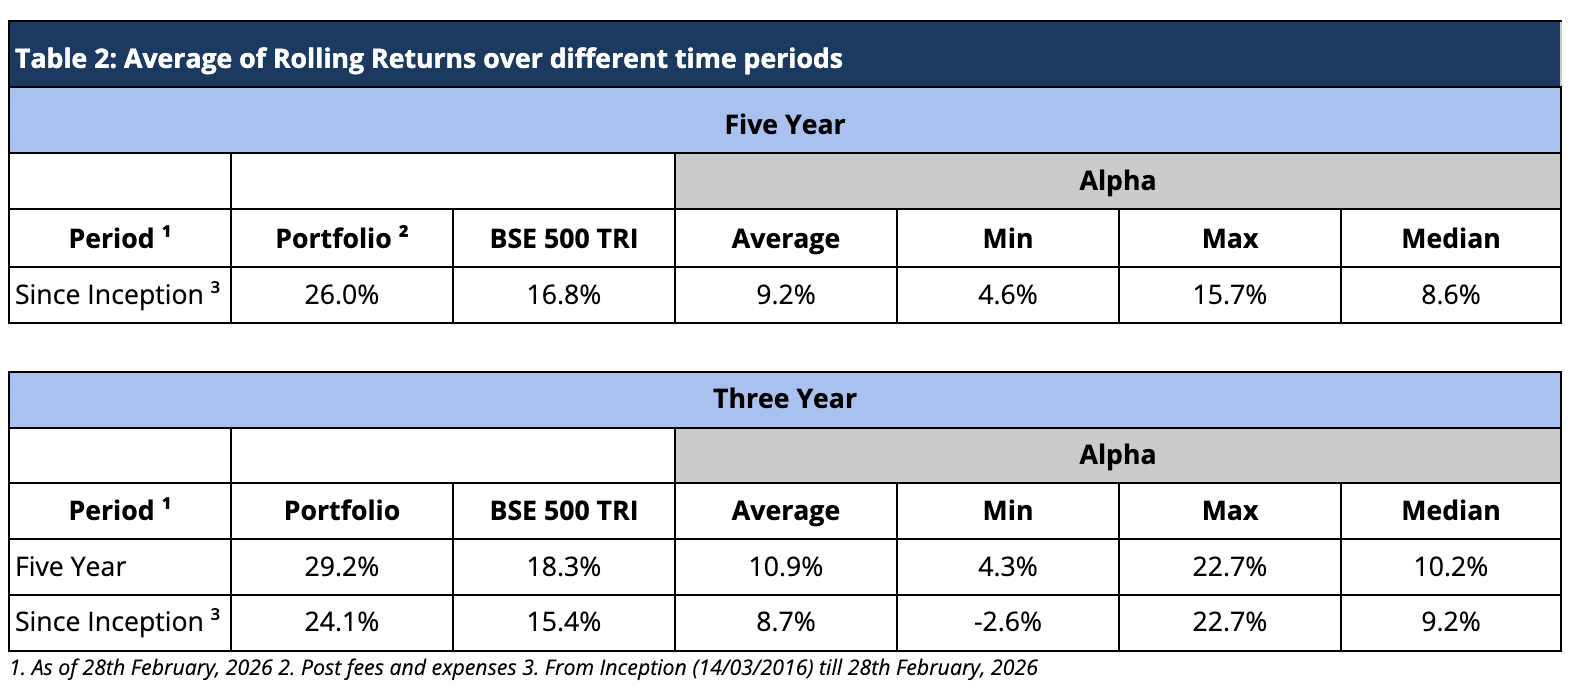
The results reveal a strong and persistent pattern of outperformance. Across all measured periods, average three-year or five-year rolling returns have consistently outpaced the benchmark. What stands out in particular is the stability of alpha across different lookback periods. This consistency suggests that the portfolio’s success is not driven by isolated bets or favorable market timing, but rather by a disciplined and repeatable process. The rolling return framework helps illustrate that this performance is not a result of temporary market positioning but instead reflects a reliable, long-term approach to investing.
Risk Adjusted Ratios: Not all returns are the same, Higher Returns at lower Risk
When compared on a risk-adjusted basis, our PMS has shown an even stronger performance. The Information Ratio (IR) measures the excess return of a portfolio over a benchmark per unit of active risk. A higher Information Ratio suggests better risk-adjusted performance.
Moreover, Upside Capture measures how well a fund performs as compared to a benchmark when the benchmark has positive returns. A higher upside capture ratio (>100%) indicates that the fund captures more of the benchmark’s positive movements. Whereas, Downside Capture measures how well a fund performs compared to a benchmark when the benchmark has negative returns. A lower downside capture ratio (<100%) indicates that the fund preserves capital better during market downturns (Table 3A).
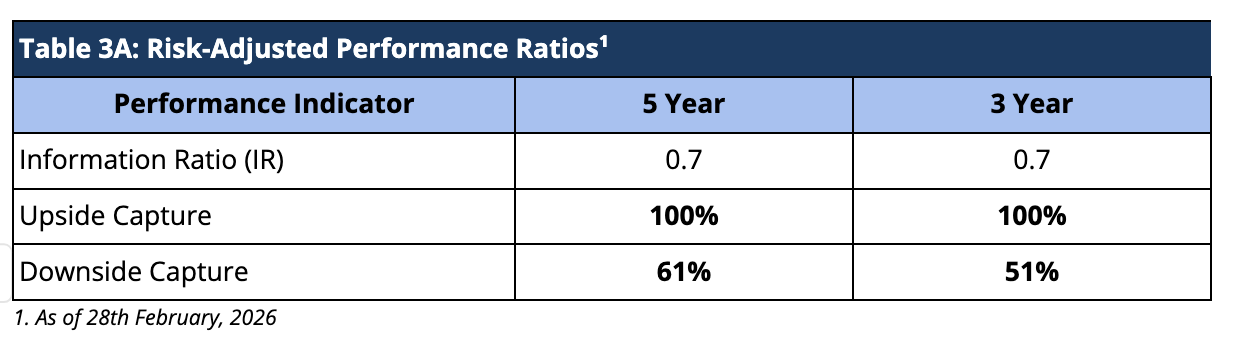
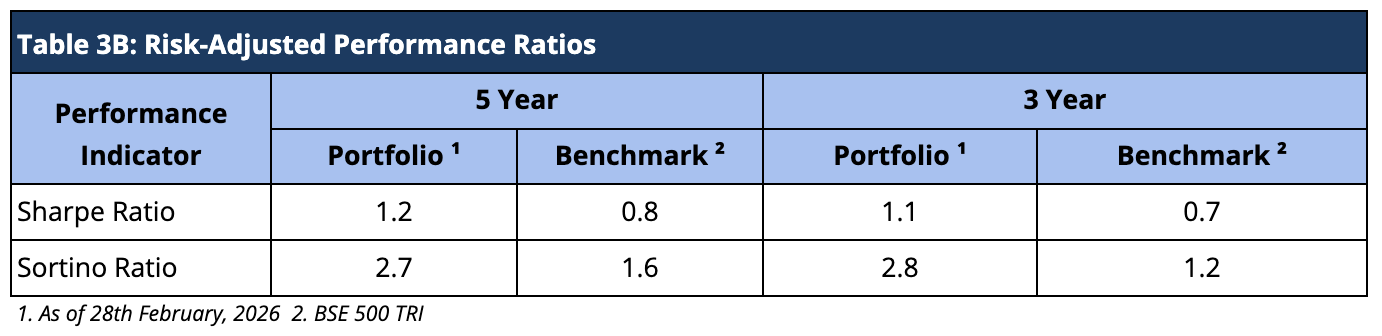
Furthermore, other risk-adjusted returns – Sharpe ratio is also significantly higher. The Sortino ratio measures the risk-adjusted return of an investment, focusing only on the downside risk. A higher Sortino ratio indicates better risk-adjusted returns, particularly concerning downside risk (Table 3B).
Aggregate Portfolio Returns over various time periods
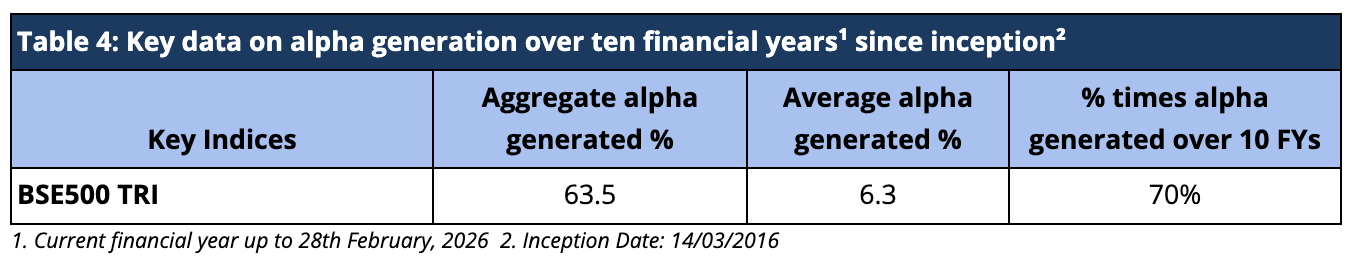
Sameeksha PMS has delivered a substantial aggregate annual alpha of 63.5% over BSE500 TRI over the ten financial years (including the current incomplete financial year), implying an average alpha of 6.3% since inception (Table 4).
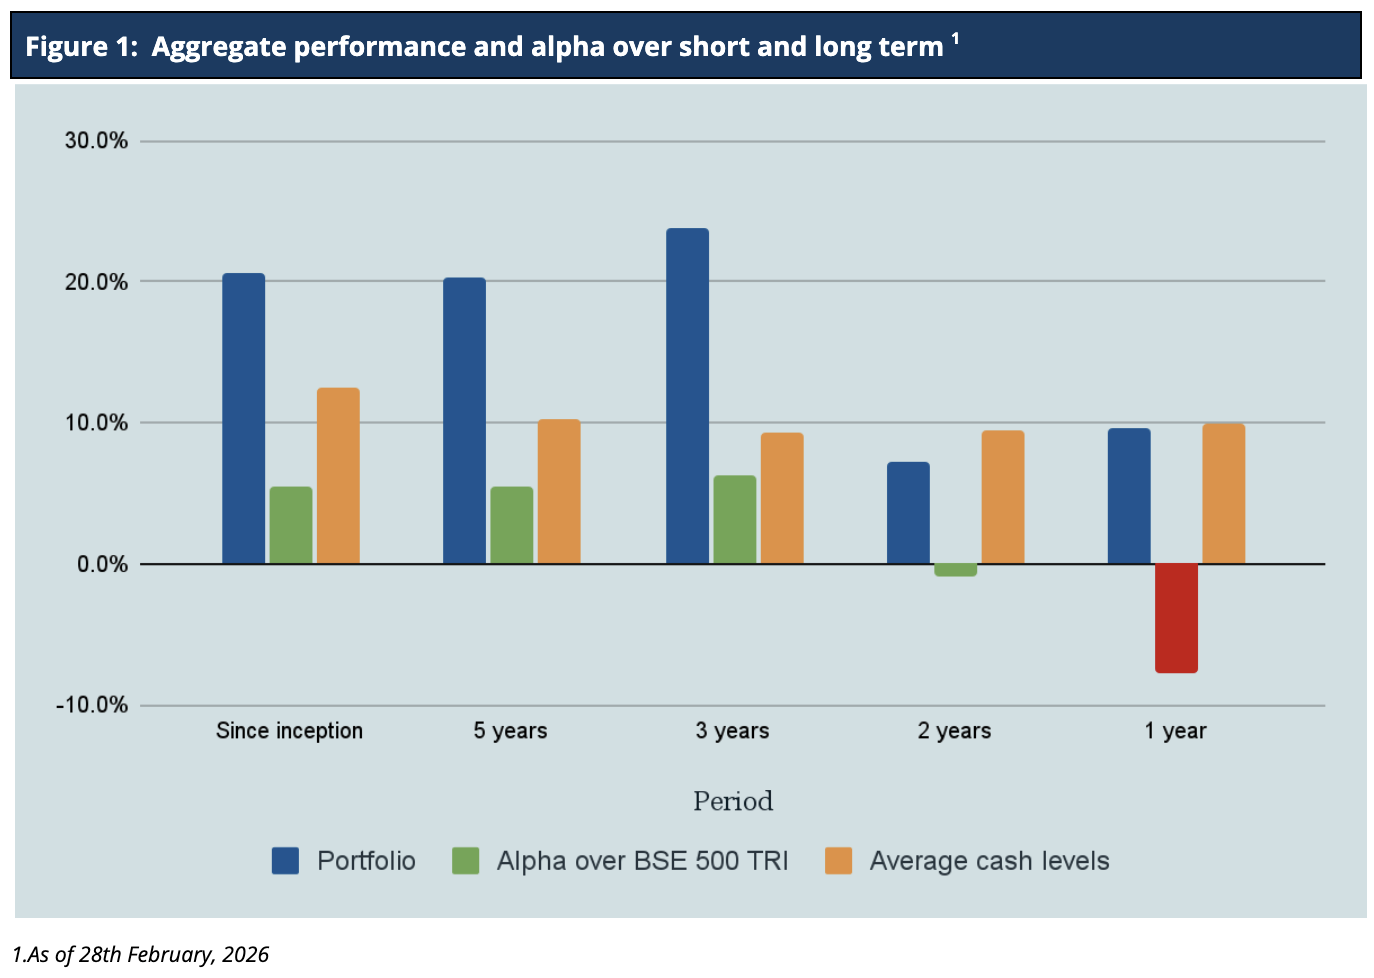
It is important to note that we have maintained relatively higher levels of cash (12.5% on average over the entire period since inception) from time to time throughout the management of the portfolio. Notwithstanding the same, from inception, over five years and three years respectively, we have generated returns of 20.5%, 20.3% and 23.9% in INR terms and 16.8%, 15.2%, and 19.9% in USD terms, thus generating substantial alpha over the Indian benchmark BSE500 TRI. Also, we have delivered strong returns relative to benchmark across various key time periods (Figure 1 and Table 5).
Performance within the PMS Universe
We continue to maintain our top rankings both within the multicap PMS universe as well as the entire PMS universe for key periods of three and five years. The multicap PMS universe rankings are more relevant to us since we follow the multicap strategy.
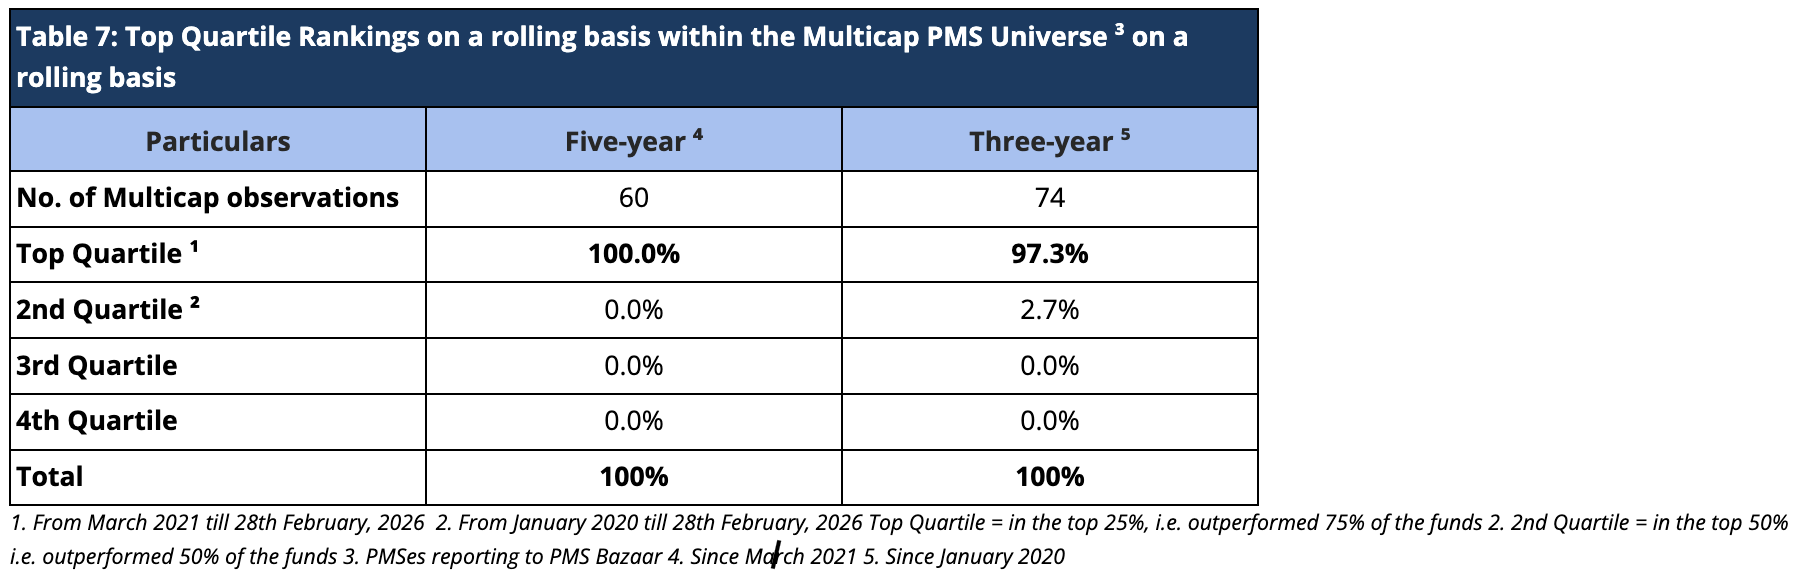
For rolling three-year periods applicable since January 2020, we have been ranked among the multicap universe in the Top Decile 60.8% of the time (45 out of 74 observations) and in the Top Quartile 97.3% of the time (72 out of 74 observations). For rolling five-year periods applicable to our entire operating history, we have been ranked among the multicap universe in the Top Quartile 100% (60 out of 60 observations) and Top Decile 93.3% of the time (56 out of 60 observations) (Tables 6 and 7).
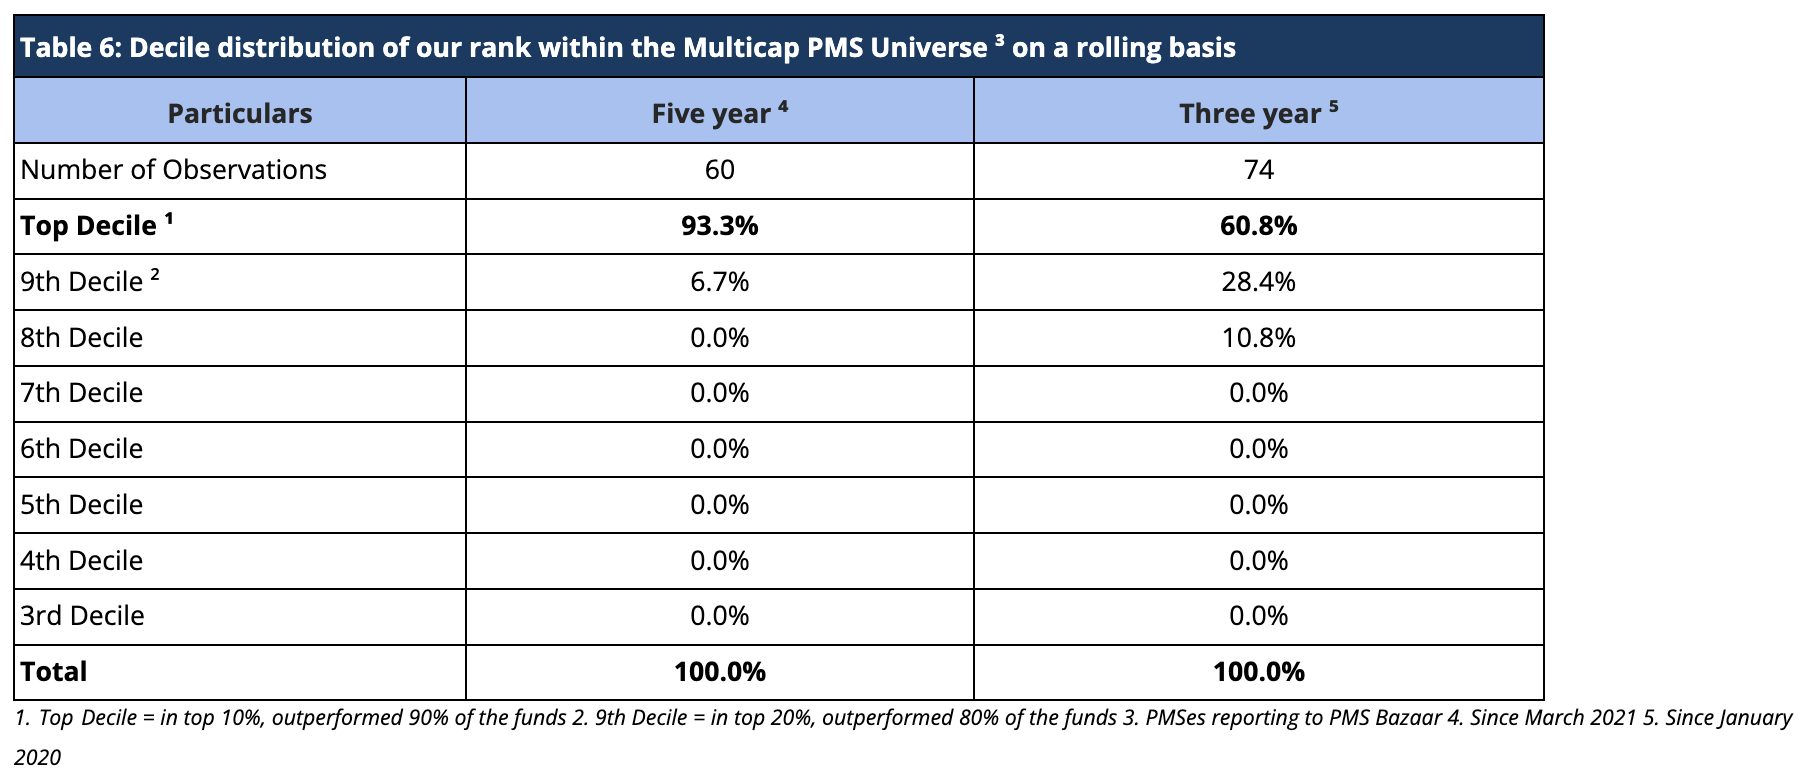
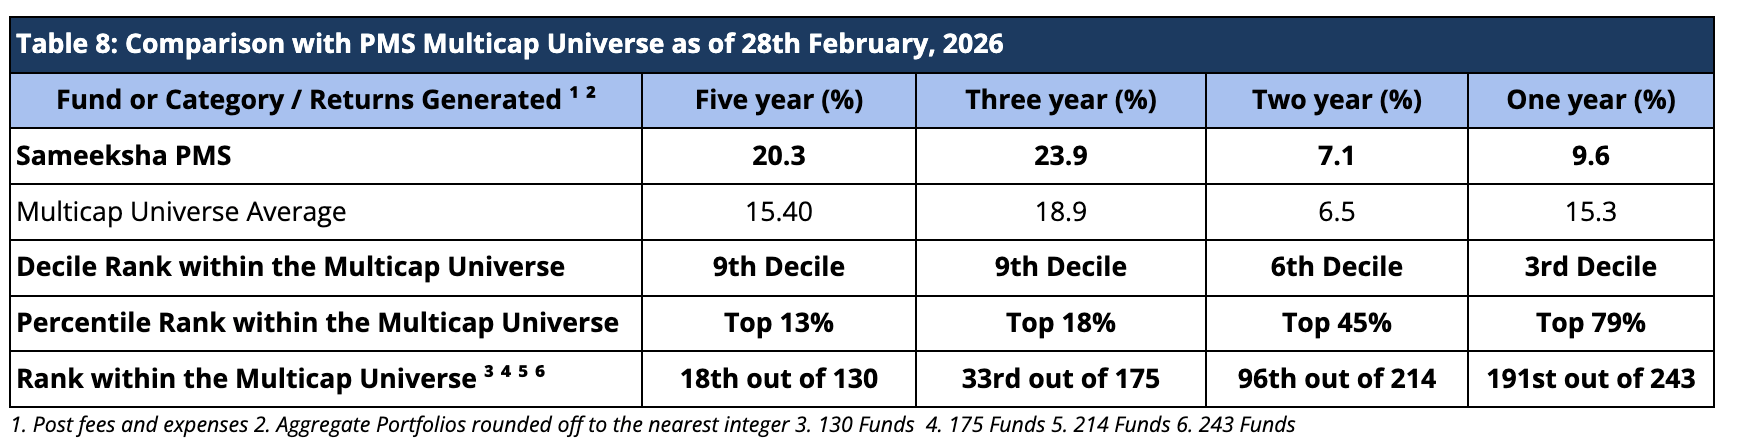
We present our rankings among the multicap PMSes across all AUM sizes. Within this universe, we are 18th out of 130 PMSes for the five year period and 33rd out of 175 PMSes for three-year period, highlighting our superior performance over the long term periods (Table 8). Among the multicap universe across all AUM sizes, we are consistently ranked in the Top Decile for the five-year period for 56 out of 60 observations, reflecting well on the consistency of our performance.
Returns of Individual Portfolios
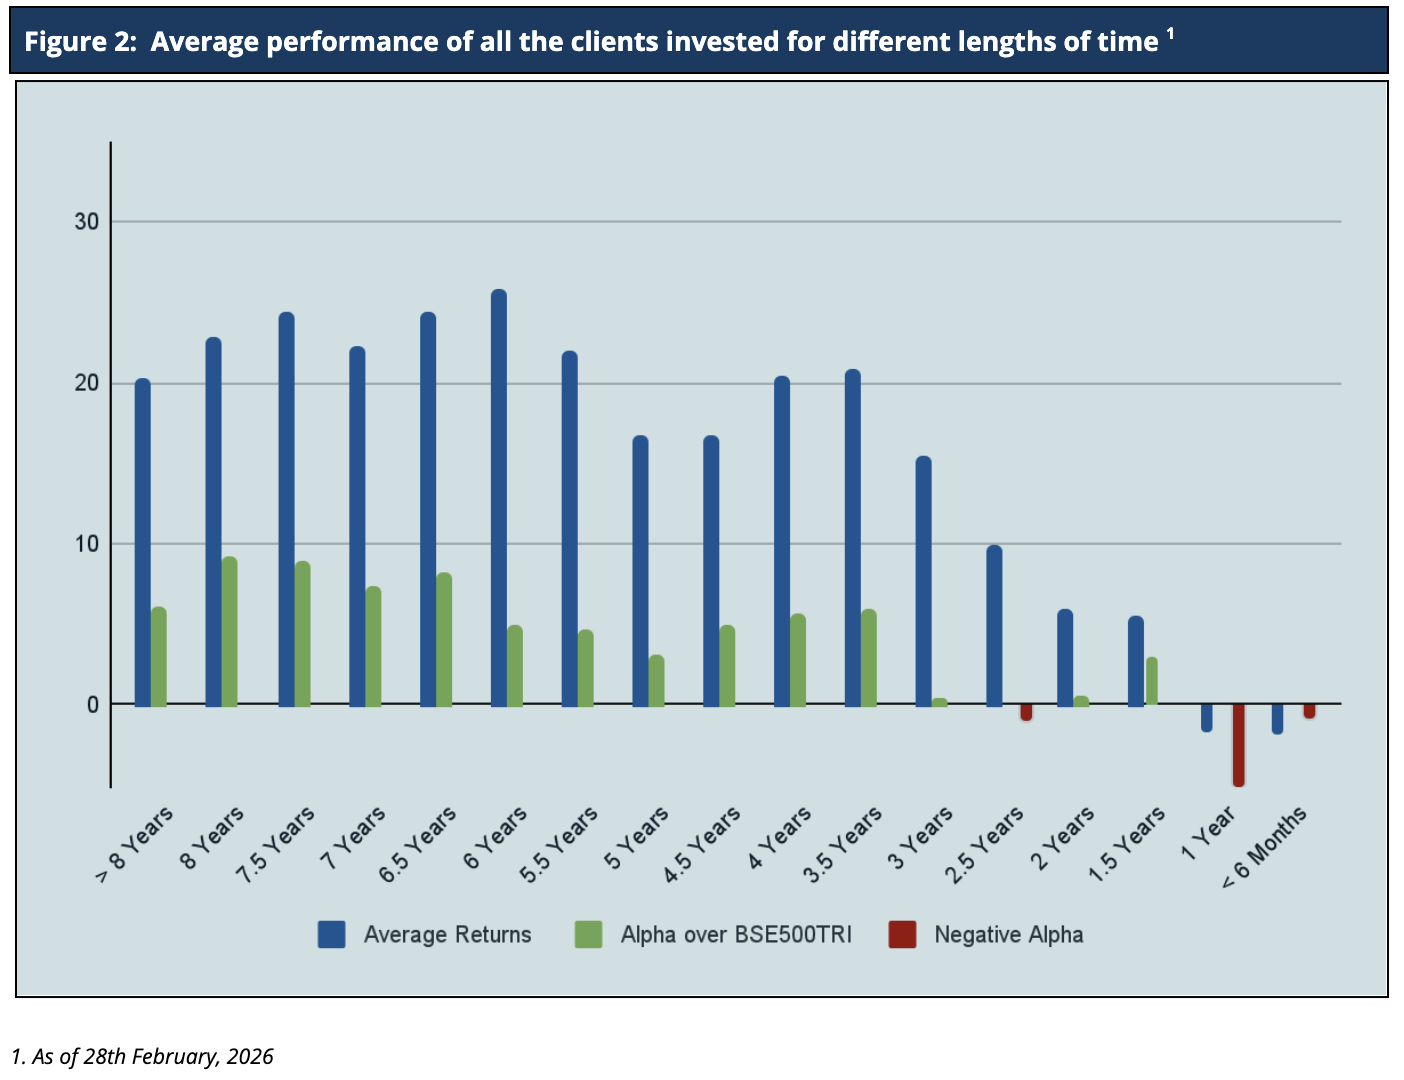
Because we don’t follow a model portfolio strategy, the performance of individual clients is far more important than overall portfolio aggregate returns (Figure 2). For investors who have been with us for five years or more, Sameeksha PMS has returned an alpha with an average annualized alpha of approx. 4% for the five years ending 28th February, 2026. Similarly, for investors who have been with us for three years or more, Sameeksha PMS has returned alpha with an average annualized alpha of approx. 4.8% for the three years ending 28th February, 2026. The Figure below shows the average annualized returns and alpha over different periods of time of all the clients as on 28th February, 2026.
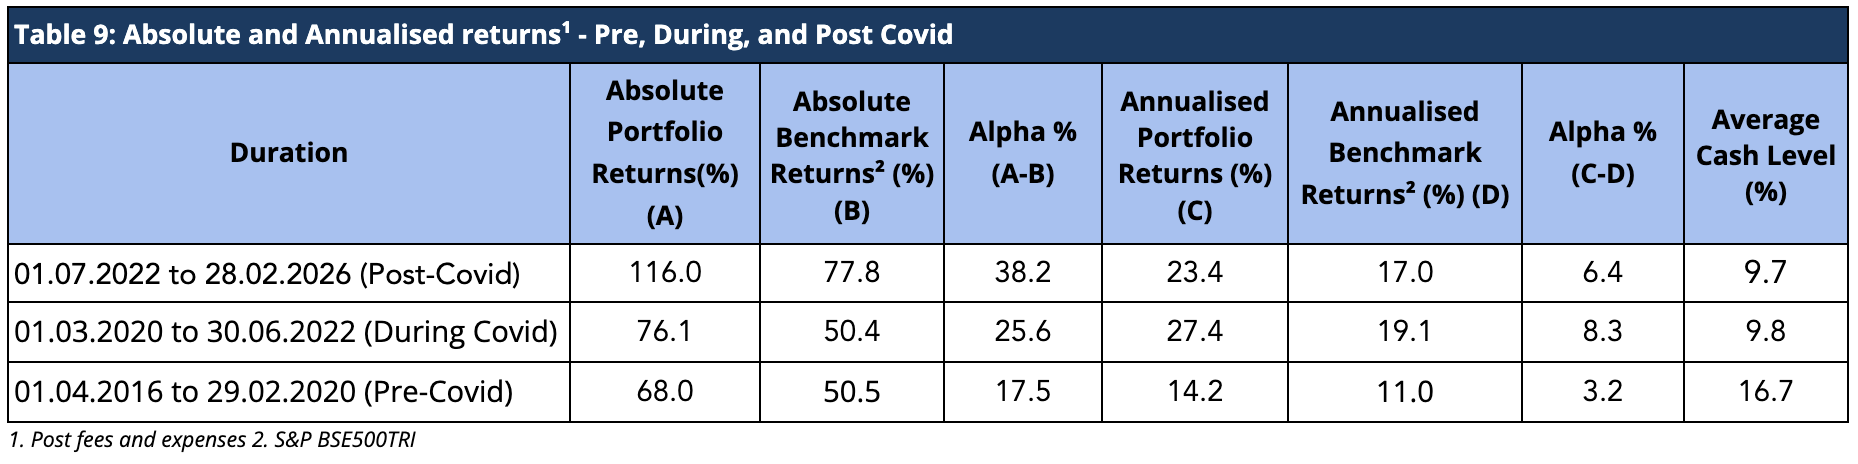
Performance Of PMS Over The Covid Timeline (Pre, During, And Post)
The COVID-19 pandemic induced significant volatility in the equity markets. Hence, it is useful to look at the performance across three time slices: Pre-COVID, During Covid, and Post-Covid. Sameeksha PMS has outperformed the benchmark across all three time periods with meaningful alpha (Table 9). This consistency of performance may be an important factor in comparing us with the other funds.
Aggregate Portfolio Performance on a financial year and calendar year basis
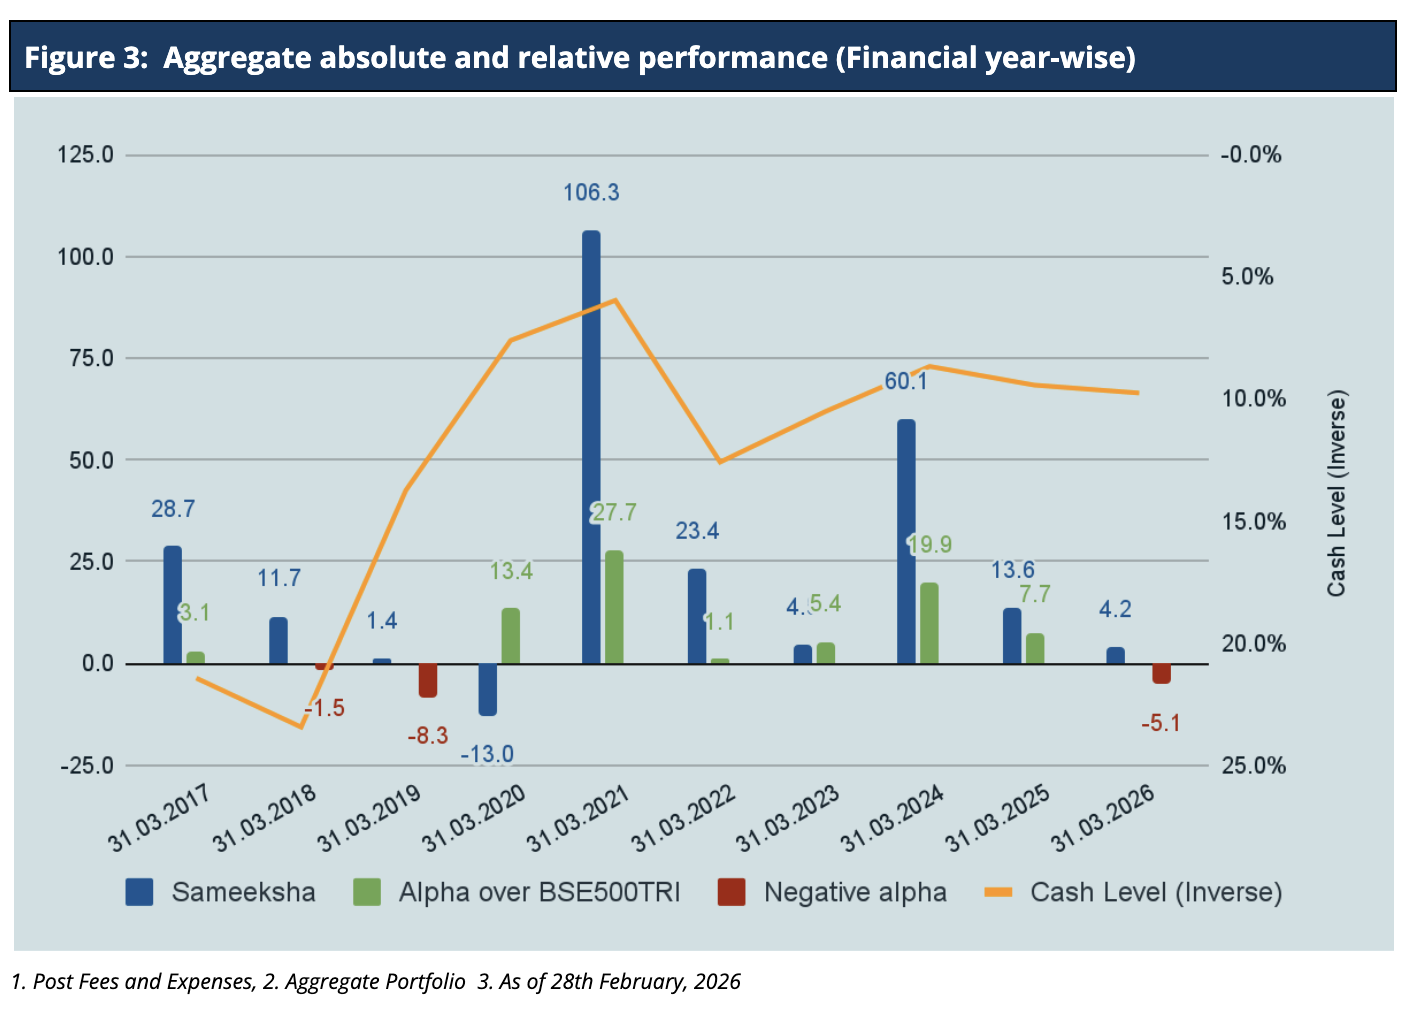
For February, Sameeksha PMS has underperformed the benchmark BSE 500 TRI by 1.1%. For Financial Year 2025-26, we have underperformed BSE500 TRI by 5.1%. Looking at our performance over the financial years (Figure 3), we have outperformed our benchmark in seven out of ten financial years. Key however, is that the sum of outperformance of 78.4% in those seven years far exceeds the sum of underperformance of 14.9% in the remaining three years.
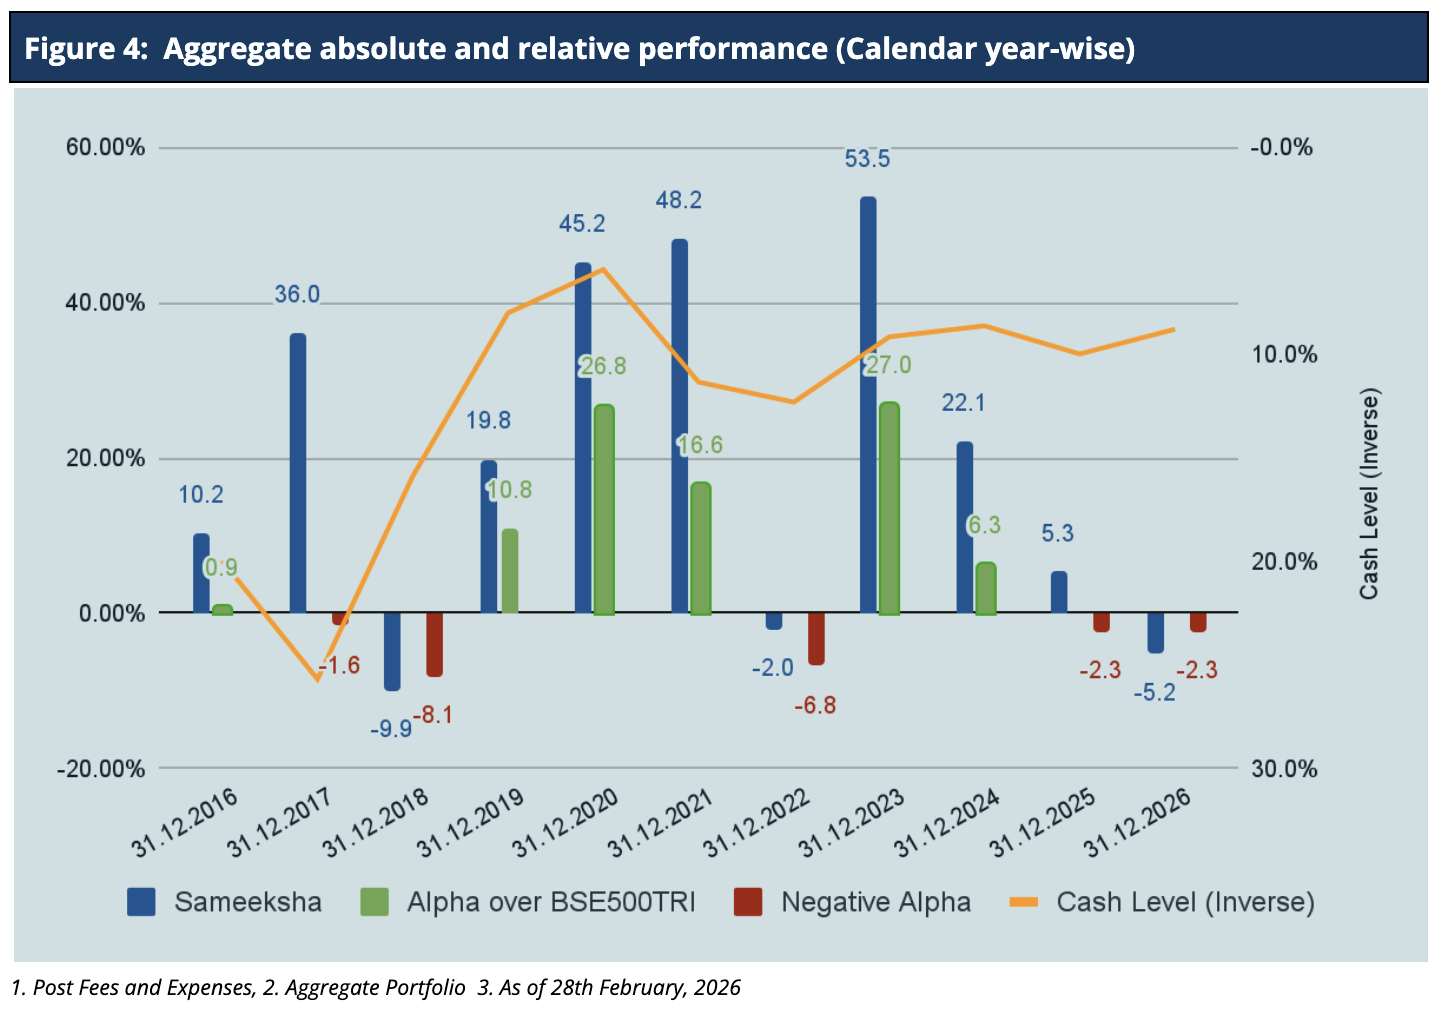
For the Calendar Year 2026, our performance was roughly 2.3% lower than the BSE 500 TRI benchmark, indicating underperformance. Looking at our performance over calendar years (Figure 4), we have outperformed the benchmark in six out of eleven calendar years, and the sum of outperformance of 88.4% in six years far exceeds the sum of underperformance of 21.1% in the remaining five years.
It is important to note that we delivered this alpha despite maintaining an average cash level of 12.5% across the ten financial years.
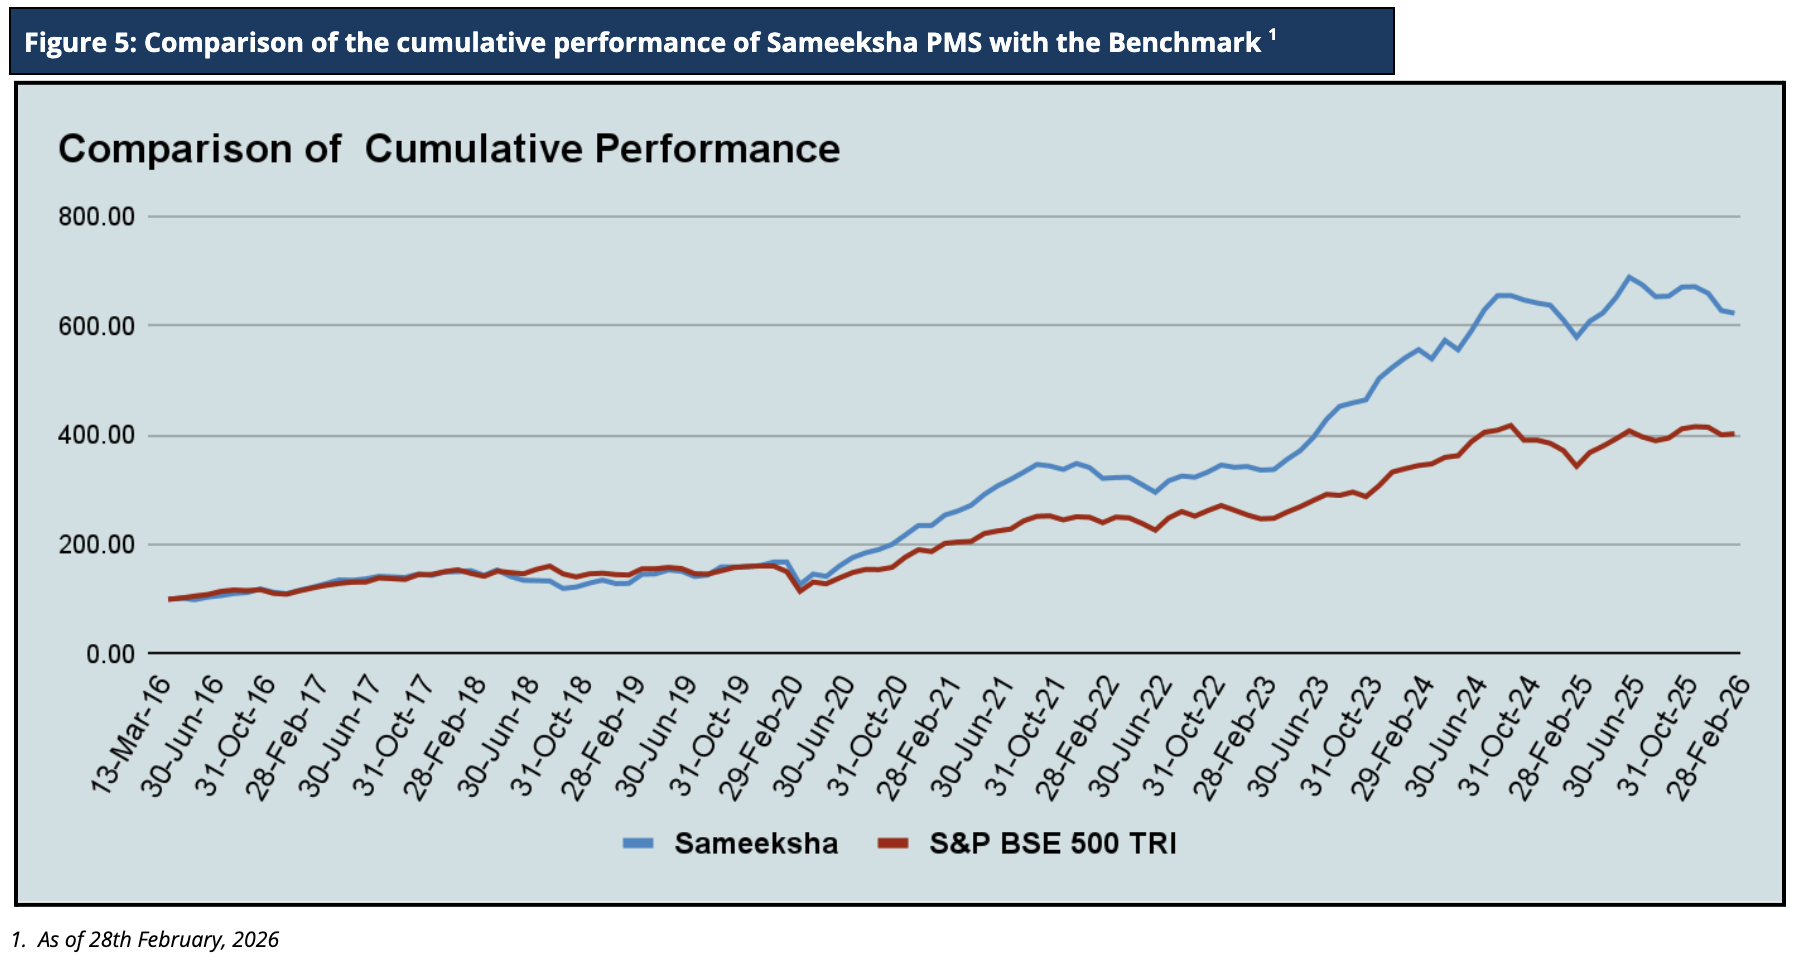
Cumulative Performance versus the benchmark
Sameeksha PMS’s outperformance over its benchmark has continued to widen positively over the years. An investment of Rs. 100 with us since inception (March 2016) would have grown to Rs. 623.2, far outpacing what one would have earned by investing in a fund that achieved benchmark returns (Figure 5).
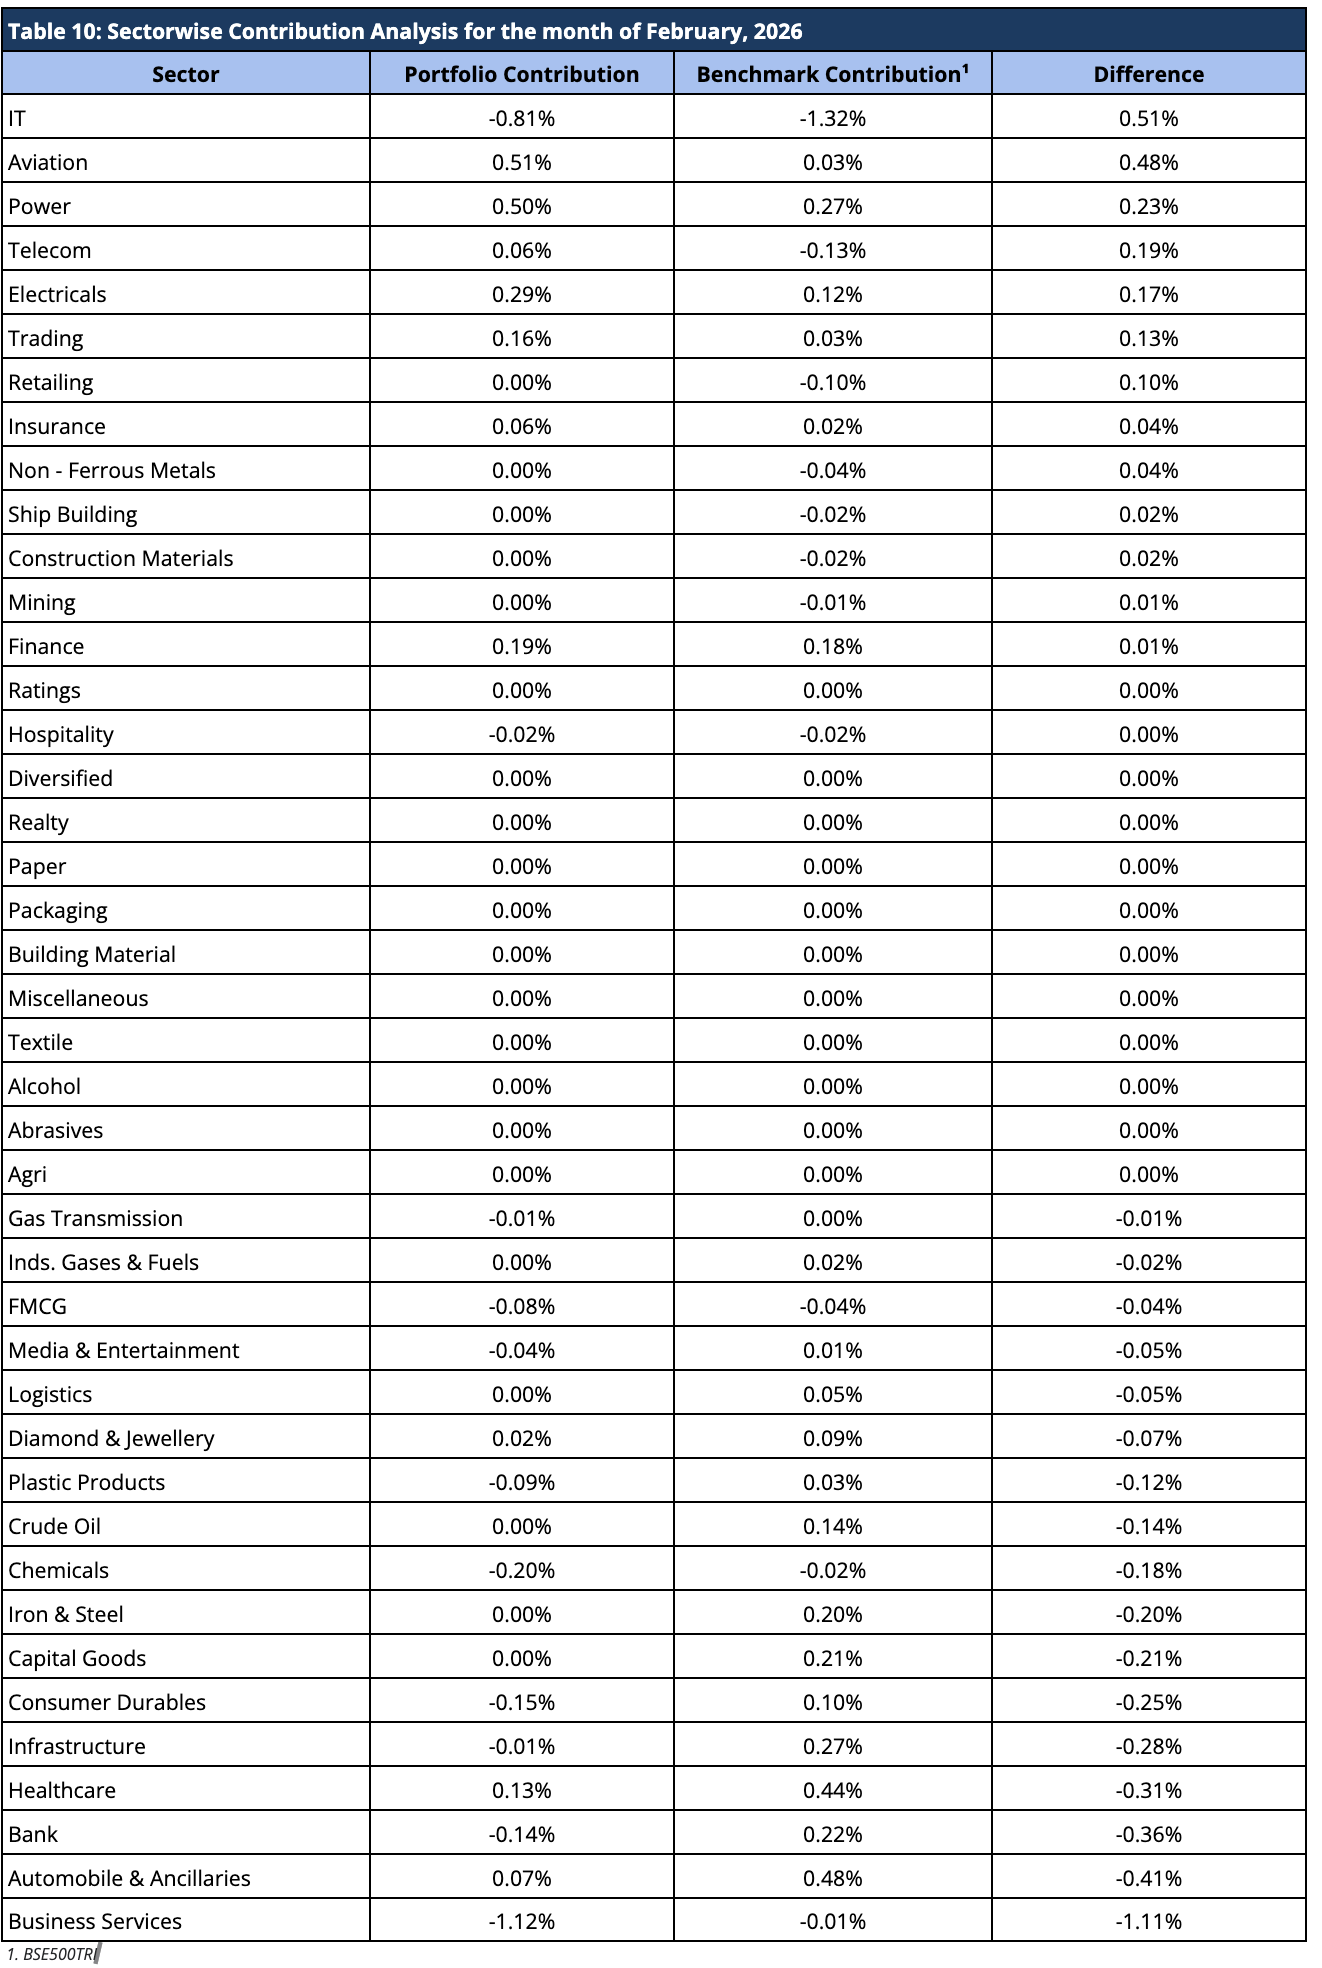
Analyzing the sector performance during the month
The PMS portfolio underperformed the benchmark in February 2026. The portfolio performed well in sectors like IT, Aviation, Power and Telecom with additional support from Electricals, Trading and Retailing relative to the benchmark. However, sectors such as Business Services, Automobile & Ancillaries, Bank, Healthcare, Infrastructure and Consumer Durables underperformed significantly relative to the benchmark. Overall, while selective sector exposures added value, broad-based weakness across several key segments led to portfolio underperformance for the month.
Below is the contribution analysis for the month of February 2026 (Table 10).
AIF Performance and other details
Aggregate Fund Returns over various time periods
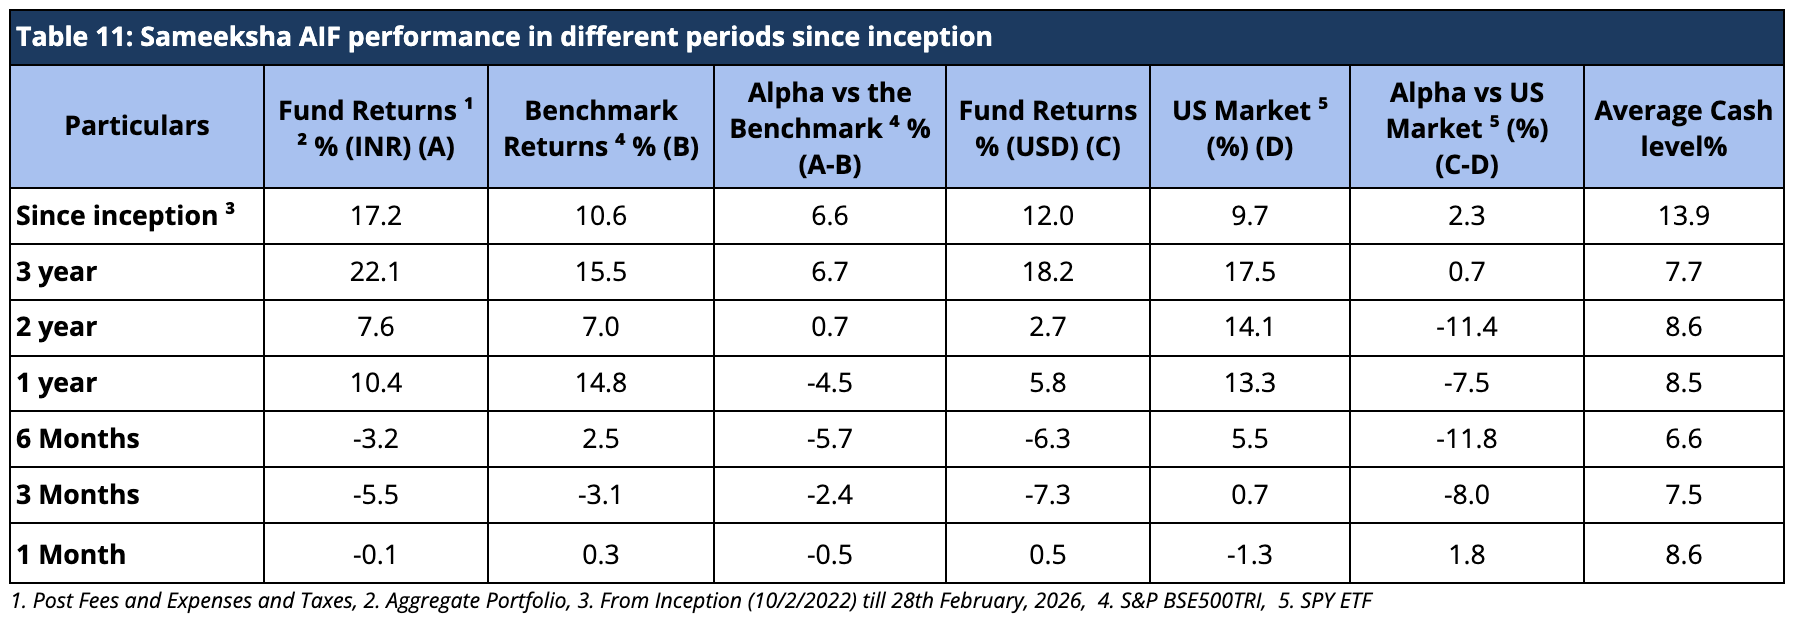
Since inception, we have maintained relatively higher levels of cash (13.9% on average over the entire period from inception) from time to time throughout the management of the fund. Notwithstanding the same, from inception, over three years and two years, we have generated returns of 17.2%, 22.1% and 7.6% in INR terms and 12%, 18.2% and 2.7% in USD terms, beating the benchmark BSE 500 TRI returns and ETF tracking S&P 500 index, respectively, after fees, expenses and taxes in since Inception and three-year time period (Table 11).
Aggregate Fund Performance on a Financial Year and Calendar Year basis
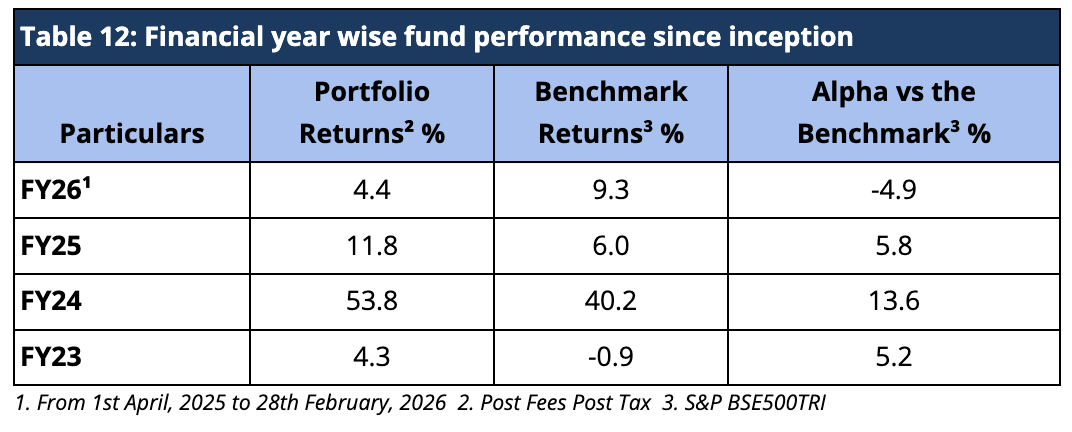
For FY26, Sameeksha AIF has underperformed the benchmark BSE 500 TRI by generating 4.4% returns against the benchmark BSE 500 TRI returns of 9.3%. Looking at our performance over the financial years (Table 12), we have outperformed our benchmark in FY 2023, FY 2024, and FY 2025.
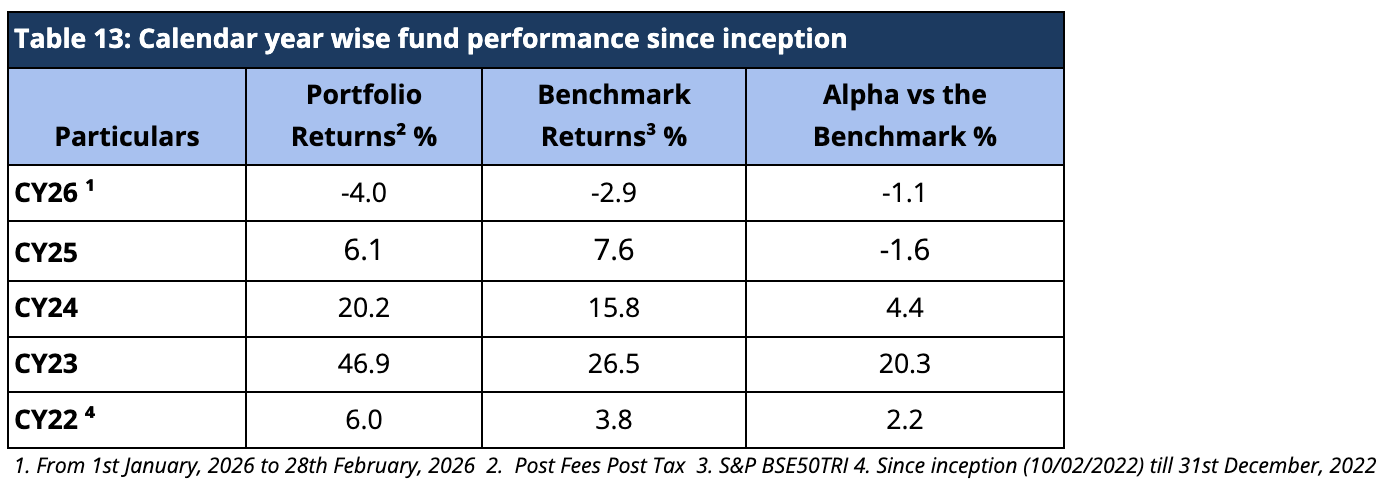
For the Calendar year 2026, we have underperformed the benchmark BSE 500 TRI by 1.1%. Despite being a new fund, we were still able to produce alpha for calendar years 2022, 2023, and 2024 and outperformed the benchmark BSE500 TRI by 2.2%, 20.3% and 4.4% respectively (Table 13).
Risk Adjusted Ratios
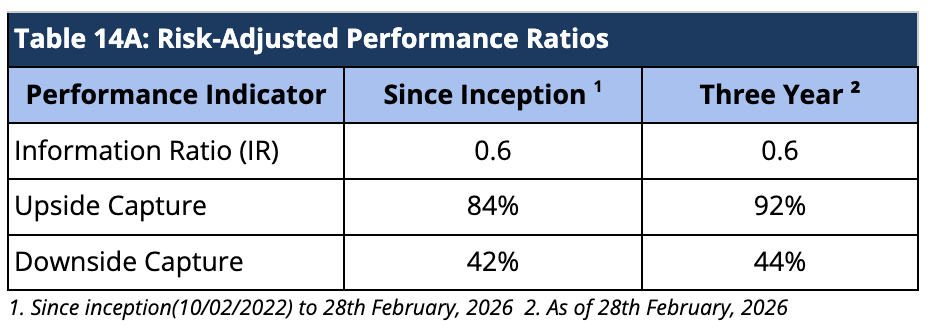
When compared on a risk-adjusted basis, our AIF has shown an even stronger performance. The Information Ratio (IR) measures the excess return of a portfolio over a benchmark per unit of active risk. A higher Information Ratio (IR) suggests better risk-adjusted performance.
Moreover, Upside Capture measures how well a fund performs as compared to a benchmark when the benchmark has positive returns. A higher upside capture ratio (> 100%) indicates that the fund captures more of the benchmark’s positive movements. Whereas, Downside Capture measures how well a fund performs compared to a benchmark when the benchmark has negative returns. A lower downside capture ratio (< 100%) indicates that the fund preserves capital better during market downturns (Table 14A).
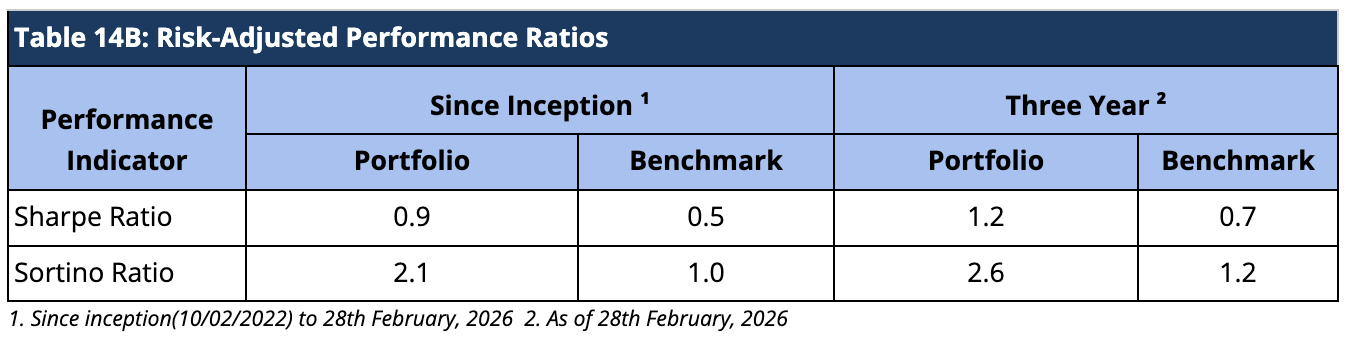
Furthermore, other risk-adjusted returns – Sharpe ratio is also significantly higher. The Sortino ratio measures the risk-adjusted return of an investment, focusing only on the downside risk. A higher Sortino ratio indicates better risk-adjusted returns, particularly concerning downside risk (Table 14B).
Performance within the AIF Universe
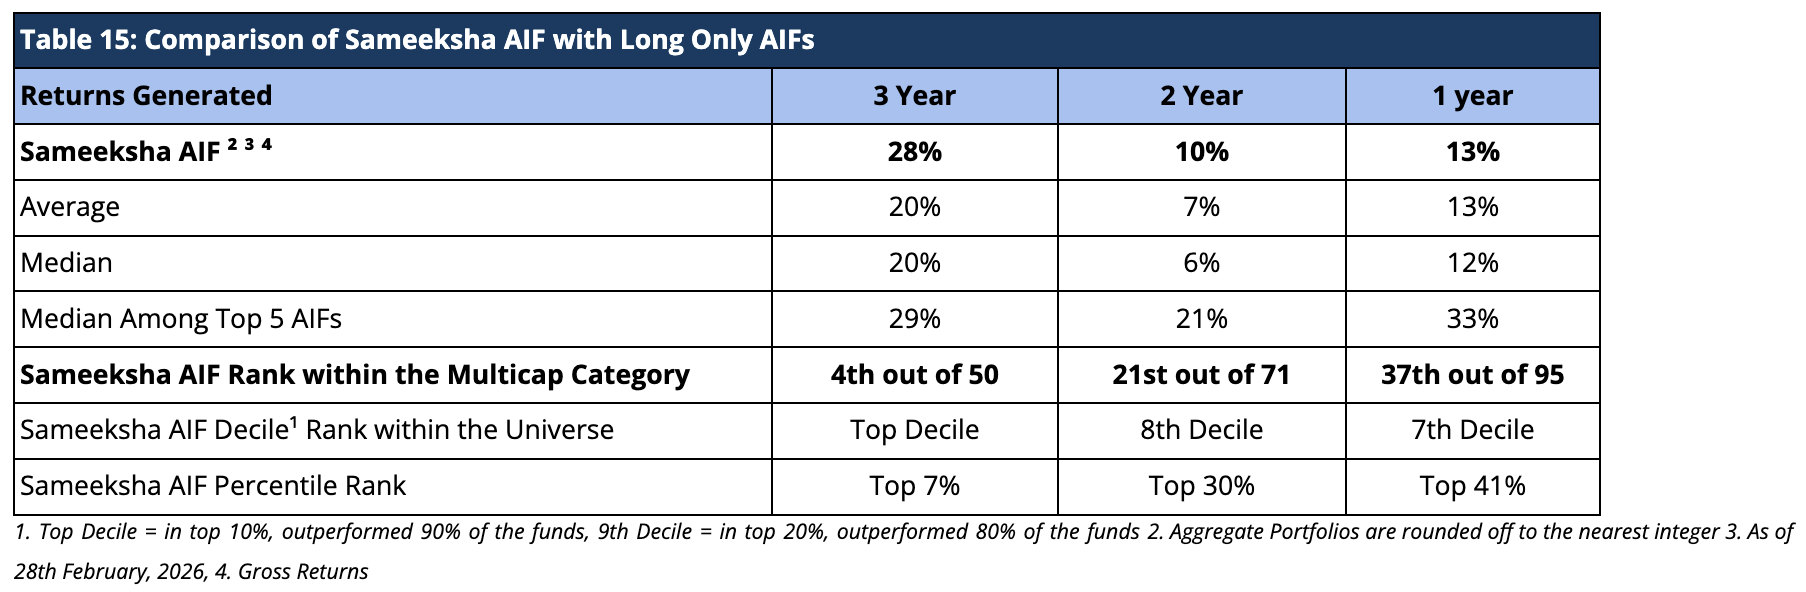
We present our rankings among Long Only Category III AIFs. For the period ending 28th February, 2026, we are ranked 4th out of 50 AIFs for the three-year period, 21st out of 71 AIFs for the two-year period, and 37th out of 95 AIFs for the one-year period (Table 15). Sameeksha has been Top Decile consistently in the last three years. Because there is a lot of divergence in the way funds report their returns (post-exp & tax; post-exp, pre-tax; gross returns, and post-exp & tax pre-perf. fees &), we are doing a comparison on gross return basis to cover the entire applicable universe of funds.
Cumulative Performance versus the benchmark
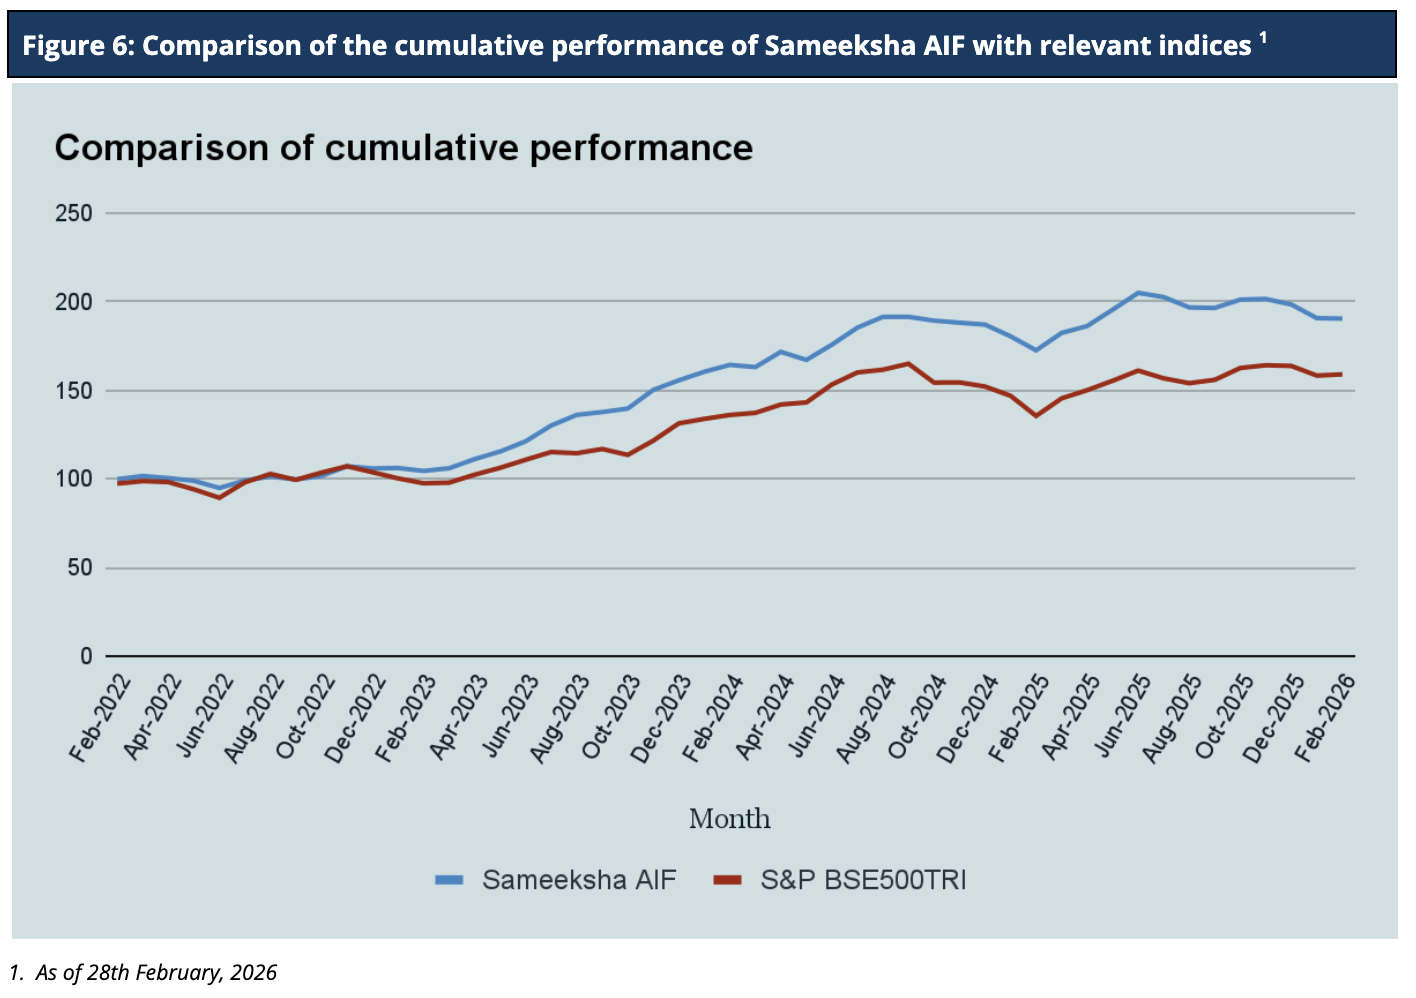
Sameeksha AIF’s outperformance over its benchmark has continued to widen positively since inception. An investment of Rs. 100 with us since inception (Feb 10, 2022) would have grown to Rs. 191, far outpacing what one would have earned by investing in a fund that achieved benchmark returns (Figure 6).
Analyzing the sector performance during the month
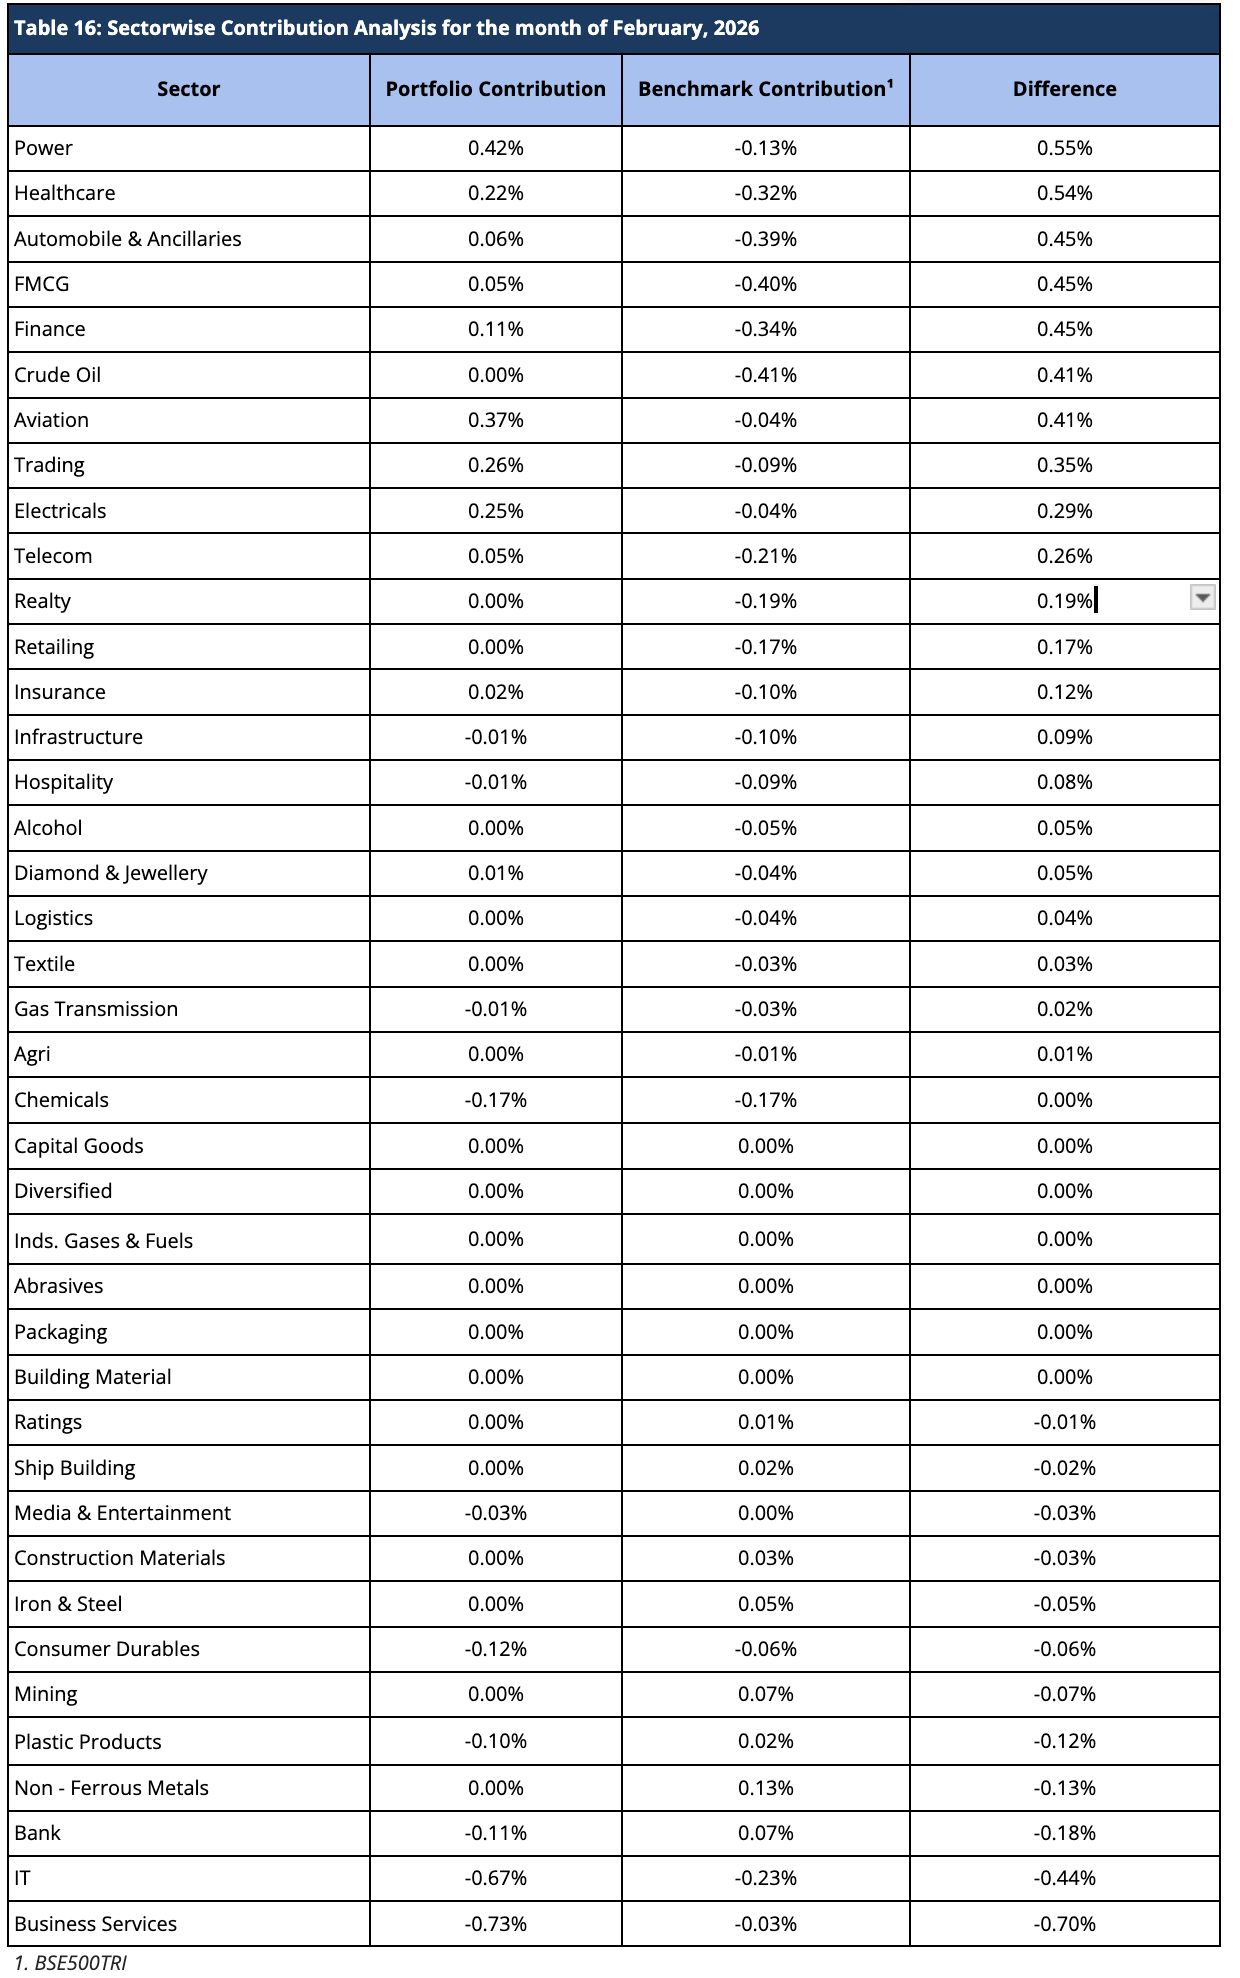
The AIF portfolio underperformed the benchmark in February 2026. The portfolio delivered strong relative performance in sectors such as Power, Healthcare, Automobile & Ancillaries, FMCG, Finance and Crude Oil, with additional support from Aviation, Trading, Electricals, Telecom, and Realty versus the benchmark. However, sectors including Business Services, IT, Bank, Non – Ferrous Metals, Plastic Products, and Mining underperformed materially relative to the benchmark. Overall, while selective sector exposures contributed positively, broad-based weakness across several key segments resulted in portfolio underperformance for the month.
Below is the contribution analysis for the month of February 2026 (Table 16).
Disclaimer – The information contained in this update is provided by our fund accounting platform and is not audited. This document is for informational purposes only and is not intended for solicitation to residents of the United States or any other jurisdiction that would subject Sameeksha Capital or its affiliates to any registration requirement within such jurisdiction or country. It does not constitute an offer to buy or sell securities or financial instruments. Recipients are advised to conduct their own research and seek professional advice before making any investment decisions.