* Period ending 31st December, 2025, ** Three-year period for PMS and AIF, also five year period for PMS, *** Rolling five-year returns of all the Multicap PMSes reporting to PMS Bazaar, **** For rolling five year periods from inception till date, ***** Five-year Period
In December 2025, the markets reflected a clear divergence between a consolidating equity market and a strong macroeconomic backdrop. After touching record levels early in the month, Indian equities largely traded in a narrow range and ended the period flat to marginally lower. Persistent foreign investor selling, driven by global portfolio rebalancing, was largely absorbed by sustained domestic institutional buying, supported by record SIP inflows, which helped anchor market levels. Metals led market performance during the month, with the sector touching all-time highs on the back of supportive policy developments and improved pricing outlook. The IT sector managed a modest recovery and ended the month higher by ~1.28%, helping stabilise broader indices. In contrast, the consumption sector lagged the market as demand indicators remained subdued and inventory overhangs persisted. On the macro front, India’s economic momentum remained robust, with speculations of Q3 FY26 GDP growth of around 7.4%, with consumer price inflation rising up to 1.33%. Overall, December was a month of consolidation as underlying economic fundamentals continued to strengthen.
In December, the benchmark S&P BSE 500 TRI fell by 0.24%. Against that, Sameeksha PMS (Portfolio Management Service = Separately Managed Accounts) was down by 1.66% (net of all fees and expenses), indicating an underperformance of 1.42%; while having cash levels of 10.9% at the start of the month and 9.2% at the end of the month. Still, December marked fifty eight consecutive months of delivering meaningful alpha on a rolling five year period basis.
Sameeksha Domestic AIF (Alternative Investment Fund = “Hedge Fund”) also continues to deliver top-notch performance, having recently completed three and half years of operating history. This AIF ranks right up at number three out of forty-four Long-Only AIFs reporting their performance to PMS Bazaar. Our AIF was down by 1.55% (post fees, expenses and taxes), indicating an underperformance of 1.31% over the benchmark.
Our weak performance in December has been impacted by developments related to our top holding. We have conducted a detailed internal assessment of the situation and have outlined our perspective and conclusions in Appendix 1.
We summarize key aspects of our performance as follows:
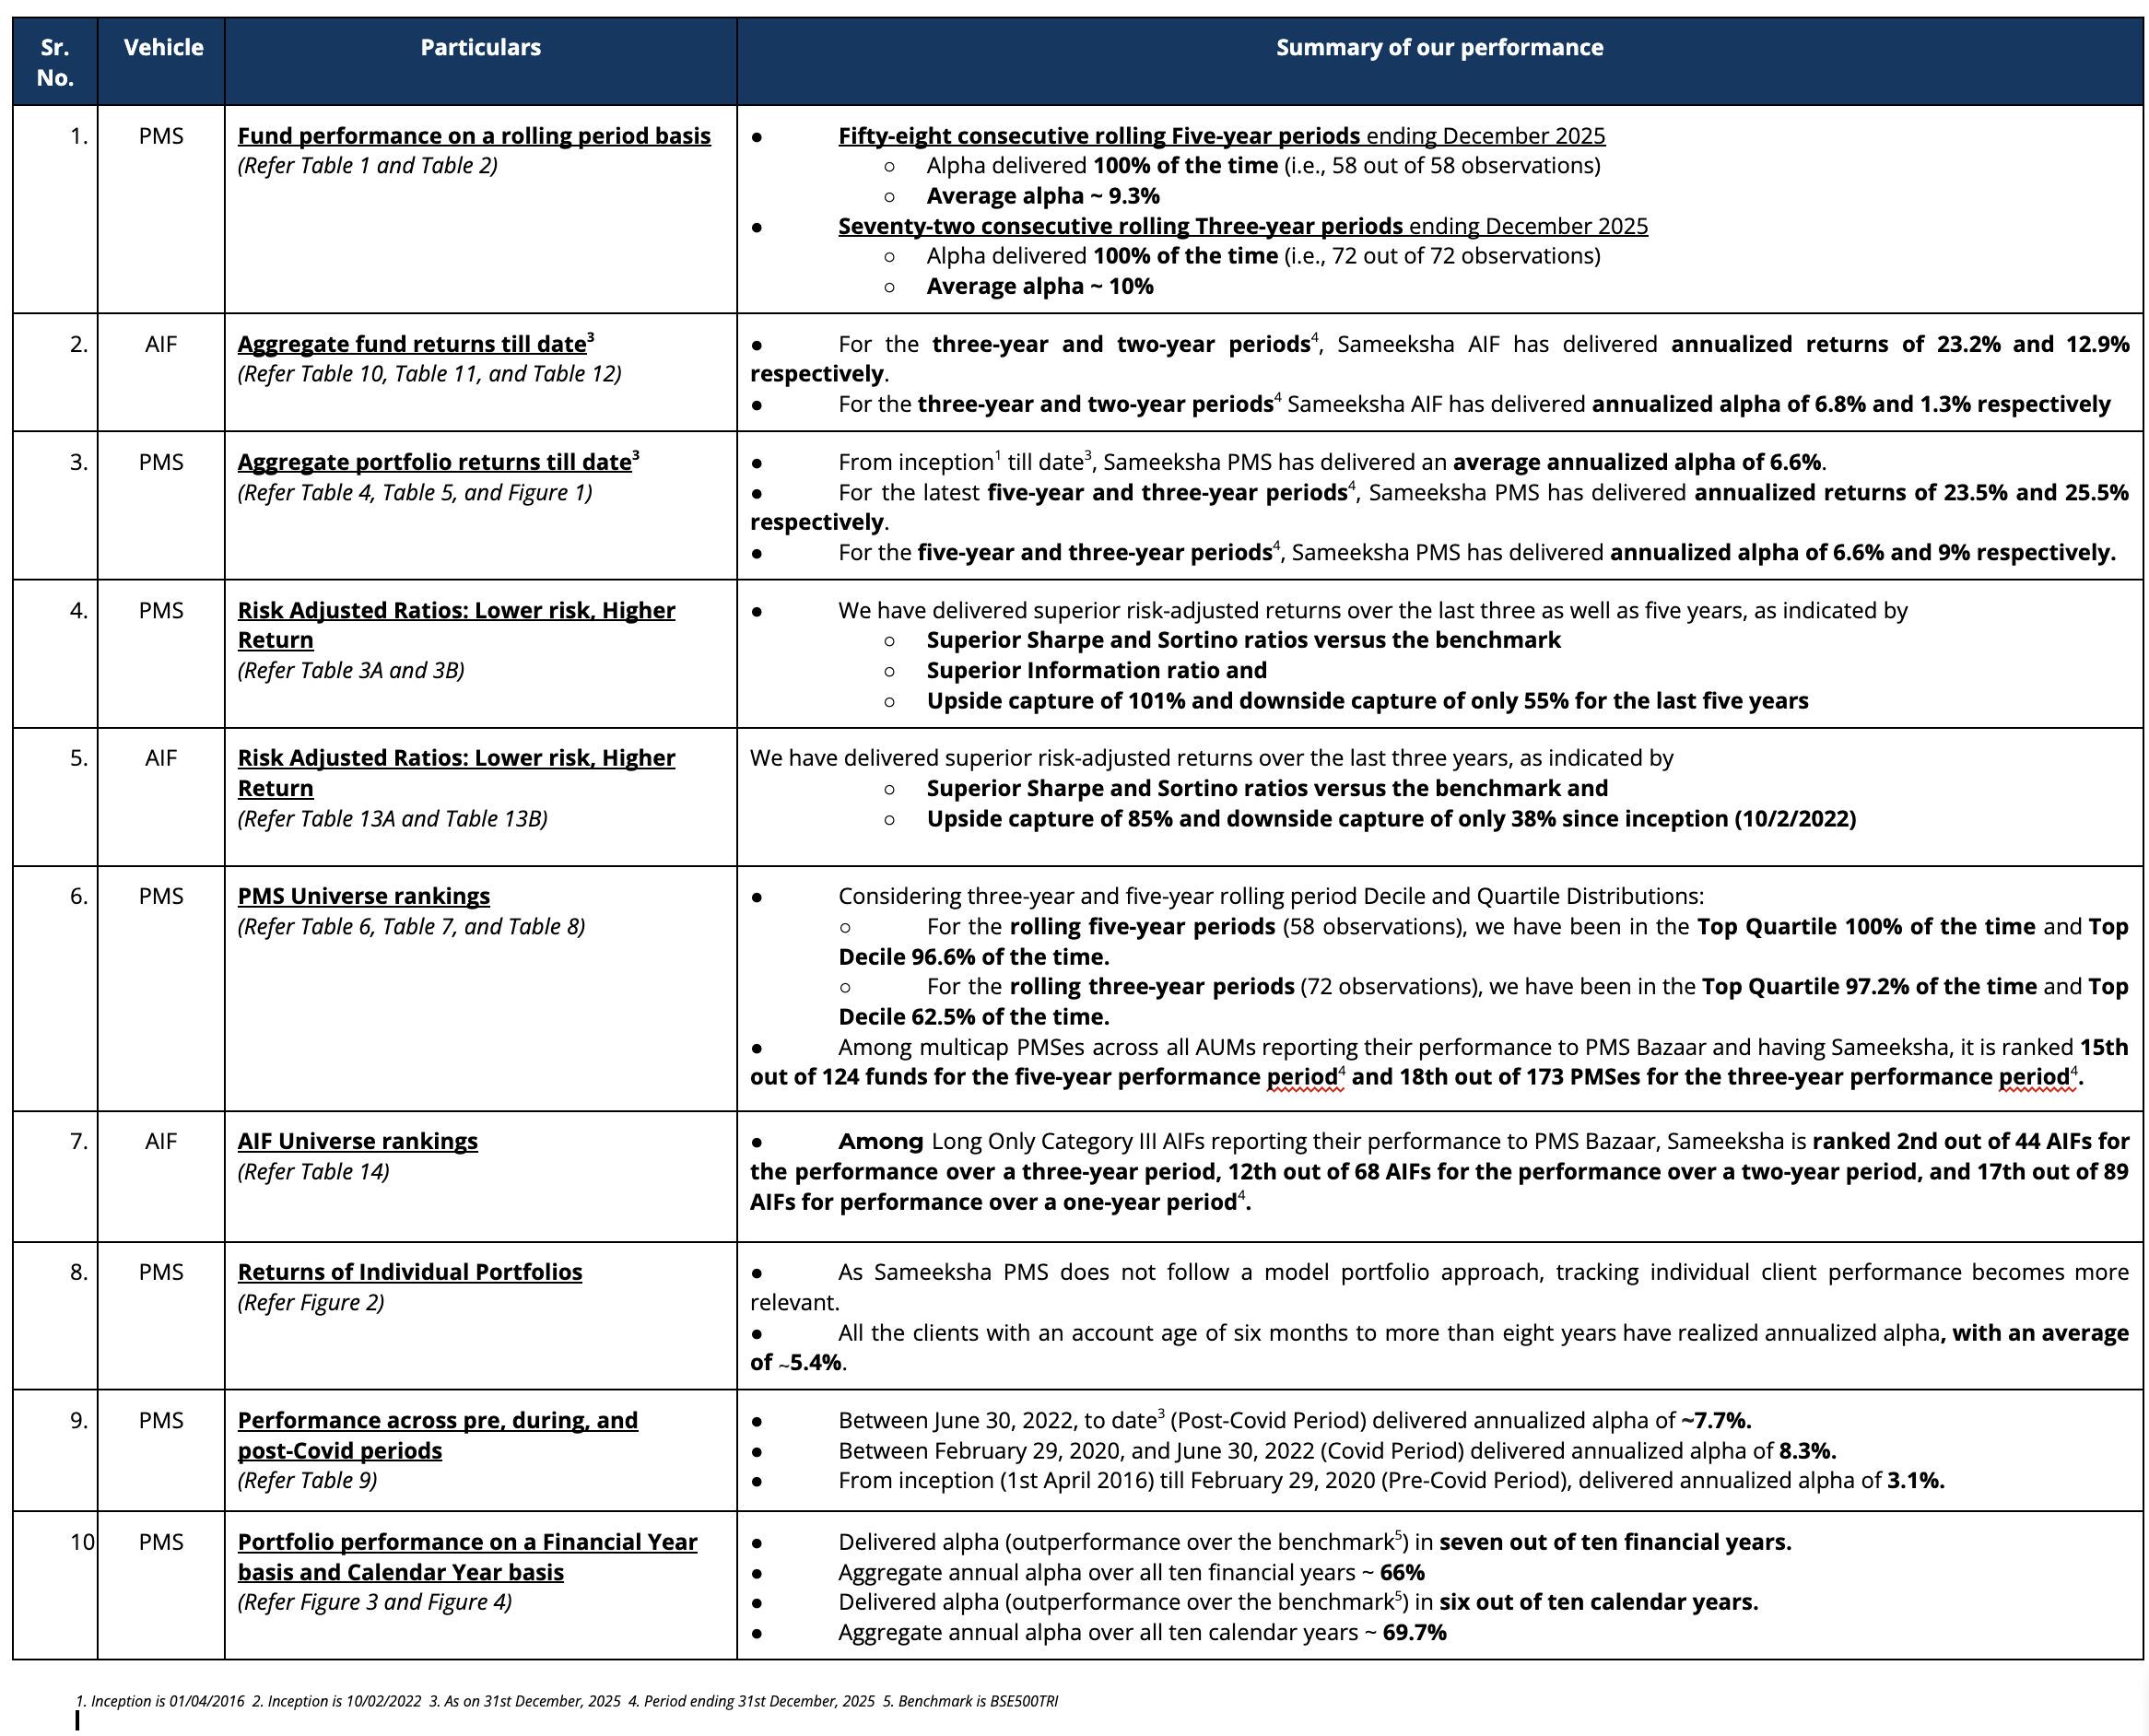
PMS Performance and other details
Three important things must always be kept in mind when looking at performance data. First, for funds such as ours that do not follow a model portfolio strategy, the performance of individual clients over different durations is important to examine. Second, some PMSes may charge fees outside the PMS, which could make their performance data non-comparable to ours after fees. Third, it is important to look at not only portfolio returns but also risk-adjusted ratios. We provide data to address all three points later in this note.
Aggregate Portfolio Performance and ranking on a rolling period basis
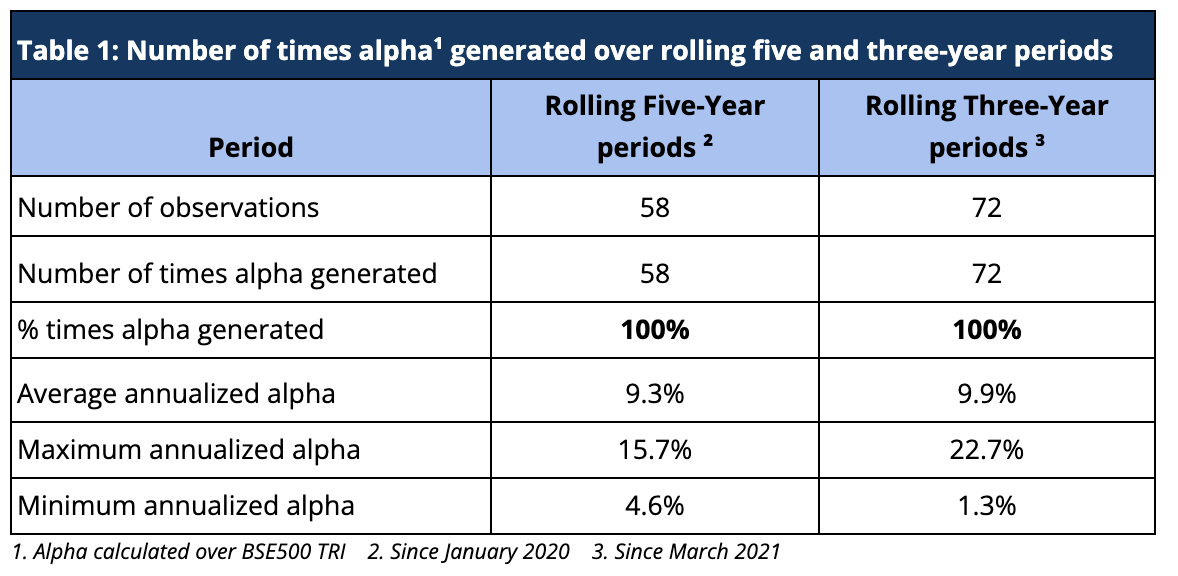
Rolling returns are a more useful indicator of consistency in performance versus single-period returns. For the rolling five-year periods applicable from March 2021 till date, Sameeksha PMS has delivered aggregate annualized alpha 100% of the time (58 out of 58 observations), ranging from ~5% to ~16%. For the rolling three-year periods applicable from January 2020 till date, Sameeksha PMS has delivered aggregate annualized alpha 100% of the time (72 out of 72 observations), ranging from ~1% to ~23% (Table 1). For both rolling five and three-year periods covered in Table 1, alpha has averaged around 9.3% and 10% respectively.
To analyze the rolling five-year and three-year returns, we did an insightful exercise, analyzing average five-year and three-year rolling returns across different time frames.
The table below (Table 2) presents Sameeksha PMS’s portfolio performance using rolling five-year and three-year returns. This method evaluates returns over overlapping periods ending on each date within a given time range. By averaging these rolling returns over different lookback periods, we gain a deeper understanding of how consistently the portfolio has delivered value over time, compared to the BSE 500 TRI benchmark.
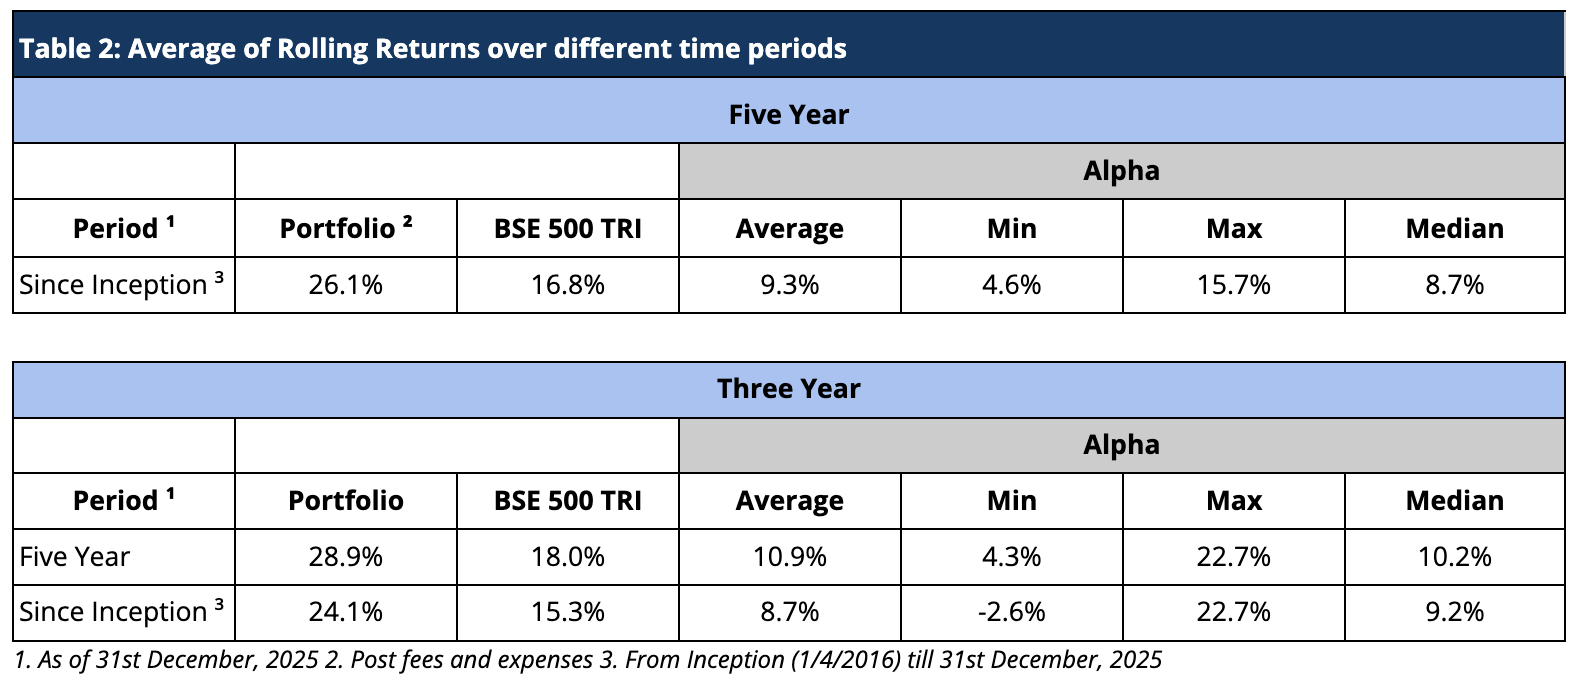
The results reveal a strong and persistent pattern of outperformance. Across all measured periods, average three-year or five-year rolling returns have consistently outpaced the benchmark. What stands out in particular is the stability of alpha across different lookback periods. This consistency suggests that the portfolio’s success is not driven by isolated bets or favorable market timing, but rather by a disciplined and repeatable process. The rolling return framework helps illustrate that this performance is not a result of temporary market positioning but instead reflects a reliable, long-term approach to investing.
Risk Adjusted Ratios: Not all returns are the same, Higher Returns at lower Risk
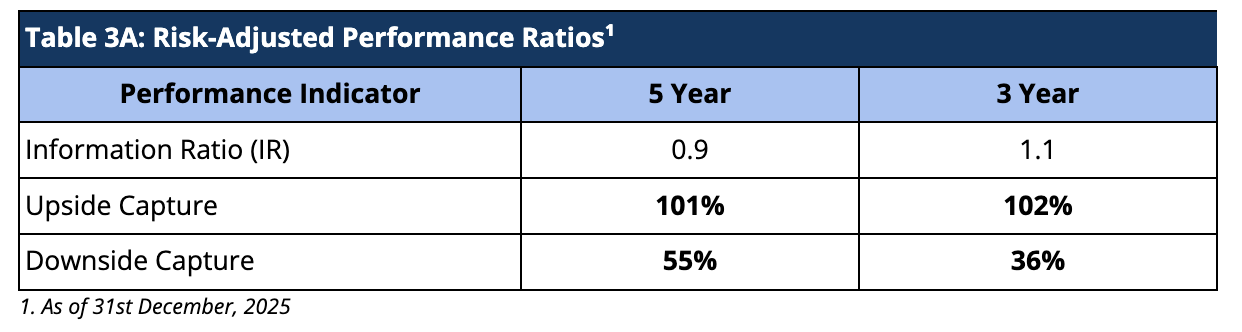
When compared on a risk-adjusted basis, our PMS has shown an even stronger performance. The Information Ratio (IR) measures the excess return of a portfolio over a benchmark per unit of active risk. A higher Information Ratio suggests better risk-adjusted performance.
Moreover, Upside Capture measures how well a fund performs as compared to a benchmark when the benchmark has positive returns. A higher upside capture ratio (>100%) indicates that the fund captures more of the benchmark’s positive movements. Whereas, Downside Capture measures how well a fund performs compared to a benchmark when the benchmark has negative returns. A lower downside capture ratio (<100%) indicates that the fund preserves capital better during market downturns (Table 3A).
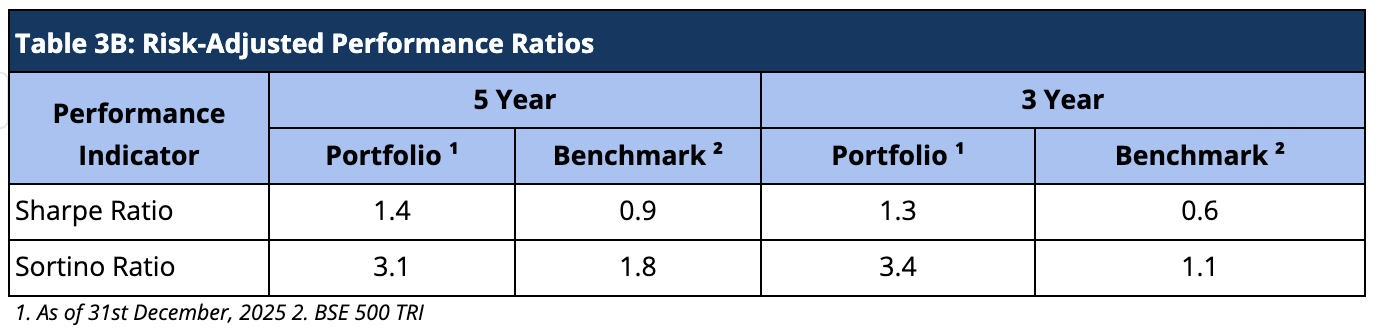
Furthermore, other risk-adjusted returns – Sharpe ratio is also significantly higher. The Sortino ratio measures the risk-adjusted return of an investment, focusing only on the downside risk. A higher Sortino ratio indicates better risk-adjusted returns, particularly concerning downside risk (Table 3B).
Aggregate Portfolio Returns over various time periods
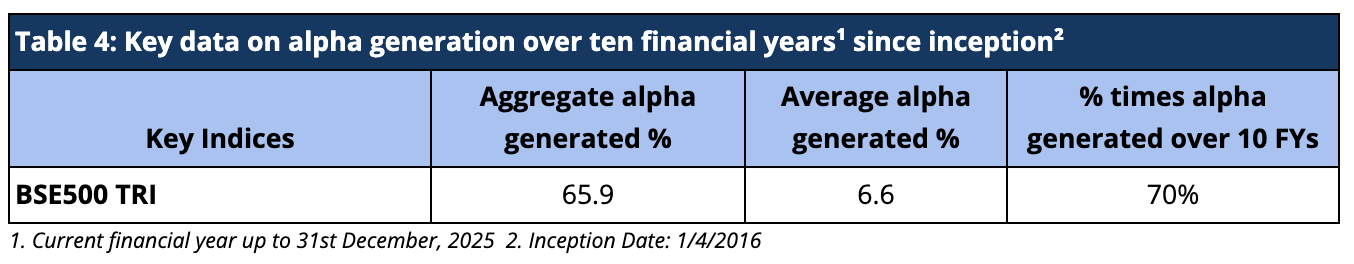
Sameeksha PMS has delivered a substantial aggregate annual alpha of 66% over BSE500 TRI over the ten financial years (including the current incomplete financial year), implying an average alpha of 6.6% since inception (Table 4).
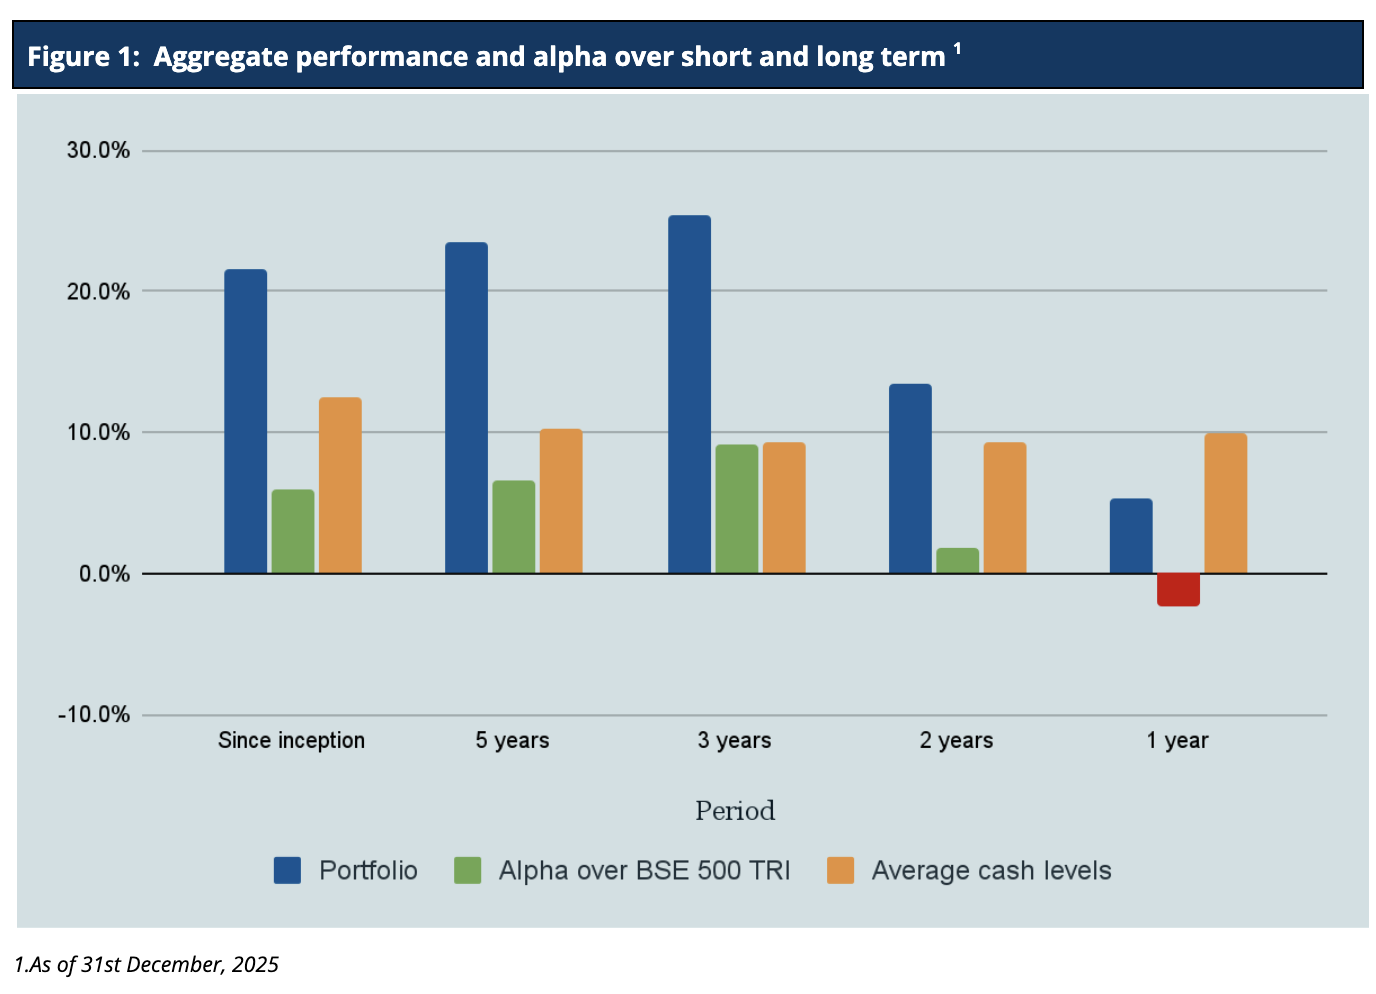
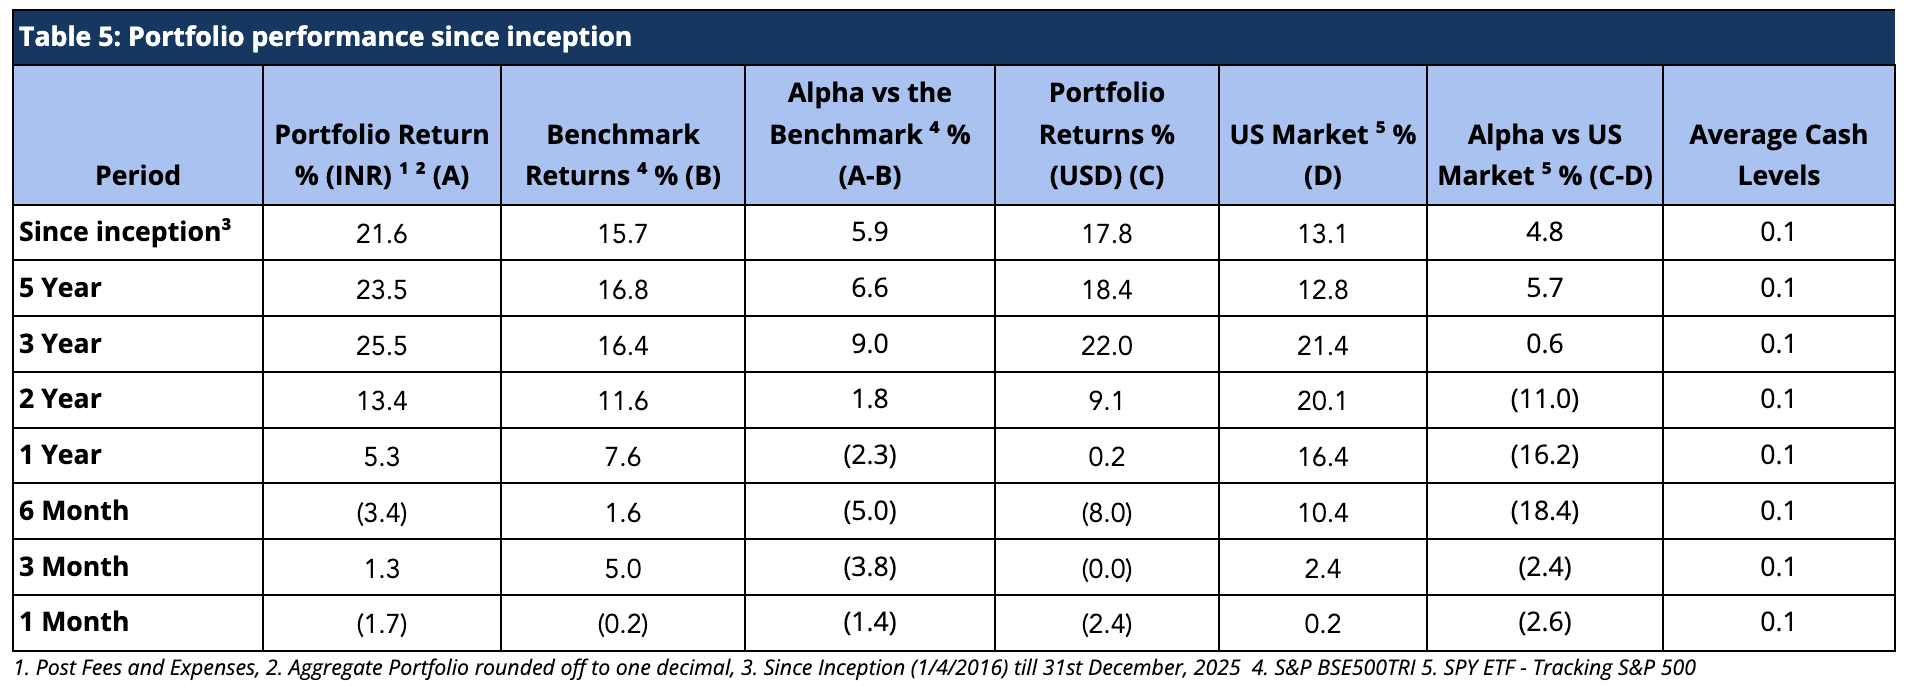
It is important to note that we have maintained relatively higher levels of cash (12.6% on average over the entire period since inception) from time to time throughout the management of the portfolio. Notwithstanding the same, from inception, over five years and three years respectively, we have generated returns of 21.6%, 23.5% and 25.5% in INR terms and 17.8%, 18.4%, and 22% in USD terms, thus generating substantial alpha over the Indian benchmark BSE500 TRI. Also, we have delivered strong returns relative to benchmark across various key time periods (Figure 1 and Table 5).
Performance within the PMS Universe
We continue to maintain our top rankings both within the multicap PMS universe as well as the entire PMS universe for key periods of three and five years. The multicap PMS universe rankings are more relevant to us since we follow the multicap strategy.
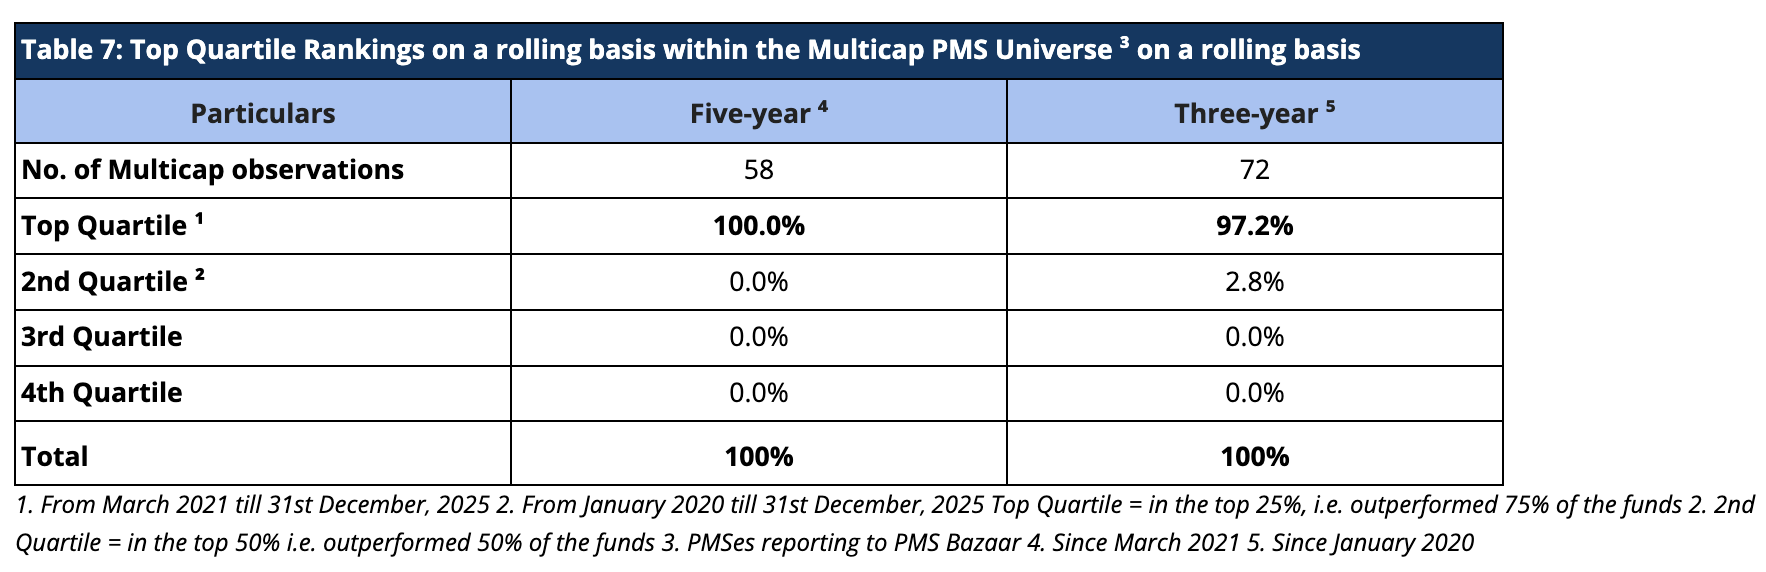
For rolling three-year periods applicable since January 2020, we have been ranked among the multicap universe in the Top Decile 62.5% of the time (45 out of 72 observations) and in the Top Quartile 97.2% of the time (70 out of 72 observations). For rolling five-year periods applicable to our entire operating history, we have been ranked among the multicap universe in the Top Quartile 100% (58 out of 58 observations) and Top Decile 96.6% of the time (56 out of 58 observations) (Tables 6 and 7).
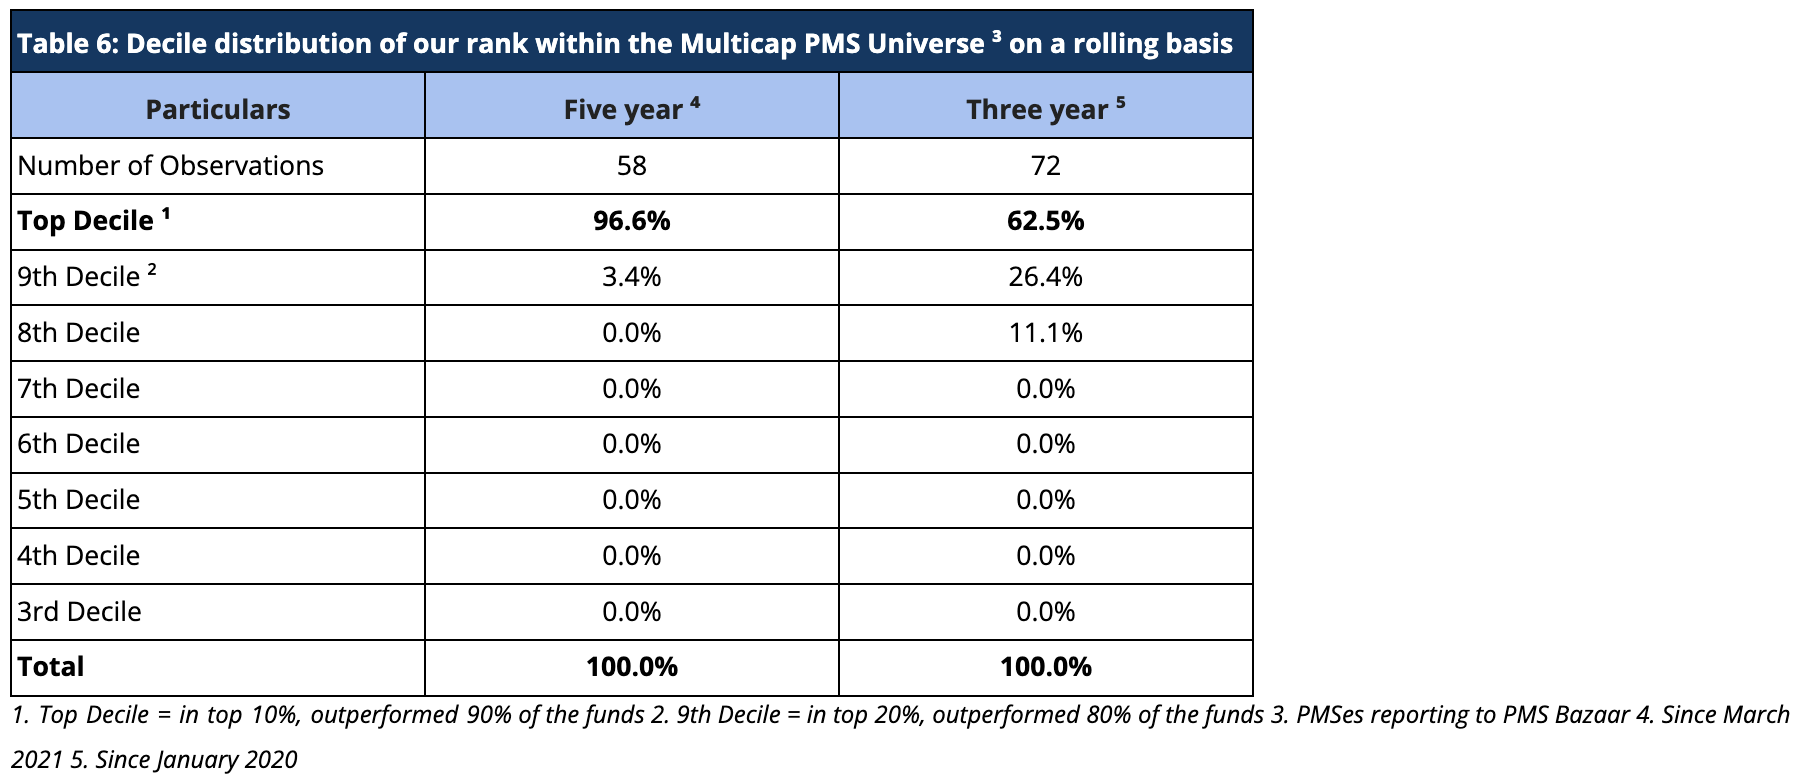
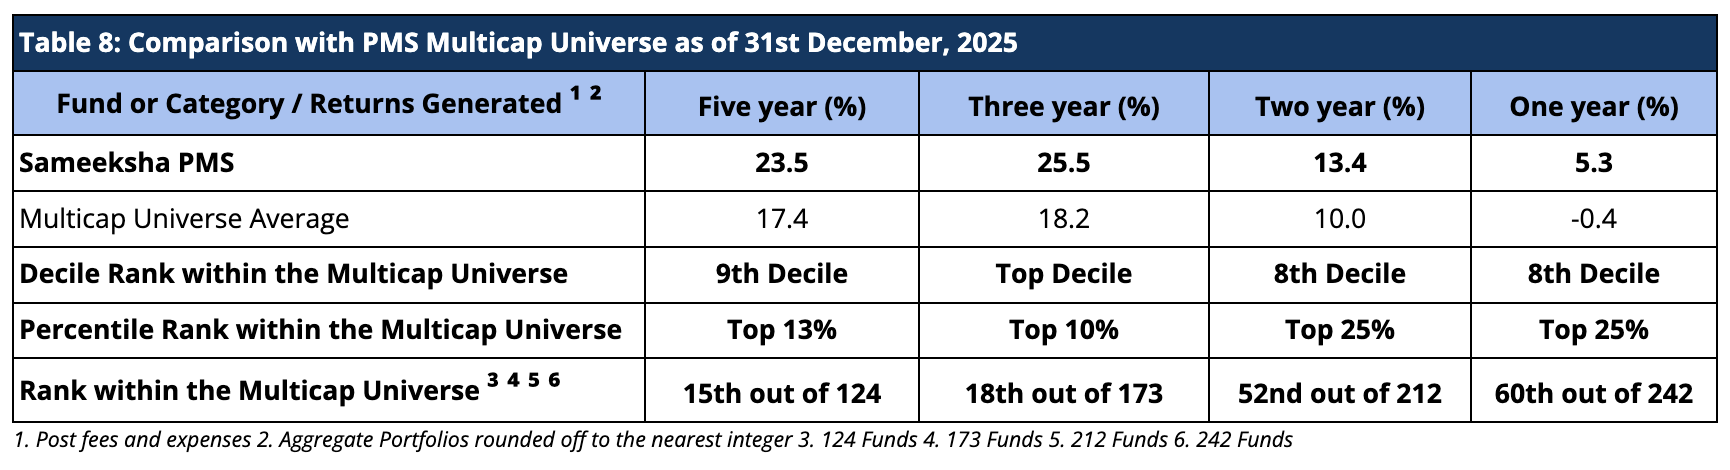
We present our rankings among the multicap PMSes across all AUM sizes. Within this universe, we are 15th out of 124 PMSes for the five year period and 18th out of 173 PMSes for three-year period, highlighting our superior performance over the long term periods (Table 8). Among the multicap universe across all AUM sizes, we are consistently ranked in the Top Decile for the five-year period for 56 out of 58 observations, reflecting well on the consistency of our performance.
Returns of Individual Portfolios
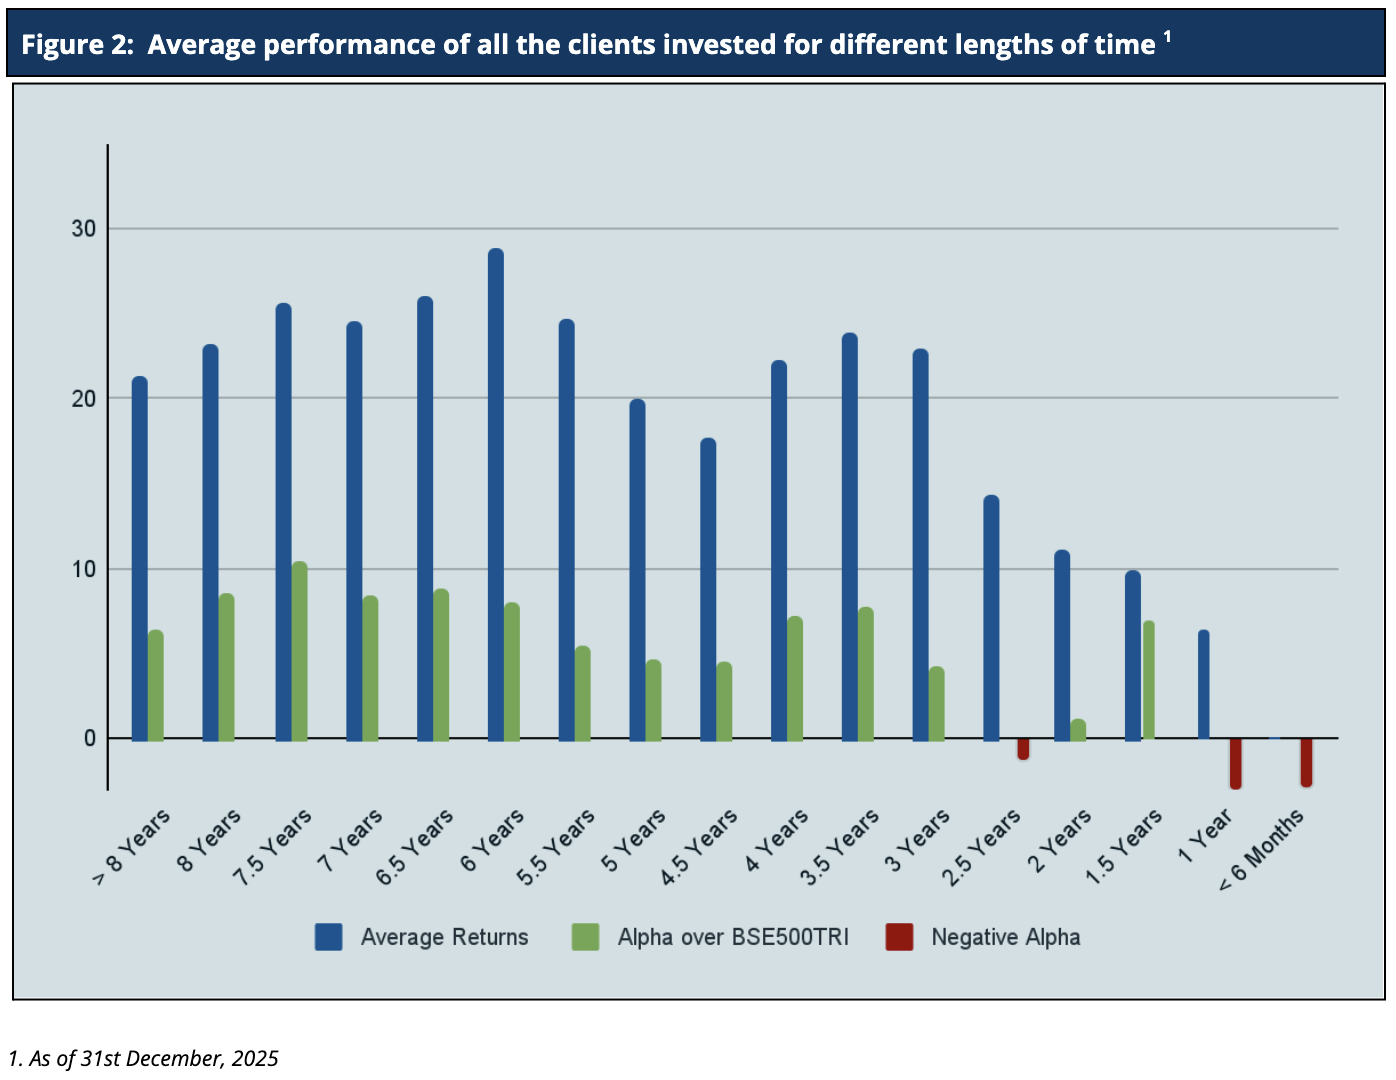
Because we don’t follow a model portfolio strategy, the performance of individual clients is far more important than overall portfolio aggregate returns (Figure 2). For investors who have been with us for five years or more, Sameeksha PMS has returned a very substantial alpha with an average annualized alpha of approx. 6.3% for the five years ending 31st December, 2025. Similarly, for investors who have been with us for three years or more, Sameeksha PMS has returned substantial alpha with an average annualized alpha of approx. 8.8% for the three years ending 31st December, 2025. The Figure below shows the average annualized returns and alpha over different periods of time of all the clients as on 31st December, 2025.
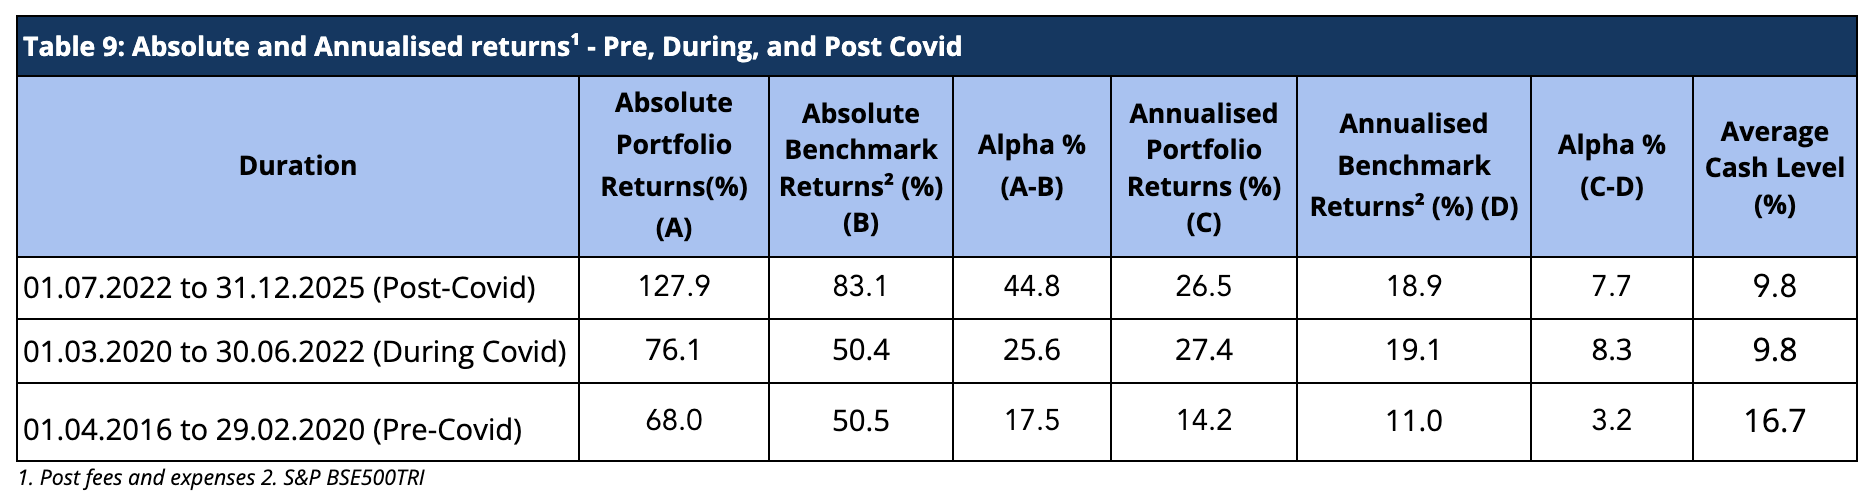
Performance Of PMS Over The Covid Timeline (Pre, During, And Post)
The COVID-19 pandemic induced significant volatility in the equity markets. Hence, it is useful to look at the performance across three time slices: Pre-COVID, During Covid, and Post-Covid. Sameeksha PMS has outperformed the benchmark across all three time periods with meaningful alpha (Table 9). This consistency of performance may be an important factor in comparing us with the other funds.
Aggregate Portfolio Performance on a financial year and calendar year basis
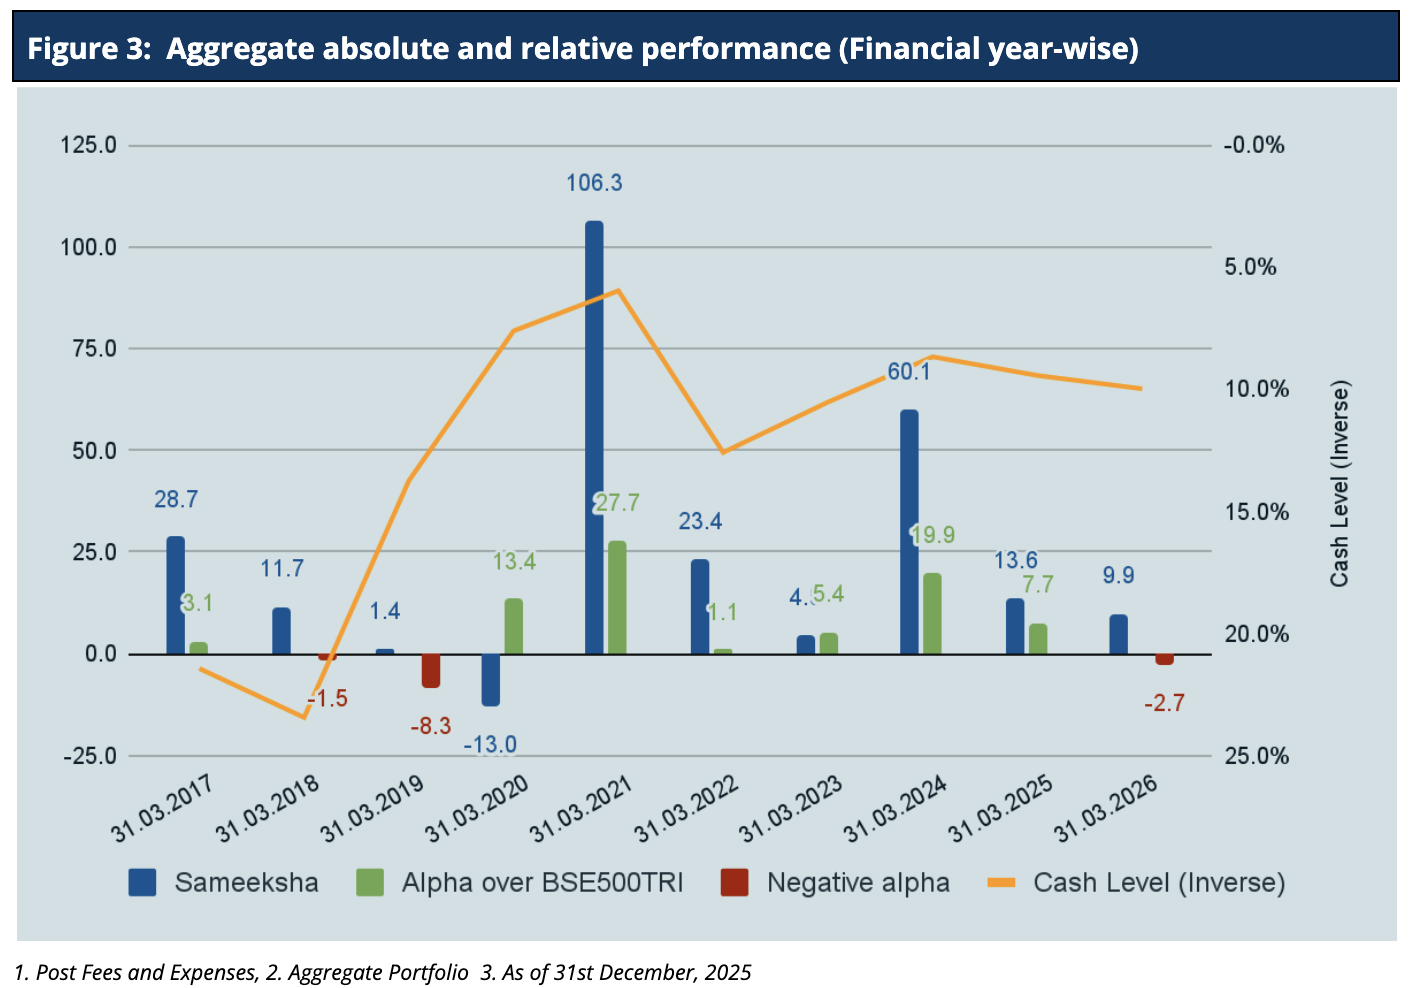
For December, Sameeksha PMS has underperformed the benchmark BSE 500 TRI by 1.4%. For Financial Year 2025-26, we have underperformed BSE500 TRI by 2.7%. Looking at our performance over the financial years (Figure 3), we have outperformed our benchmark in seven out of ten financial years. Key however, is that the sum of outperformance of 78.4% in those seven years far exceeds the sum of underperformance of 12.5% in the remaining three years.
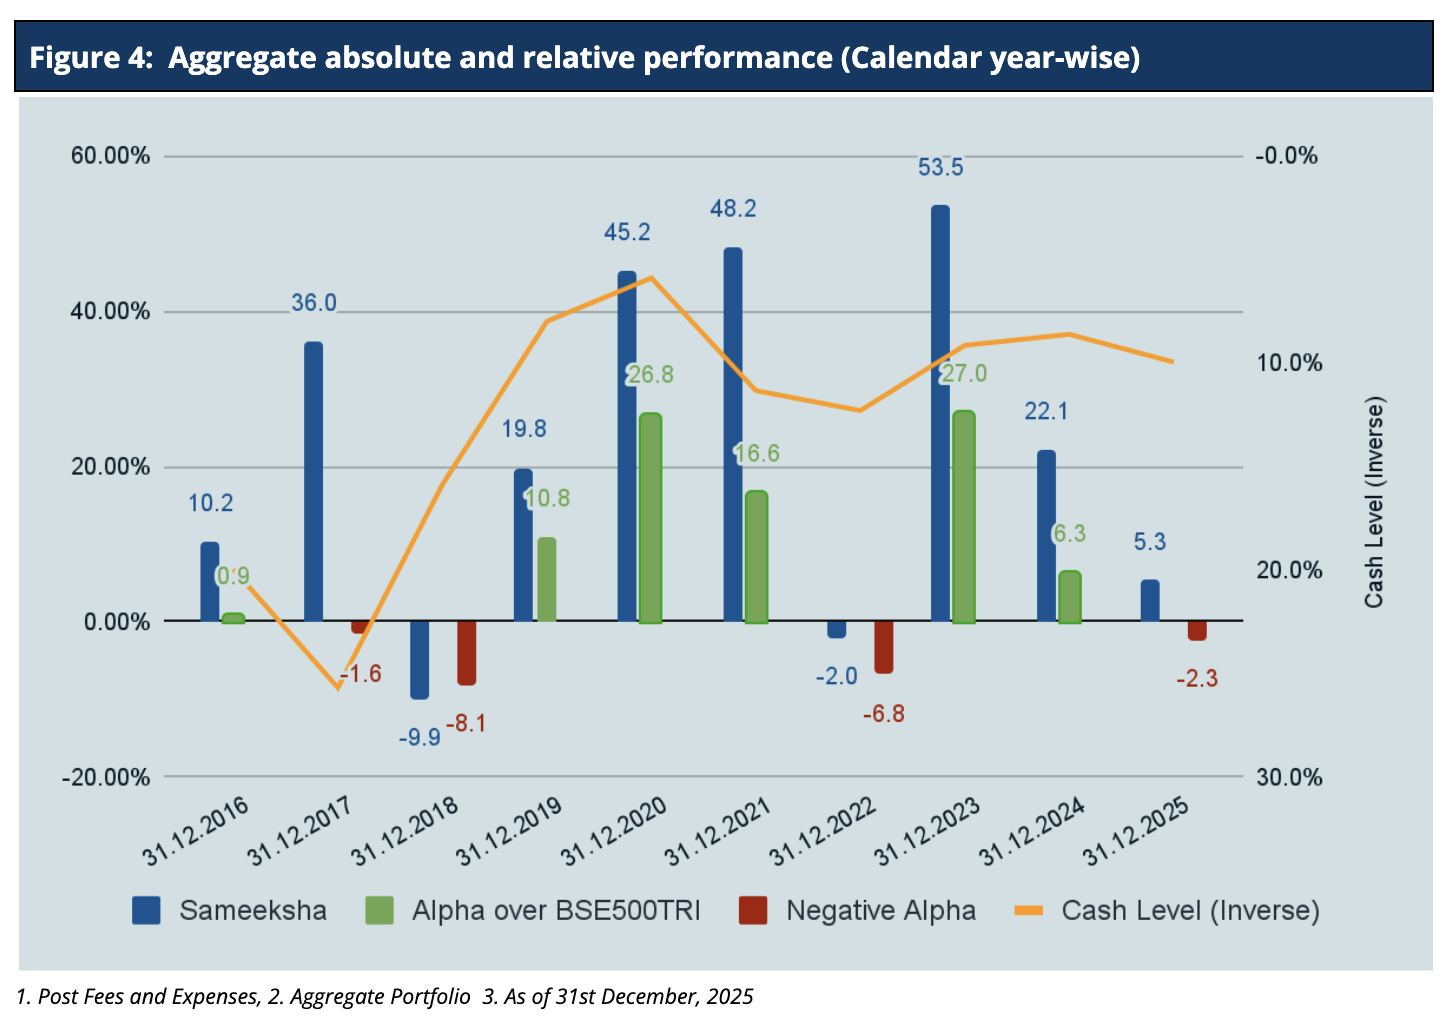
We concluded the Calendar Year 2025, with underperformance of roughly 2.3% lower than the BSE 500 TRI benchmark. Looking at our performance over calendar years (Figure 4), we have outperformed the benchmark in six out of ten calendar years, and the sum of outperformance of 88.4% in six years far exceeds the sum of underperformance of 18.8% in the remaining four years.
It is important to note that we delivered this alpha despite maintaining an average cash level of 12.6% across the ten financial years.
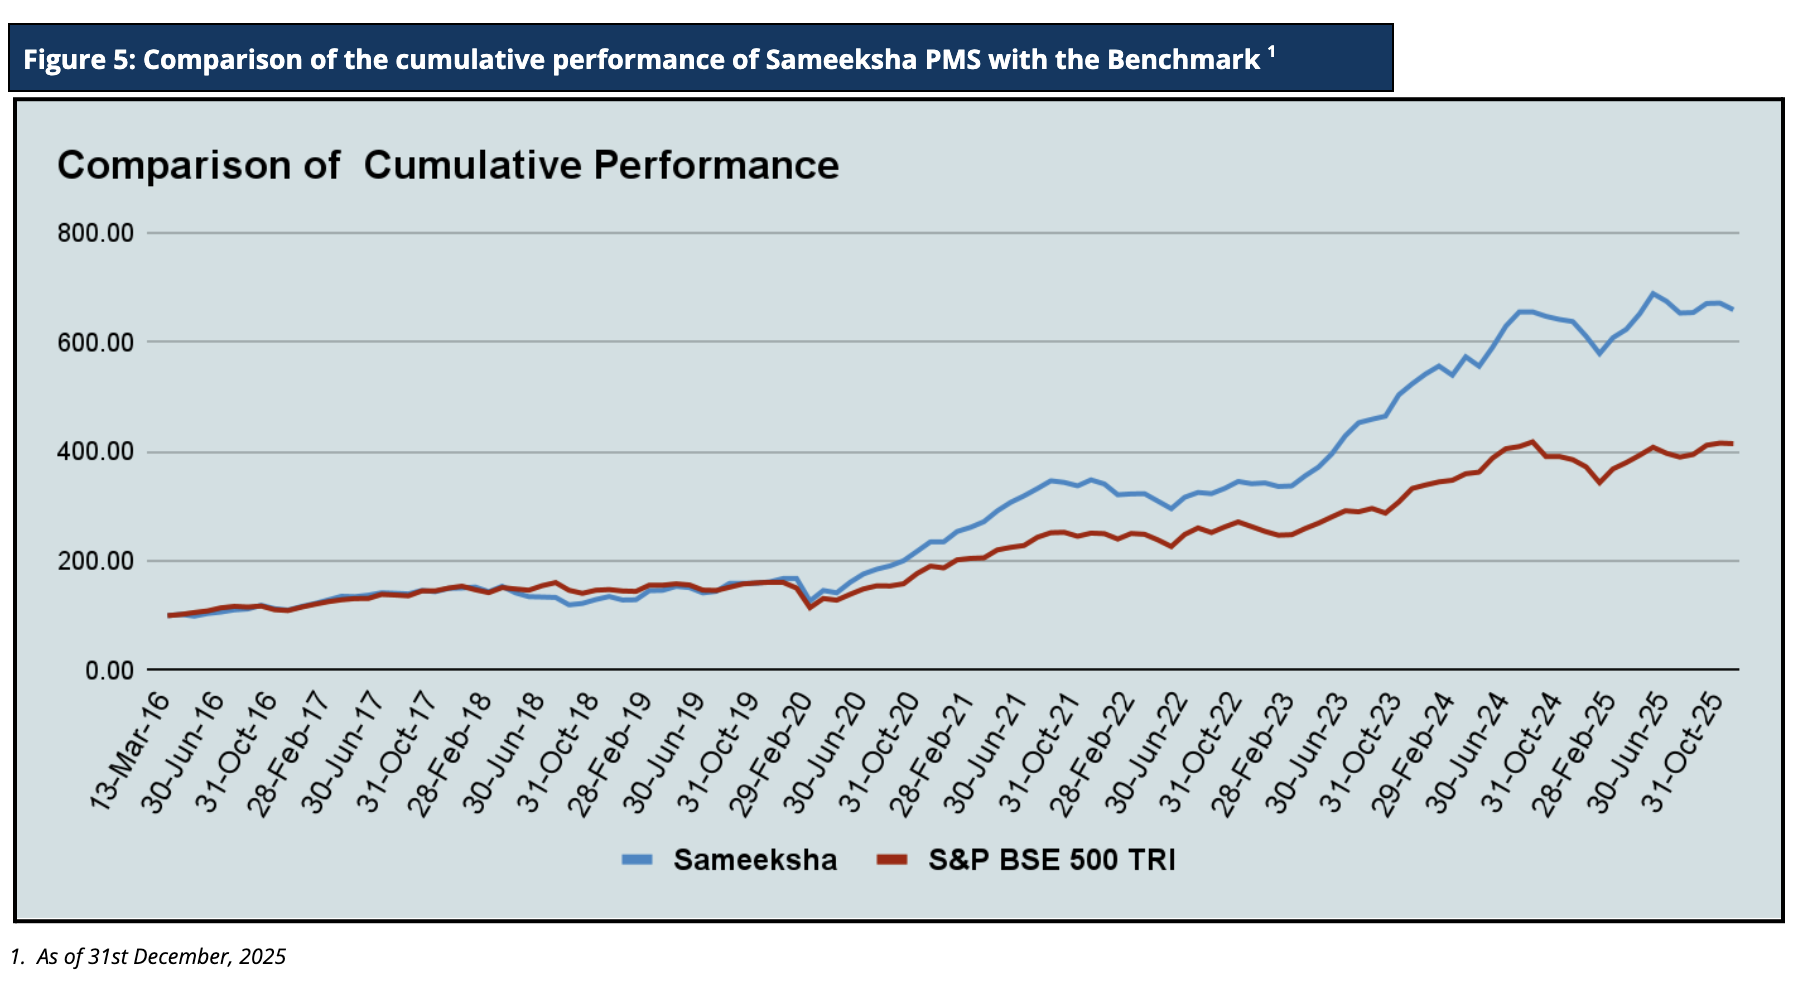
Cumulative Performance versus the benchmark
Sameeksha PMS’s outperformance over its benchmark has continued to widen positively over the years. An investment of Rs. 100 with us since inception (April 2016) would have grown to Rs. 659.6, far outpacing what one would have earned by investing in a fund that achieved benchmark returns (Figure 5).
AIF Performance and other details
Aggregate Fund Returns over various time periods
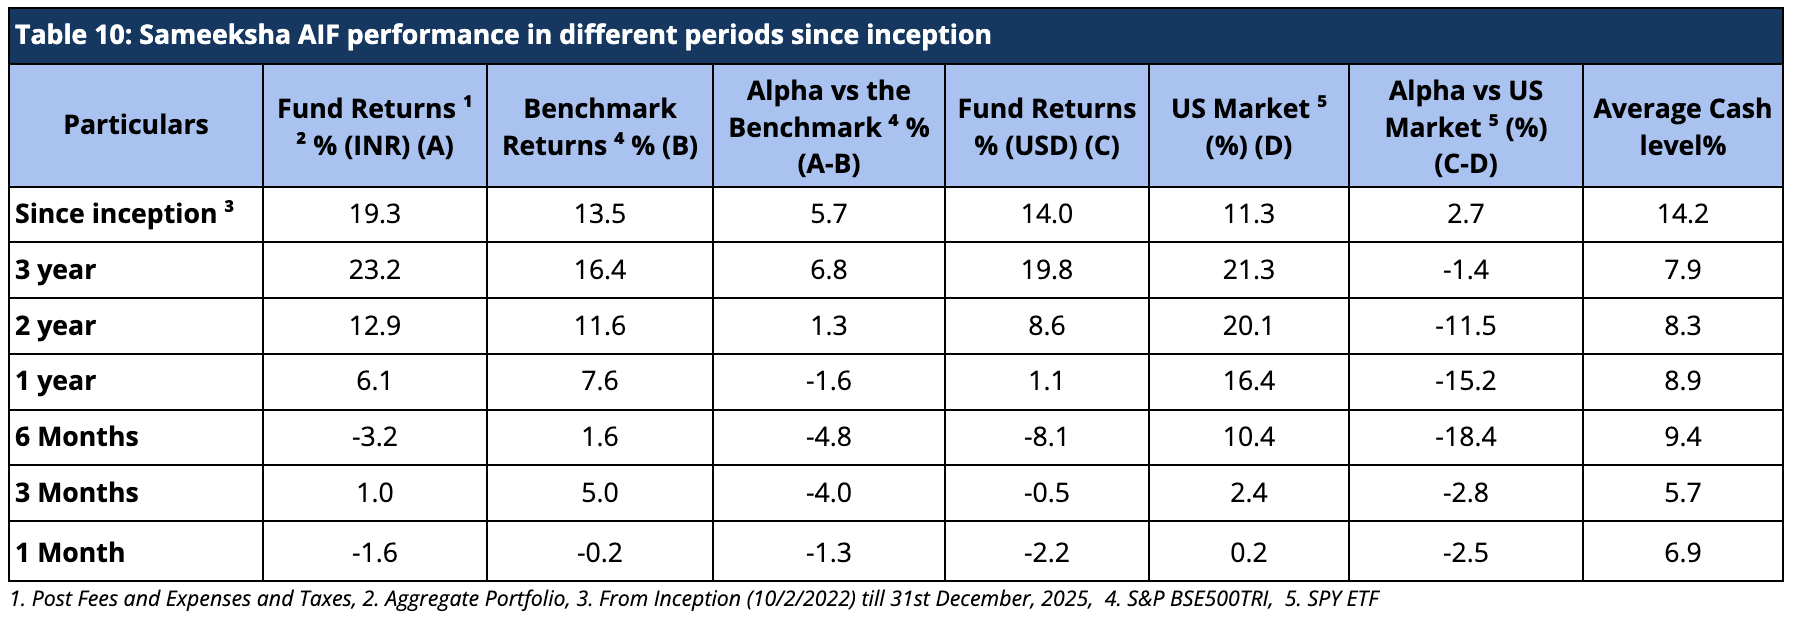
Since inception, we have maintained relatively higher levels of cash (14.2% on average over the entire period from inception) from time to time throughout the management of the fund. Notwithstanding the same, from inception, over three years and two years, we have generated returns of 19.3%, 23.2% and 12.9% in INR terms and 14%, 19.8% and 8.6% in USD terms, beating the benchmark BSE500 TRI returns and ETF tracking S&P 500 index, respectively, after fees and taxes (Table 10).
Aggregate Fund Performance on a Financial Year and Calendar Year basis
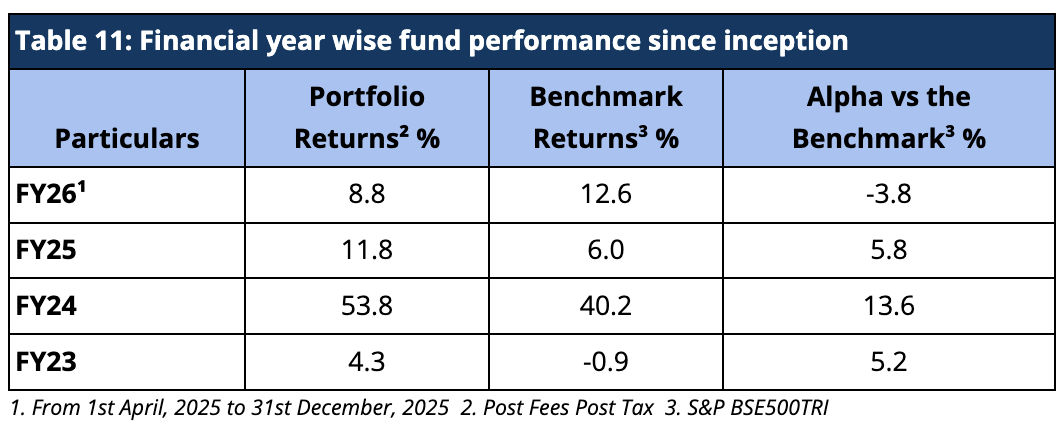
For FY26, Sameeksha AIF has underperformed the benchmark BSE 500 TRI by generating 8.8% returns against the benchmark BSE500TRI returns of 12.6%. Looking at our performance over the financial years (Table 11), we have outperformed our benchmark in FY 2023, FY 2024, and FY 2025.
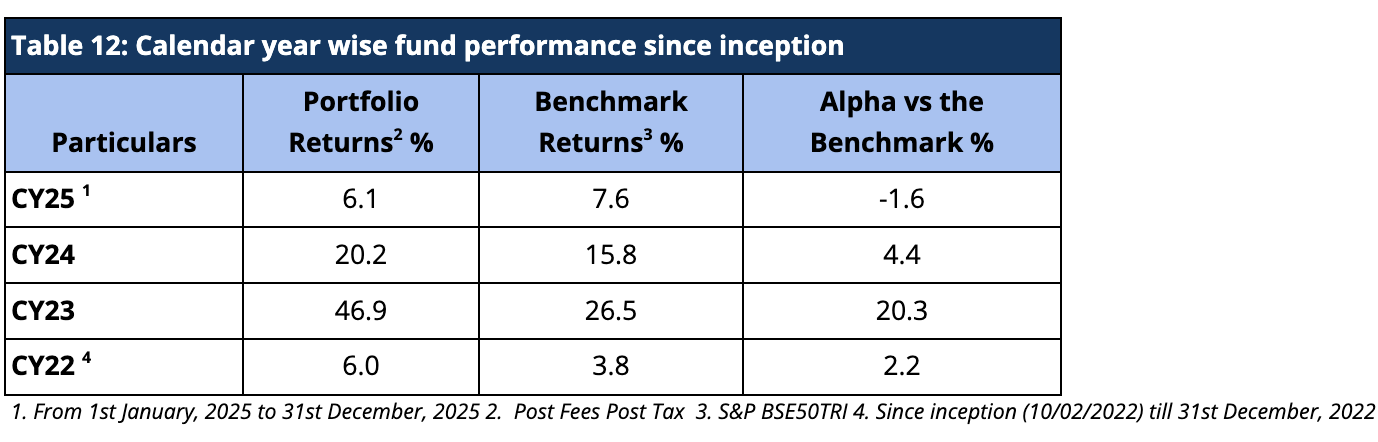
For the Calendar year 2025, we have underperformed the benchmark BSE 500 TRI by -1.6%. Despite being a new fund, we were still able to produce alpha for calendar years 2022, 2023, and 2024 and outperformed the benchmark BSE500 TRI by 2.2%, 20.3% and 4.4% respectively (Table 12).
Risk Adjusted Ratios
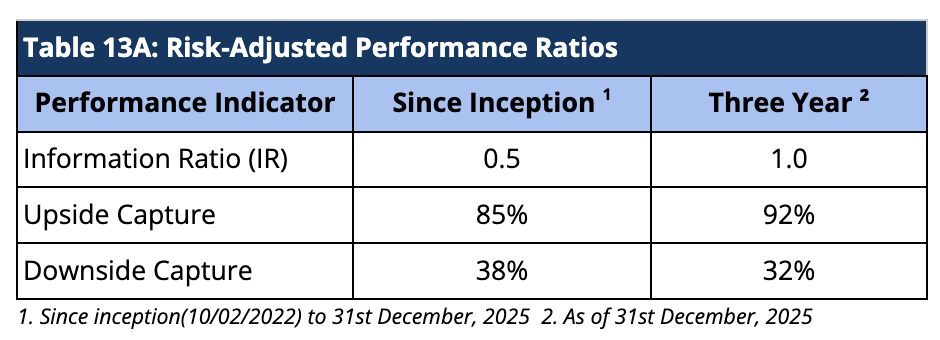
When compared on a risk-adjusted basis, our AIF has shown an even stronger performance. The Information Ratio (IR) measures the excess return of a portfolio over a benchmark per unit of active risk. A higher Information Ratio (IR) suggests better risk-adjusted performance.
Moreover, Upside Capture measures how well a fund performs as compared to a benchmark when the benchmark has positive returns. A higher upside capture ratio (> 100%) indicates that the fund captures more of the benchmark’s positive movements. Whereas, Downside Capture measures how well a fund performs compared to a benchmark when the benchmark has negative returns. A lower downside capture ratio (< 100%) indicates that the fund preserves capital better during market downturns (Table 13A).
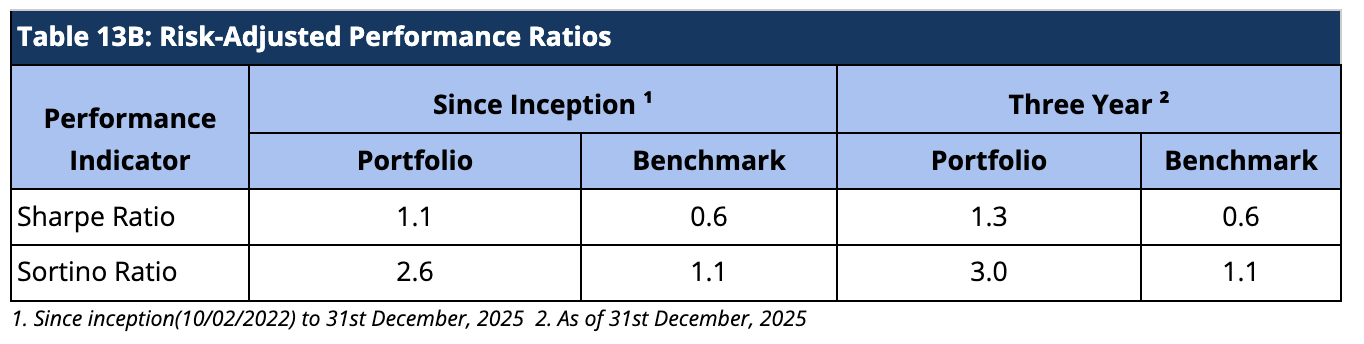
Furthermore, other risk-adjusted returns – Sharpe ratio is also significantly higher. The Sortino ratio measures the risk-adjusted return of an investment, focusing only on the downside risk. A higher Sortino ratio indicates better risk-adjusted returns, particularly concerning downside risk (Table 13B).
Performance within the AIF Universe
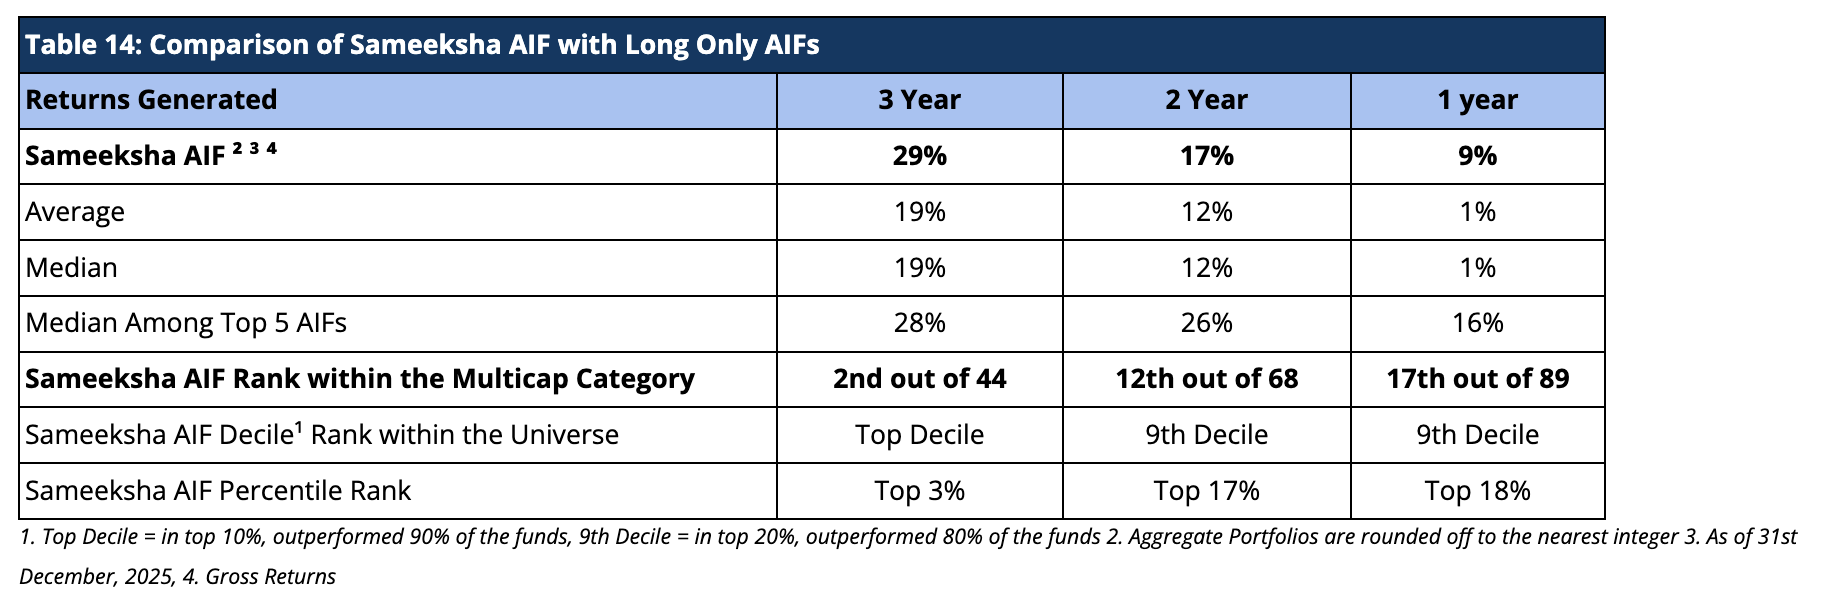
We present our rankings among Long Only Category III AIFs. For the period ending 31st December, 2025, we are ranked 2nd out of 44 AIFs for the three-year period, 12th out of 68 AIFs for the two-year period, and 17th out of 89 AIFs for the one-year period (Table 14). Sameeksha has been Top Decile consistently in the last three years. Because there is a lot of divergence in the way funds report their returns (post-exp & tax; post-exp, pre-tax; gross returns, and post-exp & tax pre-perf. fees &), we are doing a comparison on gross return basis to cover the entire applicable universe of funds.
Cumulative Performance versus the benchmark
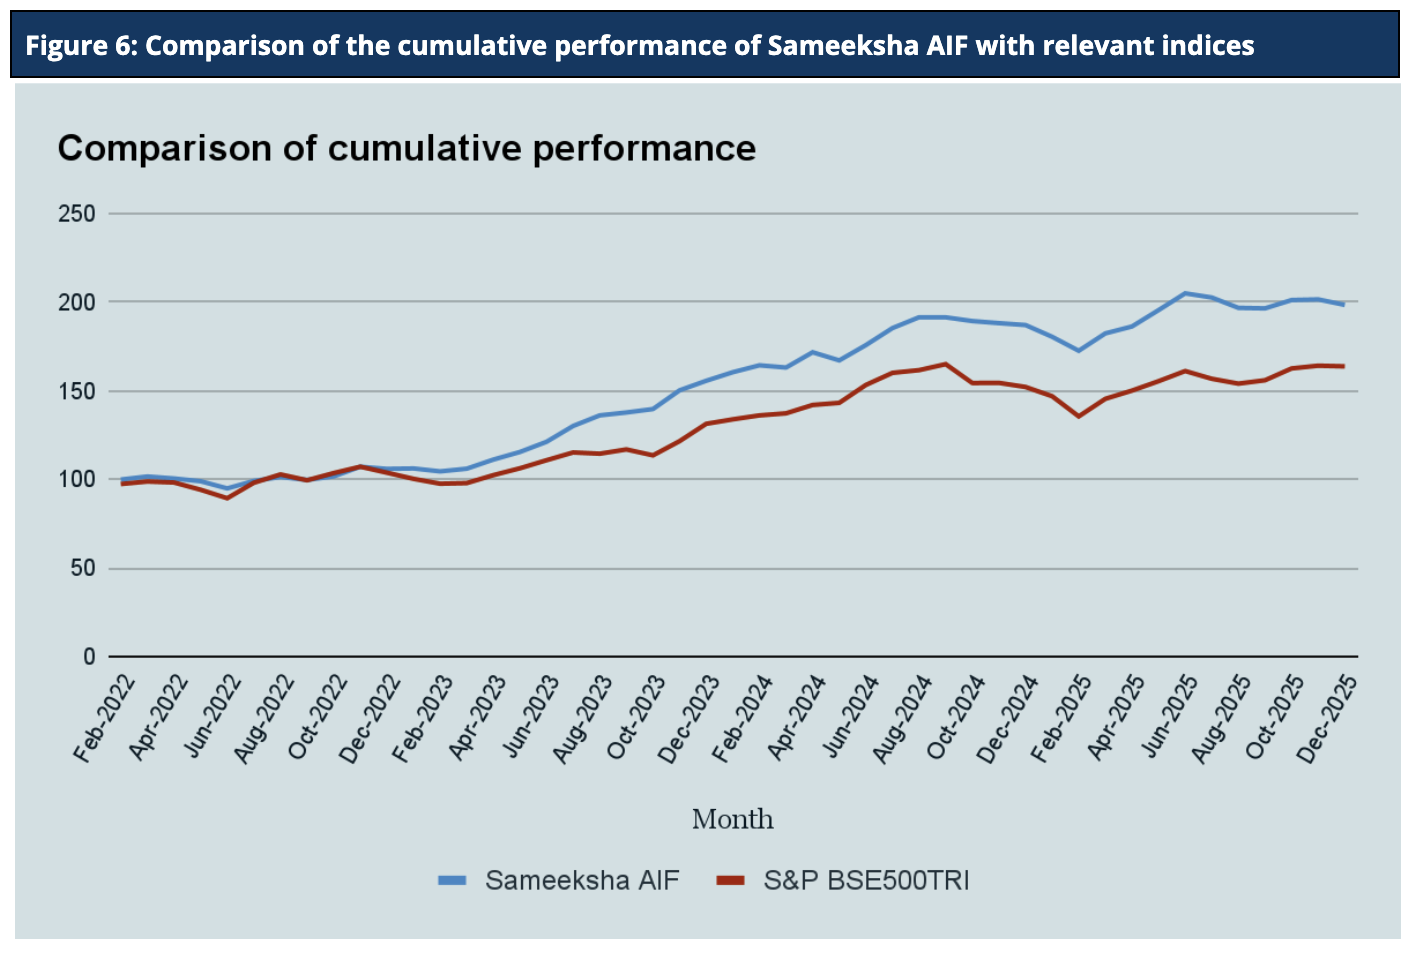
Sameeksha AIF’s outperformance over its benchmark has continued to widen positively since inception. An investment of Rs. 100 with us since inception (Feb 10, 2022) would have grown to Rs. 198.4, far outpacing what one would have earned by investing in a fund that achieved benchmark returns (Figure 6).
Appendix 1: Interglobe Aviation: facing turbulence, not a crash – an update
Interglobe Aviation Ltd (Indigo) is a top holding in the portfolio and has been a significant contributor to our past performances. In the month of December, it faced unprecedented operational crises, brought about by a confluence of factors and which led to a significant dip in the stock price. We provide below our assessment of the events and our view on the business and the stock based on these developments..
Disruptions caused by a multiple underlying factors and triggered by new FDTL rules
As a low-cost carrier, IndiGo focuses on maximizing asset utilization, particularly aircraft. Accordingly, it operates flights well into the early morning hours. The airline appears to have historically operated with an adequate—rather than excess—pilot base, consistent with a lean operating model. Following the implementation of the new FDTL rules (which, in our view, are excessively prescriptive and poorly designed), the airline was able to maintain largely normal operations in November, albeit with somewhat elevated cancellations by IndiGo’s standards. Conditions deteriorated rapidly in December as the weather worsened. Fog, smog, and poor visibility across North India led to significant delays. An aircraft that begins operations at, say, 4 a.m. from a particular city must return in time to repeat multiple flight cycles over a 24-hour period. For this to occur, pilot availability is critical, which was constrained under the new FDTL framework. An alleged pilot recruitment drive by another airline likely resulted in materially higher pilot leave, while a system-wide urgent software upgrade of aircraft further exacerbated operational challenges.
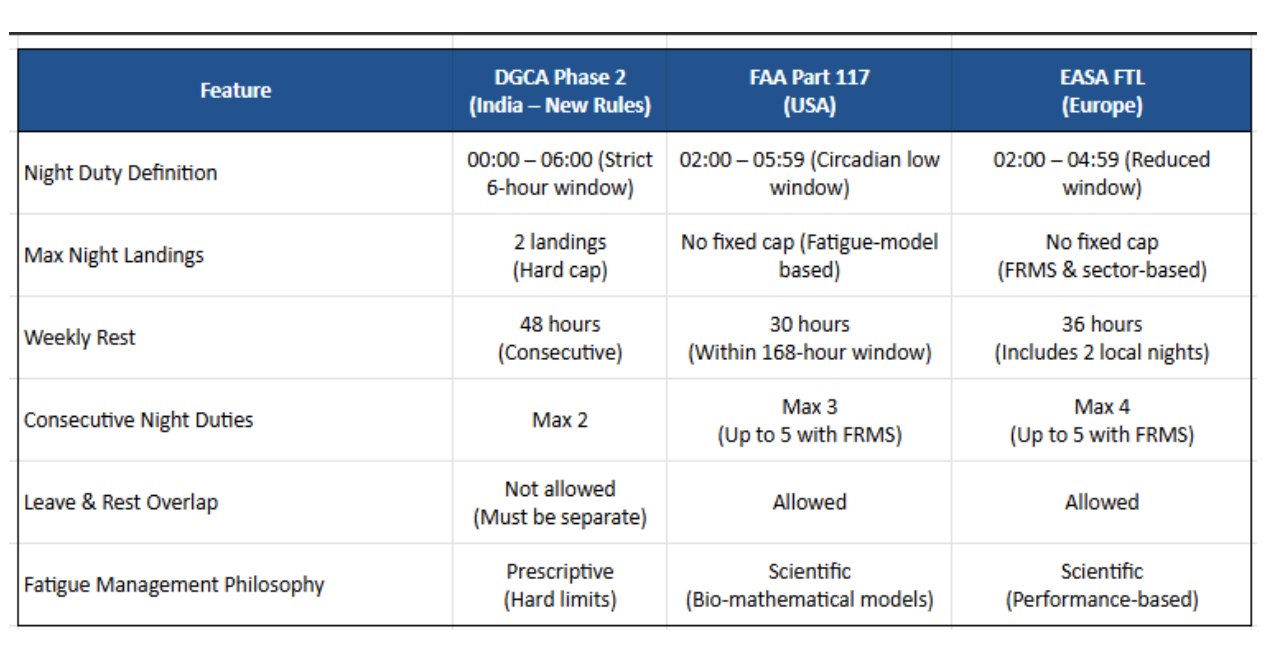
India’s FDTL night rules are significantly stricter than those in most developed countries (see table below). Previously, weather-related delays could often be mitigated through crew swaps. Under tighter rest requirements, however, reserve crews were frequently already close to their duty limits. Crew rostering systems were unable to generate viable swaps quickly enough. As a result, a 45–60 minute fog delay in the morning triggered cascading disruptions: a single delayed rotation led to multiple cancellations throughout the day, often spilling into the next. IndiGo was thus exposed to the downside of its lean operating model. Operations were not mismanaged; rather, the airline lacked sufficient crew buffers to absorb winter volatility under a materially stricter regulatory regime.
Indigo After this Disruptions:
In line with DGCA directives, IndiGo has rationalized flying on high-frequency and select monopoly routes. However, given its dominant position on approximately 50–55% of routes, the airline has retained strategically critical sectors, with adjustments largely concentrated on night operations and lower-capacity ATR deployments. The selective use of wet-leased aircraft (which comes with crew) serves as an effective transitional tool. Although higher cost, this approach helps preserve schedule reliability and traffic rights while internal capacity is recalibrated. As operational stability improves, there remains a reasonable possibility of partial slot restoration, particularly in a strong demand environment. Even in scenarios where competitors attempt to enter these markets, limited fleet scale and execution capability constrain their ability to replicate IndiGo’s frequency and network depth. Taken together, these dynamics position IndiGo to potentially emerge with improved pricing power, converting a near-term adjustment into a structurally supportive outcome over the medium term.
Management has indicated that the precise incremental hiring need will be finalized after completion of a root-cause analysis, for which external consultants have already been engaged. The company has also clarified that reports indicating a requirement of 800–900 pilots are inaccurate. From a regulatory standpoint, while the DGCA has imposed a monetary penalty of ₹22 crore, it has not taken any severe punitive action against topmost management beyond issuing warnings, suggesting regulatory confidence in the airline’s corrective actions. The episode underscores the company’s operational resilience and ability to adapt under stress. Further reinforcing operational readiness, a DGCA press release dated 20 January 2026 indicates that, as of 10 February 2026, the availability of Airbus commanders and first officers exceeds projected requirements, providing an in-built buffer as the airline transitions to full compliance with the revised FDTL norms. Accordingly, the company has reaffirmed operational stability, with no anticipated flight cancellations beyond the February 10 deadline, supported by an approved network schedule, adequate crew strength, and the withdrawal of earlier FDTL exemptions.
After reducing the capacity growth for the current year, incorporating compensation provided to affected passengers, and factoring increase in unit employee cost, our Model indicates an IRR potential of over ~16-17% to our Mar-28 Target Price and hence we continue to stay invested in the stock. We have not factored in the scope for rise in yields that is very likely given Indigo’s cost advantage and market share which drive its ability to pass on price cost increases. In our view, While the December episode has caused some financial damage to Indigo, it has come out quickly and strongly from this and none of the reasons why we have invested in Indigo are altered. The company is facing one of the best growth opportunities (rate of growth and horizon of growth) across Indian equities and has market share, business model and aircraft acquisition strategy that allows it to enjoy huge cost structure advantages over everyone else. This combination of growth prospect and cost advantage bodes well for the airline to deliver very strong growth in cash flows for a very long period.
Disclaimer – The information contained in this update is provided by our fund accounting platform and is not audited. This document is for informational purposes only and is not intended for solicitation to residents of the United States or any other jurisdiction that would subject Sameeksha Capital or its affiliates to any registration requirement within such jurisdiction or country. It does not constitute an offer to buy or sell securities or financial instruments. Recipients are advised to conduct their own research and seek professional advice before making any investment decisions.