1.Global Strategic Situation
The global strategic situation has changed dramatically in recent years with the rise of China as both an economic and military power, and the worsening relationship between Russia and the West. China appears to seek domination in the Indo-Pacific region which stretches between the Middle-East to the Far East. It has militarized many uninhabited and disputed islands in the South China Sea without encountering much resistance either from the ASEAN countries who contest economic and territorial rights across the South China Sea, or from the dominant global superpower, the United States. China maintains its right to establish sovereignty of Taiwan through military force and has territorial disputes with Japan. It has built up its infrastructure and military power across the mountainous border with India, a move that has also resulted in a few bloody skirmishes. India is part of the Quad, an alliance with the United States, Japan and Australia, whose principle goal is to maintain a rules based order across the Indo-Pacific region. The Quad’s unstated goal is to counter China’s aggressive behavior in the region and in this we expect India to play a critical part, being the only country with a population on par with China and an economy whose growth has rivaled China over the last decade. We expect the political rivalry between the West and China as well as the experiences during Covid Pandemic to be an indirect benefit to India as companies seek to reduce their dependence on a strategic rival.
Some market watchers have done studies to show that during and after the world wars, equity markets of countries that took a neutral stance did the best. Current stance of India in context of Russia’s invasion of Ukraine can be best described as neutral.
II. China Plus One posing a great opportunity for India Inc.
There was a change in the outlook towards China during Trump’s presidency when he introduced a duty structure that made it prohibitive for Chinese products to come to the U.S. That was the beginning for a lot of investors and global companies to look for alternative sourcing bases. In addition, China’s zero-covid policy, supply chain disruptions, high freight rates, and increasing lead times resulted in the “China Plus One” strategy for many global companies. Because of this, many MNCs are looking at Asian countries like India, Vietnam, Bangladesh, and Malaysia. A survey by UBS suggests that approximately 20-30% of manufacturing will be leaving China. India is likely to be the next best candidate to benefit from this altered situation owing to its competitive advantage in various industries, favorable factors of production, conducive business environment, and incentivising government policies. The government also clenched on the situation and took further steps in the same direction by introducing PLI schemes for multiple sectors (Refer point VII of this section for discussion on PLI). The global macro tailwinds in some sectors along with prudent government reforms are expected to put India on a growth trajectory path in a sustainable manner. Following are some of the sectors that may benefit from the strategy –
| Sectors | Macro Tailwinds | Advantage for India |
| Textile | Ban on Xinjiang Cotton by the US (80% of China’s cotton originates from Xinjiang)Decentralization and consolidation trends – decreasing market share of China | Second largest employing sector after agriculture Contributes 5% to India’s GDP and 12% of country’s export earnings Abundance of raw materialIndian textile industry is expected to grow at ~ 9-10% CAGR over the next 5 years which is much higher than the global growth rate |
| Chemicals | Stricter implementation of pollution control measures that impacted China’s cost advantage Host of regulatory changes including introduction of environmental protection tax Relocation of toxic manufacturing plants to dedicated industrial parks, along with higher operational and capital costs, have hit the operations of Chinese chemical companies, resulting in large supply-chain disruptions in the industry. | Beyond the labor cost advantages, a large pool of technically qualified manpower, strict adherence to global manufacturing standards and strong protection of intellectual property (IP) rights have led to rapid scaling up of the chemical industry in IndiaOver the last 7 yrs (from FY15 to FY22) the Revenue and PAT CAGR for top 10 Indian chemical companies in the listed space has been 16% and 28% respectively, increasing India’s share in the global specialty chemicals market from 3% to 4%, according to the Crisil report. |
| Pharmaceuticals | In 2017, the supply chain in China was disrupted due to China’s environmental crackdown, and due to implementation of pollution controls, the cost of manufacturing increasedAs part of the Blue sky policy, thousands of industrial parks and chemical companies were closed either temporarily or permanently – this resulted in the steep price hike and shortage of raw materials and APIs for the global pharma industry | India has the highest number of US Food and Drug Administration (FDA) approved facilities outside the USThe country also has skilled manpower and advanced process chemistry skillsThe domestic API manufacturers have already witnessed increased enquiries from worldwide innovatorsThe Government has also introduced PLIs for Active Pharmaceutical Ingredients (API) and Key Starting Materials (KSM) which will provide the required impetus to the domestic industry to invest in new facilities and compete with China |
III. Increasing financialization and formalization of the economy:
Introduction of GST leading to formalization of the economy: Since the introduction of GST, the number of indirect tax payers has nearly tripled. Based on the latest data available for April 2022, there were 13.65 million tax payers registered with GST of which 4.98 million taxpayers migrated from the older system while 8.67 million new tax payers were registered. The proportion of tax contributed by the new tax payers has increased gradually from 4% of total to 18.5% in the last 3 months. This has not only aided the government’s efforts to widen the tax base, but from our perspective, it has leveled the playing field for organized companies which were initially tax compliant. Furthermore, as more companies enter the organized space, investment opportunities for an investor in the listed equity space also expands.
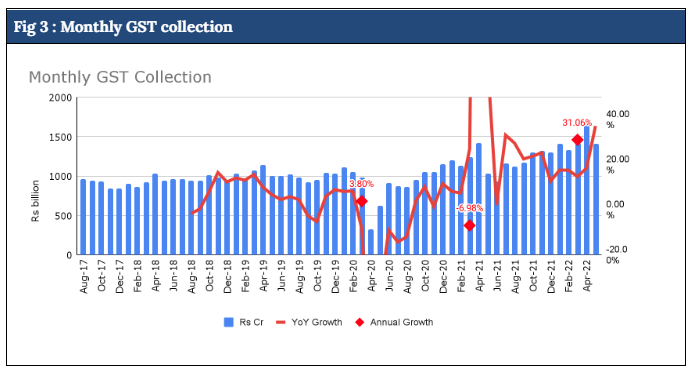
Though there were several hiccups in the rollout of GST related to technology infrastructure and complex rules, the benefits of the system are now clearly seen with the widening of the tax net and the increase in collections. In the initial 3 years, GST collection growth was sub 20% for most of the month, but in the last 12 months, not only has the GST collections on monthly basis grown upwards of 20% in all but one month, the absolute collections are also significantly higher than the pre-covid levels, as can be seen in Fig 3 below. Taking out the impact of Covid, three year CAGR for GST is running in low to mid teens over the last few months.
Related to GST are also the initiatives such as fastag which was rolled out nationally without a hitch. This has improved the pace at which goods are transported across the country resulting not only in cost savings but also expanding the markets for some produce. The government’s focus on improving connectivity of all forms is also likely to support strong GDP growth.
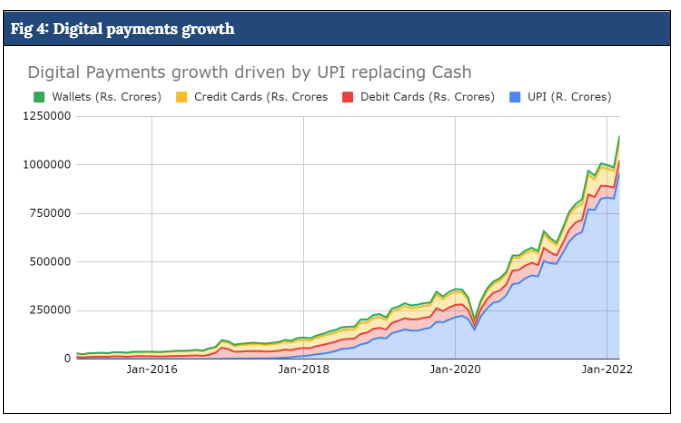
UPI driving digitalisation of transactions as well as credit penetration: While demonetisation gave a fillip to digital transactions, covid induced lockdowns further increased the propensity to transact digitally. After the blip in UPI transactions due to lockdown, the transaction value has more than quadrupled over the past 2 years. These UPI transactions are not only replacing cash and helping formalization, they are also generating transaction data for the merchants which the banks and other financial service providers have started using to provide credit facilities to the merchants. In recent months, UPI transactions have reached nearly half of nominal GDP, quite a remarkable statistic in every right (Fig 5).
Rise of Equity culture:
With a population of over 1.3bn people and average age being 29 years, India is one of the youngest and second-most populated countries in the World. Despite such a wide demographic base, only 6.4% of India’s population has a demat account versus 14% in China and 55% in USA. Further, only 5% of the Indian household savings is into equities. However, changing demographic shifts along with the ease of accessibility owing to the emergence of digital platforms is driving the young population of India to participate in the equity markets. Today, with access to affordable smartphones and high-speed mobile internet, young Indians are increasingly looking at asset classes beyond the traditional safe havens of real estate, gold or fixed deposits for their investing aspirations. The Covid-19, which restricted people to their homes, pushed them to learn and re-evaluate new means of creating wealth. Thus, in the last two years, the base of equity culture has grown multi-fold as retail investors embraced equity markets. Active clients count on NSE has grown from 10.8mn in FY20 to 36mn in FY22. Similarly, the number of demand accounts added in the last two years is more than the entire demat account base in FY20. The number of demat account holders as on FY22 is ~ 90 mn whereas the number in FY 20 was ~ 41 mn. Even the online mutual funds have also seen a huge jump with more and more people taking exposure to equities through systematic investment plan (SIP) accounts which now stands at 53.9mn in April 2022. Contribution in SIP has grown at a CAGR of 23% over FY17-22 period.
V. Impetus to Digital Commerce
Open Network for Digital Commerce (ONDC) is a network based on an open protocol that enables commerce across different segments and can be discovered and engaged by a network enabled application. As long as one has a platform and the same is ONDC compliant, one can access the network irrespective of the application used. The main feature of ONDC is that it makes the marketplace more democratic meaning any buyer can access any seller and vice versa irrespective of the platform they are using thus promoting interoperability and existence of different kinds of platforms in a healthy, fair and transparent manner and limited entry and exit barriers. ONDC will have a very broad-based impact on a variety of sectors including but not limited to banking, telecom, financial services, hospitality, consumer durables, consumer staples, food tech, mobility etc. Currently, the open protocol is under testing with 5 sellers and PayTM Mall as the buyer for the grocery and restaurant business. Once live, ONDC plans to charge subscription fees to the buyer and seller platforms amounting to a few thousand rupees and a per transaction fee to the consumer of 1.5% initially, which may lower to 0.1%-0.2% as the scale of the network increases.
VI. Rise of India-based tech companies with global footprint
The rise of India based tech companies with global relevance was something unthinkable a decade ago. India lacked a presence of a meaningful local market, often an ingredient for a company to succeed locally and abroad. While it had started to become common for US based tech companies to have a presence in India (to take advantage of affordable manpower), the reverse was almost unheard of. However, due to a confluence of factors are changing this equation and this is most visible in the Software product industry which is itself changing to be Software-as-a-service (SaaS) service. While examples may emerge from other industries of India based companies becoming global leaders in their space, SaaS story is of today. Software-as-a-Service (SaaS) continues to accelerate around the globe as industries and businesses shift toward cloud-based environments. With digitization increasing year-over-year due to an increasingly hybrid world, SaaS startups founded in India have seen significant growth in recent years. The year 2021 saw almost USD 4.8 billion invested in India SaaS companies, which is up nearly 3x from 2020 and a staggering 6x from 2018 (https://www.bvp.com/atlas/the-rise-of-saas-in-india). Today, there are Indian SaaS companies that fall into two categories – “India-first” and “global-first” businesses, but oftentimes they all begin with selling to the India market and expand into adjacent or other regions. The Indian tech sector including SaaS is benefitting from multiple factors that are breaking down the barriers and shrinking the supply chain.
a) Digital ecosystem – The emergence of the digital ecosystem has spurred development across a number of large industries, such as financial services (eg., Aadhar and UPI). Over 1 bn people in India have unique digital identities and all banks and financial institutions are connected through a common transactional back end which is also linked to the same identity. Software companies are now building products and solutions for banking and financial services on top of these commonly accepted standards. As discussed earlier, initiatives such as ONDC will give impetus to India’s own e-commerce ecosystem. The global giants such as Amazon are already feeling the heat as a result of that. It is quite possible that Indian businesses will be able to reach customers at even lower costs than through the likes of Amazon unless Amazon choses to forgo its profits. Not only are we seeing a rapid rise of Indian SaaS companies but also are we seeing growth of India’s own digital commerce companies. The National Health Stack is another important initiative for management of health care records at a scale of 1.3 billion people. The possibilities created by such an initiative are enormous not only in the form of improving health care and reducing costs but also creating technology plays around that which could have global implications.
b) Smartphones – Today, more people in India are using smartphones as compared to laptops or desktop devices. Cloud software companies are emerging to build productivity and business enablement tools for mobile devices.
c) The world is flat – During the pandemic, nearly all cloud software sales have been virtual (i.e. conducted over Zoom or another platform) leading to a new normal of software sales. This means that Indian SaaS companies can now target global customers sitting in India without the need for an elaborate global office setup. Many global SaaS leaders from India, such as Zoho, Freshworks and others have been able to scale up outside India.
VII. PLI drives Indian manufacturing
Production linked incentive (PLI) schemes were first introduced in India in March 2020, initially targeting three industries and has since expanded to 13 sectors pursuant to the recent Union Budget 2021-22 with budgetary outlay of Rs 1.97 lakh crore (USD 26bn) to boost India’s manufacturing capabilities and encourage export-oriented production under the aegis of Aatmanirbhar Bharat Abhiyan. The scheme is intended to increase industrial production by USD 520 bn over the period covering PLI policy implementation. Key objective of the scheme is to develop capacities in the local supply chain, introduce new downstream operations, and incentivize investments into high-tech production. The basic premise on which PLI schemes are designed are that –
- Incentives will be calculated on incremental production for which additional investments have been made either greenfield or brownfield;
- Incentives will be disbursed based on domestic output;
- Focuses on size and scale by selecting those players who can deliver on volumes; and
- Selecting sectors to cover cutting-edge technology, integrated with global value chains and create large scale employment. Details of PLI scheme so far announced are provided below:
| Sr no. | Sectors | Incentives | Investment received/committed/status |
| 1. | Mobile manufacturing and specified electronic components | 4-6% for a period of 5yrs | Investment made by approved applications after 1-Apr-21 is ~ INR 30 bn |
| 2. | Manufacturing of medical devices | 5% for a period of 5yrs | 13 applications were approved with total committed investment of ~ INR 7.99 bn |
| 3. | Critical key starting materials (KSMs)/drub intermediaries (DI) and active pharmaceutical ingredients (APIs) | 5-20% for a period of 6yrs | 42 applications were approved with total committed investments of ~ INR 43.57 bn |
| 4. | White goods (ACs and LEDs) | 4-6% for a period of 5yrs | 42 applications were approved with total investments of ~ INR 46.14 bn |
| 5. | Telecom and networking products | 4-7% for a period of 5yrs | Investment made upto Sep 2021 is ~ INR 1.83 bn |
| 6. | Electronic/technology products | 1-4% for a period of 4yrs | Investment made by approved application after 1-Apr-21 is ~INR 170mn |
| 7. | Pharmaceuticals drugs | 3-10% for a period of 6yrs | 278 application received and are under finalization |
| 8. | Food products | 4-10% for a period of 6yrs | Approved 56 companies in Category-I, 13 companies in Category-II and 80 companies in Category-III.20 applications are common in category I and III out of above 149 applications approved with total scheme outlay of ~ INR 109 bn |
| 9. | Solar PV Modules | Based on sales, performance criteria, and local value addition for a period of 5yrs | Letters of awards have been issued,details of investment are awaited |
| 10. | Advanced chemistry cell (ACC) Battery | Based on sales, performance criteria, and local value addition for a period of 5yrs | 4 applications were approved with total committed investment of INR 450 bn for battery technology |
| 11. | Textile products | Based on sales, performance criteria, and local value addition for a period of 5yrs | 61 applications were approved with total expected investment of INR 190.77 bn |
| 12. | Automotive industry and drone industry | Based on sales, performance criteria, and local value addition for a period of 5yrs and 3yrs respectively | 75 applications were approved with total committed investment of INR 298bn for Auto component20 applications were approved with total committed investment of INR 450bn for Auto OEMs14 applications were selected with total estimated investment of INR 50bn for Drone |
Appendix 1: Performance of the fund for FY2022
Appendix 2: Key Performance Contributors in FY2022