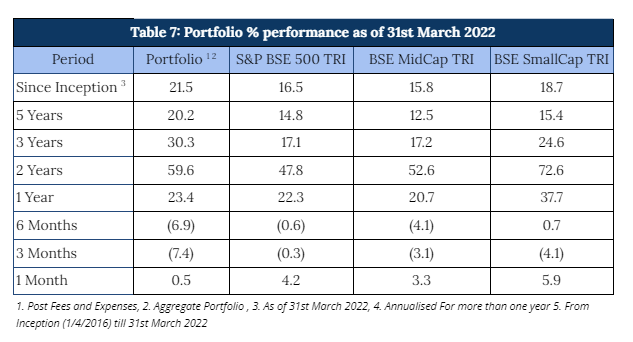
As defined by our strategy, we have maintained relatively higher levels of cash (14% on average over the entire period from inception) from time to time over the duration of managing the portfolio. Notwithstanding the same, from inception as well as over five and three years respectively, we have generated returns of 21.5%, 20.2% and 30.3% beating the benchmark BSE500 TRI returns of 16.5%, 14.8% and 17.1%. We have achieved this performance while having lower volatility than the market as demonstrated by portfolio Beta of 0.7 and Sharpe Ratio of 1.1 against 0.8 of BSE 500 benchmark. Table 7 below is a summary of the fund’s performance since inception.
Performance within the PMS Universe
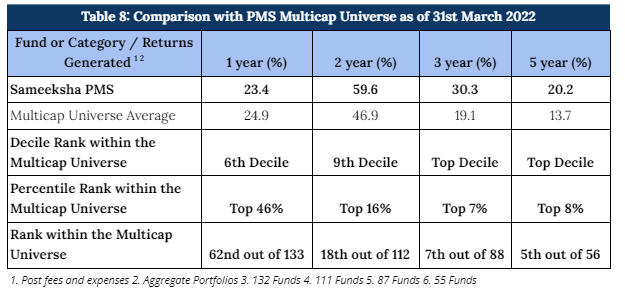
We continue to maintain our top rankings both within the multicap PMS universe as well as the entire PMS universe for longer key periods. The multicap PMS universe rankings are more relevant to us since we follow multicap strategy.
As can be seen in Table 8 below, for the three year period, we are ranked 7th out of 88 PMSes. In the same vein, we are ranked 5th out of 56 funds for the five year period comparison within the Multicap universe.
Rolling Returns and Rankings
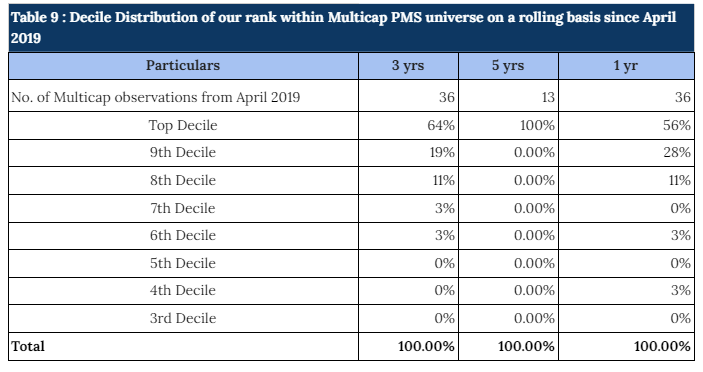
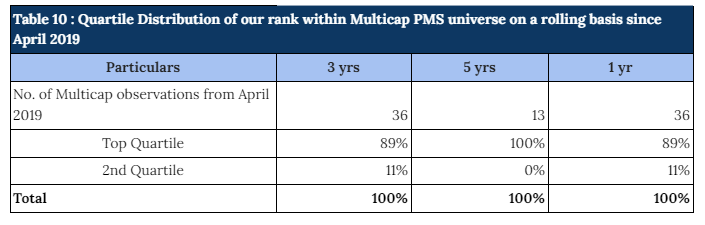
Rolling returns are a more useful indicator of consistency in performance versus single period returns. For the rolling three year periods applicable for our entire operating history, we have been ranked among the multicap universe in the top decile 64% of the time (23 out of 36 observations) (Table 9) and in top Quartile 89% of the time (32 out of 36 observations) (Table 10). For the remaining 11% observations, we were ranked in the second quartile . Also, for the three year period, we have remained in top decile every single month on a consecutive basis for almost two years since July 2020. Similarly, for the rolling five year periods applicable for our entire operating history, we have been ranked among the multicap universe in the Top Decile 100% of the time (13 out of 13 observations).
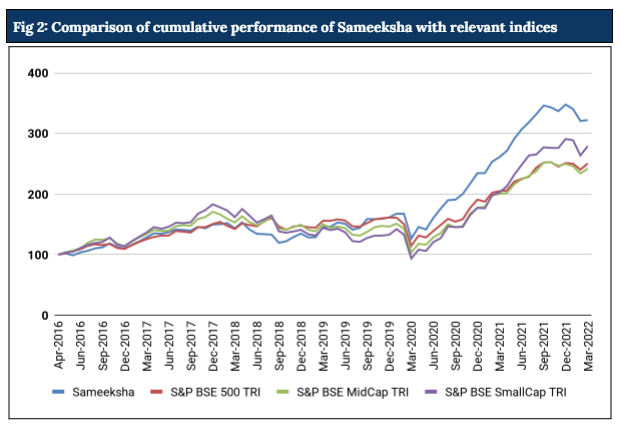
Cumulative Performance versus the benchmark
Sameeksha’s outperformance over its benchmark has continued to widen positively over the years. An investment of Rs. 100 with us since inception (April 2016) would have grown to Rs. 322, far outpacing what one would have earned by investing in a fund that achieved benchmark returns (Figure 2).
Performance on a Financial Year basis
Table 11 below shows the performance of Sameeksha PMS on a financial year basis against each of the indices to provide a better perspective of our performance for FY 2022 .
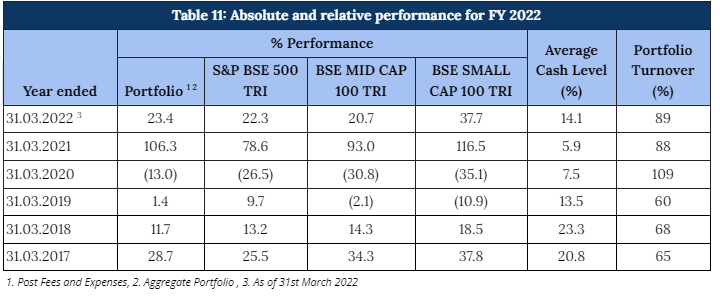
Looking at our performance over the financial years, it is evident that we have clearly out-performed our benchmark in four out of six financial years. Key however is that the sum of outperformance in those four years far exceeds the sum of underperformance in the remaining two years. Also important is that after adjusting for cash exposure, we underperformed the benchmark only in one out of six years.
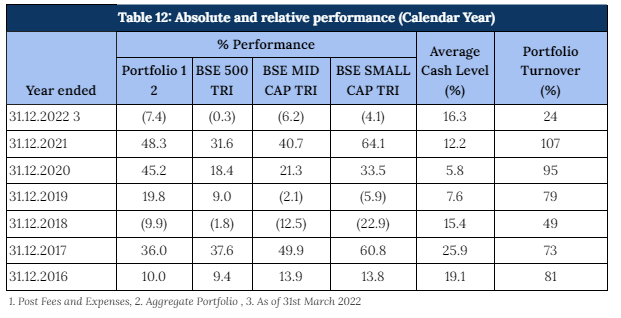
Performance on a Calendar Year basis
The performance pattern on a calendar year basis has been quite similar as well (Table 12). Although, for the current calendar year 2022, we are underperforming the benchmark (largely due to application of performance fees in March 2022), for the recently completed calendar year ending 2021, we have generated a return of 48.3% with an alpha of 16.7% over our benchmark BSE 500 TRI.
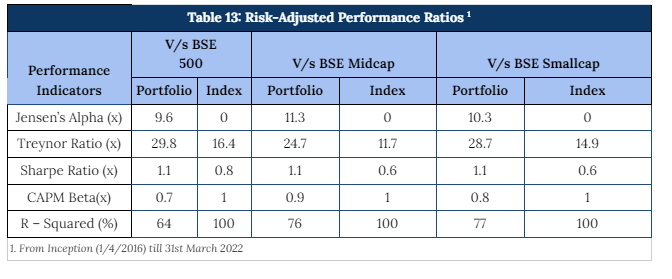
Risk Adjusted Ratios
When compared on a risk-adjusted basis (Table 13), our PMS shows even stronger performance with a risk-adjusted alpha generation of 9.6% over the broad market benchmark since its inception.
Furthermore, other risk-adjusted returns – Sharpe ratio and Treynor ratio, are also significantly higher than the benchmark indices. It is worth noting that we offer superior risk adjusted returns not only compared to the broad BSE 500 index heavily weighted towards large cap but also the small cap and mid cap benchmarks as demonstrated by our sharpe ratio, alpha, Treynor ratio and beta.
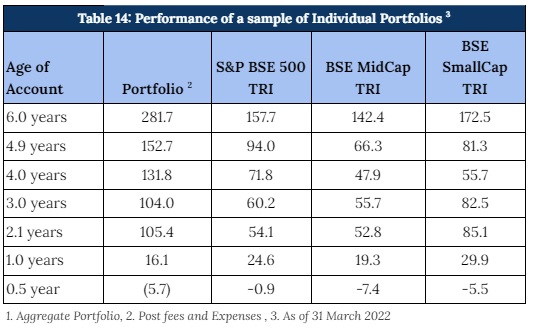
Performance Of Individual Portfolios
Portfolio returns for clients, except for investors starting with us over the last six to eight months have seen remarkably strong alpha (Table 14). Performance of portfolios of clients who joined us in the last one year is a matter of concern that we hope to be able to address over time.
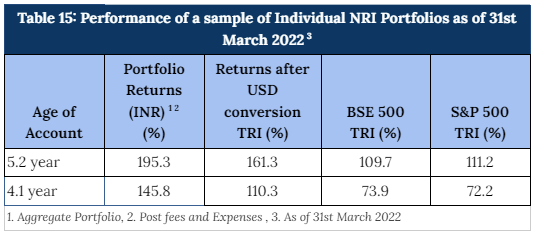
Similarly, our NRI clients have seen strong returns even after factoring in rupee depreciation against US dollars. The portfolio returns are significantly higher than both BSE 500 TRI and S&P 500 TRI, generating strong alpha over both these indices as can be seen in Table 15 below.
Appendix 1: Performance of the fund for FY2022
Appendix 2: Key Performance Contributors in FY2022
Appendix 3: Current view on top seven positions
Appendix 5: Additional factors affecting Indian Economy / markets