Buoyed by strong news from the Indian Economy (accelerating growth momentum and falling inflation) , the markets posted a strong month. Key market indices including the NIFTY 50 and the BSE Sensex clocked 2.2% and 2.1% respectively for the month of May. Sameeksha PMS gained 4.5% (net of all fees and expenses), and managed to carve an outperformance when compared to the benchmark BSE500TR which gained 3.8%.
It is worth reviewing key aspects of our performance as summarized below:
| Particulars | Summary of our performance | |
| 1. | Fund performance on a rolling period basis (Refer Table 5, Table 6 and Table 7) | Five year rolling period since inceptionAlpha delivered 100% of the time (i.e 27 out of 27 observations)Median alpha ~ 7%Three year rolling period since inceptionAlpha delivered 96% of the time (i.e 48 out of 50 observations)Median alpha ~ 9% For the rolling five year periods, we have been in the Top Decile 100% of the time (27 out of 27 observations)For the rolling three year periods, we have been in the Top Decile 68% of the time (34 out of 50 observations) and top quartile 92% of time. |
| 2. | Returns of Individual portfolios (Refer Table 8) | As Sameeksha PMS does not follow a model portfolio approach, tracking individual client performance becomes more relevant. All the clients with an age of account from six months to seven years have realized annualized alpha, with an average of 6.5%. |
| 3. | Risk Adjusted Ratios: Lower risk, Higher Return (Refer Table 4) | Our portfolio beta (0.9) has been lower than thebenchmark, and our returns have been higher than the benchmark since inception, implying superior risk adjusted performance |
| 4. | Fund performance on a Financial Year basis (Refer Table 1 and 2) | Delivered alpha (outperformance over the benchmark1) in six out of eight financial years including the current incomplete FY 24. Aggregate annual alpha over all the seven years ~ 43% |
| 5. | Aggregate portfolio returns as of May 31, 2023 (Refer Table 3) | From inception2 till May 31th 2023,Sameeksha PMS has delivered annualized alpha of 5%.For the five year and three year periods ending 31stMay 2023, Sameeksha PMS has delivered annualized alpha of 9% and 10% respectively. |
| 6. | PMS Universe rankings (Refer Table 9) | Among multicap PMSes with AUM more than INR 100 crs as of May 31st 2023, Sameeksha is ranked 3rd out of 48 funds for five year period and 7th out of 68 PMSes for the three year period as per performance reported to PMS Bazaar.Further, among multicap PMSes with AUM more than INR 100 crs as of May 31st, 2023, Sameeksha is ranked 6th out of 136 funds for five year period performance among PMSes that disclose their name and performance on the website of Association of Portfolio Managers of India (APMI) |
Three important things must always be kept in mind when looking at performance data. First, for funds such as ours that do not follow model portfolio strategy, the performance of individual clients for different duration is important to look at. Second, some PMSes may be charging fees outside the PMS and hence after fees, performance data may not be comparable to ours. Third, it is important to look at not only portfolio returns but also risk adjusted ratios. We provide data to address all three points later in this note.
Aggregate Fund Performance On A Financial Year Basis
For the month of May, Sameeksha PMS has outperformed the benchmark BSE 500 TRI by generating 4.5% returns against the benchmark BSE500TRI returns of 3.8%. Looking at our performance over the financial years (Table 1), we have outperformed our benchmark in six out of eight financial years (including the current incomplete financial year). Key however is that the sum of outperformance of 53% in those six years far exceeds the sum of underperformance of 10% in the remaining two years.
| Table 1: Absolute and relative performance (Financial Year) | |||
| Year ended | % Performance | ||
| Portfolio (A) 1 2 | S&P BSE 500 TRI (B) | Alpha vs S&P BSE 500 TRI (A-B) | |
| 31.03.2024 3 | 10.2 | 8.5 | 1.7 |
| 31.03.2023 | 4.5 | (0.9) | 5.4 |
| 31.03.2022 | 23.4 | 22.3 | 1.1 |
| 31.03.2021 | 106.3 | 78.6 | 27.7 |
| 31.03.2020 | (13.0) | (26.5) | 13.5 |
| 31.03.2019 | 1.4 | 9.7 | (8.3) |
| 31.03.2018 | 11.7 | 13.2 | (1.5) |
| 31.03.2017 | 28.7 | 25.5 | 3.2 |
It is important to note that we delivered this alpha despite maintaining a median cash level of 13.5% across the eight financial years. Further, our PMS has delivered a substantial aggregate annual alpha of 43% over BSE500 TRI implying average alpha of 5% since inception (Table 2).
| Table 2: Key data on alpha generation over 82 financial years since inception1 | |||
| Key Indices | Aggregate alpha generated % | Average alpha generated% | % times alpha generated over 8 FYs |
| BSE500 TRI | 42.8 | 5.3 | 75% |
Aggregate Portfolio Returns Over Various Time Periods
It is important to note that we have maintained relatively higher levels of cash (13.5% on average over the entire period from inception) from time to time over the duration of managing the portfolio. Notwithstanding the same, from inception as well as over five and three years respectively, we have generated returns of 20.1%, 21.3% and 37.9% beating the benchmark BSE500 TRI returns of 14.8%, 12.6% and 27.9% respectively after fees and expenses. We have delivered strong returns relative to benchmark across various key time periods. (Table 3).
| Table 3: Portfolio % performance since inception | |||
| Period | Portfolio % 1 2 (A) | S&P BSE 500 TRI % (B) | Alpha vs BSE500 TRI % (A-B) |
| Since Inception 3 4 | 20.1 | 14.8 | 5.2 |
| 5 Years | 21.3 | 12.6 | 8.7 |
| 3 Years | 37.9 | 27.9 | 9.9 |
| 2 Years | 12.9 | 10.6 | 2.3 |
| 1 Year | 20.1 | 12.9 | 7.3 |
| 6 Months | 7.6 | (0.8) | 8.4 |
| 3 Months | 10.5 | 8.9 | 1.6 |
| 1 Month | 4.5 | 3.8 | 0.7 |
Risk Adjusted Ratios: Not All Returns Are The Same: Higher Returns At Lower Risk
When compared on a risk-adjusted basis, our PMS shows an even stronger performance with a risk-adjusted alpha generation of 5.6% over the broader market benchmark since its inception. While our portfolio beta has been materially lower than our benchmark, our returns have been higher than the benchmark since inception, implying superior strong risk adjusted returns.
Furthermore, other risk-adjusted returns – Sharpe ratio and Treynor ratio, are also significantly higher than the benchmark indices (Table 4). It is worth noting that we offer superior risk adjusted returns not only compared to the broad BSE500 index heavily weighted towards large cap but also the small cap and mid cap benchmarks as demonstrated by our Sharpe ratio, Alpha, Treynor ratio and Beta.
| Table 4: Risk-Adjusted Performance Ratios 1 | ||
| Performance Indicators | V/s BSE 500 | |
| Portfolio | Index | |
| Jensen’s Alpha (x) | 5.6 | 0 |
| Treynor Ratio (x) | 21.5 | 15.5 |
| Sharpe Ratio (x) | 1.1 | 0.9 |
| CAPM Beta(x) | 0.9 | 1 |
| R – Squared (%) | 0.75 | 100 |
Aggregate Fund Performance And Ranking On A Rolling Period Basis
Rolling returns are a more useful indicator of consistency in performance versus single period returns. For the rolling three year periods applicable to our entire operating history, Sameeksha PMS has delivered aggregate annualized alpha 96% of the times (48 out of 50 observations) ranging from 0.4% to 23%. For the rolling five year periods applicable, Sameeksha PMS has delivered aggregate annualized alpha 100% of the time (27 out of 27 observations) ranging from 5% to 10% (Table 5).
| Table 5: Number of times alpha1 generated over rolling five and three year periods | ||
| Particulars | Rolling Five Year periods | Rolling Three Year periods |
| Number of observations | 27 | 50 |
| Number of times alpha generated | 27 | 48 |
| % times alpha generated | 100% | 96% |
| Median annualized alpha | 7% | 9% |
| Maximum annualized alpha | 10% | 23% |
| Minimum annualized alpha | 5% | 0.4% |
For the rolling three year periods applicable to our entire operating history, we have been ranked among the multicap universe in the Top Decile 68% of the time (34 out of 50 observations) and in the Top Quartile 92% of the time (45 out of 50 observations). For the remaining 8% observations, we were ranked in the Second Quartile (Tables 6 and 7). For the rolling five year periods applicable for our entire operating history, we have been ranked among the multicap universe in the Top Decile 100% of the time (27 out of 27 observations).
| Table 6: Decile distribution of our rank within the Multicap PMS universe on a rolling basis since April 2019 | |||
| Particulars | One Year | Three Years | Five Years |
| Number of Observations | 50 | 50 | 27 |
| Top Decile 1 | 40% | 68% | 100% |
| 9th Decile 2 | 22% | 20% | 0% |
| 8th Decile | 14% | 8% | 0% |
| 7th Decile | 2% | 2% | 0% |
| 6th Decile | 8% | 2% | 0% |
| 5th Decile | 4% | 0% | 0% |
| 4th Decile | 6% | 0% | 0% |
| 3rd Decile | 4% | 0% | 0% |
| Total | 100% | 100% | 100% |
| Table 7: Quartile distribution of our rank within the Multicap PMS universe on a rolling basis since April 2019 | |||
| Particulars | One Year | Three Years | Five Years |
| No. of Observations | 50 | 50 | 27 |
| Top Quartile 1 | 70% | 92% | 100% |
| 2nd Quartile 2 | 22% | 8% | 0% |
| 3rd Quartile | 4% | 0% | 0% |
| 4th Quartile | 4% | 0% | 0% |
| Total | 100% | 100% | 100% |
Returns Of Individual Portfolios
Because we don’t follow model portfolio strategy, the performance of individual clients is far more important than overall portfolio aggregate returns (Table 8). For investors who are with us for 3 years and more, Sameeksha PMS has returned a very substantial alpha with an average annualized alpha of approx. 9% for the three year period ending 31st May 2023. Similarly, for investors who are with us for 5 years and more, Sameeksha PMS has returned substantial alpha with an average annualized alpha of approx. 9% for the five year period ending 31st May 2023. The table below shows the average annualized returns and alpha over different periods of time of all the clients as on 31st May 2023.
| Table 8: Performance of All Client Portfolios across various duration | |||||||||
| Median Age of Accounts 2 3 4 | Since Inception | Five Years(Benchmark1 Return = 12.6%)2 | Three Years(Benchmark1 Return = 27.9%) 2 | Two Years(Benchmark1 Return = 10.5%)2 | |||||
| Average Returns 5 | Average Benchmark Returns1 | Alpha | Average Returns 5 | Alpha | Average Returns 5 | Alpha | Average Returns 5 | Alpha | |
| 7 Years | 20.2 | 14.5 | 5.8 | 21.8 | 9.2 | 38.5 | 10.6 | 11.2 | 0.6 |
| 6.5 Years | 19.0 | 13.5 | 5.6 | 21.0 | 8.4 | 37.2 | 9.2 | 11.0 | 0.4 |
| 6 Years | 18.0 | 12.8 | 5.3 | 21.5 | 8.9 | 38.1 | 10.1 | 11.9 | 1.3 |
| 5.5 Years | 18.6 | 12.1 | 6.6 | 21.2 | 8.6 | 36.3 | 8.4 | 11.1 | 0.5 |
| 5 Years | 24.2 | 12.6 | 11.6 | 23.9 | 11.4 | 38.1 | 10.2 | 13.6 | 3.0 |
| 4.5 Years | 26.0 | 15.3 | 10.8 | – | – | 37.0 | 9.0 | 14.4 | 3.9 |
| 4 Years | 24.0 | 14.4 | 9.6 | – | – | 35.1 | 7.1 | 10.4 | -0.2 |
| 3.5 Years | 27.5 | 16.3 | 11.2 | – | – | 36.3 | 8.3 | 11.9 | 1.3 |
| 3 Years | 30.8 | 25.5 | 5.4 | – | – | 34.2 | 6.3 | 12.5 | 1.9 |
| 2.5 Years | 22.7 | 18.9 | 3.8 | – | – | – | – | 13.8 | 3.2 |
| 2 Years | 10.2 | 10.0 | 0.1 | – | – | – | – | 12.2 | 1.7 |
| 1.5 Years | 9.8 | 4.6 | 5.2 | – | – | – | – | – | – |
| 1 Year | 16.9 | 10.7 | 6.2 | – | – | – | – | – | – |
| 6 Months | 8.6 | 4.3 | 4.3 | – | – | – | – | – | – |
Performance Within The PMS Universe
We continue to maintain our top rankings both within the multicap PMS universe as well as the entire PMS universe for key periods of three and five years. The multicap PMS universe rankings are more relevant to us since we follow the multicap strategy.
In the interest of a fair comparison, we present our rankings among those multicap PMSes with AUM more than INR 100 crs. Within this universe, we are 3rd out of 48 PMSes for the five year period and 7th out of 68 PMSes for three year period, highlighting our superior performance over the long term periods (Table 9). Among the multicap universe (considering all AUM), we are consistently ranked in the Top Decile for the five year period for all 27 out of 27 observations reflecting well on the consistency of our performance.
| Table 9: Comparison with PMS Multicap Universe as of 31st May 2023 | ||||
| Fund or Category / Returns Generated 1 2 | 1 year (%) | 2 year (%) | 3 year (%) | 5 year (%) |
| Sameeksha PMS | 20.1 | 12.9 | 37.9 | 21.3 |
| Multicap Universe Average | 14.1 | 10.7 | 29.0 | 12.0 |
| Decile Rank within the Multicap Universe | 8th Decile | 7th Decile | Top Decile | Top Decile |
| Percentile Rank within the Multicap Universe | Top 24% | Top 33% | Top 9% | Top 5% |
| Rank within the Multicap Universe 3 4 5 6 | 19th out of 78 | 25th out of 75 | 7th out of 68 | 3rd out of 48 |
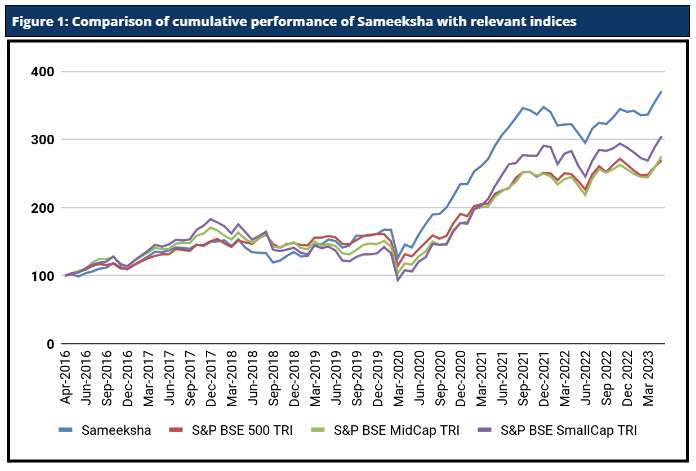
Cumulative Performance Versus The Benchmark
Sameeksha’s outperformance over its benchmark has continued to widen positively over the years. An investment of Rs. 100 with us since inception (April 2016) would have grown to Rs. 371, far outpacing what one would have earned by investing in a fund that achieved benchmark returns (Figure 1).
Analyzing The Sector Performance During The Month
During the month, indices that showed growth this month include IT, Auto & Ancillaries, FMCG. For Sameeksha PMS, the Aviation, Bank, and IT sectors were outperformers compared to the benchmark. However, what hurt us is the lack of exposure towards FMCG and Auto & Ancillaries where we missed out on participating in the upturn. Below is the attribution analysis for the month of May 2023 (Table 10).
| Table 10: Sectorwise Attribution Analysis 1 for the month of May 2023 | |||
| Sector | Portfolio Contribution | Benchmark Contribution | Difference |
| Aviation | 0.90% | 0.04% | 0.86% |
| Bank | 0.93% | 0.28% | 0.65% |
| IT | 1.18% | 0.68% | 0.50% |
| Realty | 0.46% | 0.06% | 0.40% |
| Healthcare | 0.37% | 0.13% | 0.24% |
| Insurance | 0.32% | 0.14% | 0.18% |
| Capital Goods | 0.38% | 0.21% | 0.17% |
| Infrastructure | 0.00% | -0.15% | 0.15% |
| Gas Transmission | 0.00% | -0.13% | 0.13% |
| Power | 0.00% | -0.08% | 0.08% |
| Iron & Steel | 0.00% | -0.06% | 0.06% |
| Media & Entertainment | 0.06% | 0.00% | 0.06% |
| Non – Ferrous Metals | 0.00% | -0.04% | 0.04% |
| Plastic Products | 0.07% | 0.05% | 0.02% |
| Diamond & Jewellery | 0.08% | 0.06% | 0.02% |
| Paper | 0.00% | 0.00% | 0.00% |
| Ship Building | 0.00% | 0.00% | 0.00% |
| Ratings | 0.00% | 0.00% | 0.00% |
| Agri | 0.00% | 0.01% | -0.01% |
| Mining | 0.00% | 0.01% | -0.01% |
| Miscellaneous | 0.00% | 0.01% | -0.01% |
| Abrasives | 0.00% | 0.01% | -0.01% |
| Diversified | 0.00% | 0.02% | -0.02% |
| Textile | -0.02% | 0.00% | -0.02% |
| Alcohol | 0.00% | 0.03% | -0.03% |
| Finance | 0.28% | 0.31% | -0.03% |
| Hospitality | 0.01% | 0.05% | -0.04% |
| Logistics | 0.00% | 0.05% | -0.05% |
| Consumer Durables | 0.00% | 0.06% | -0.06% |
| Retailing | -0.06% | 0.02% | -0.08% |
| Construction Materials | 0.00% | 0.10% | -0.10% |
| Telecom | 0.00% | 0.11% | -0.11% |
| Inds. Gases & Fuels | -0.14% | -0.02% | -0.12% |
| Trading | 0.13% | 0.26% | -0.13% |
| Crude Oil | 0.00% | 0.17% | -0.17% |
| Chemicals | -0.05% | 0.14% | -0.19% |
| Automobile & Ancillaries | 0.15% | 0.50% | -0.35% |
| FMCG | 0.00% | 0.48% | -0.48% |
| Electricals | -0.57% | 0.01% | -0.58% |
Disclaimer – The information contained in this update is provided by our fund accounting platform and is not audited.