* Period ending 31st August, 2025, ** Three-year period, *** Rolling five-year returns of all the Multicap PMSes reporting to PMS Bazaar, **** For rolling five year periods from inception till date, ***** Five-year Period
In August 2025, Indian equities were volatile with the Nifty Smallcap 250 index sharply correcting by 3.72%, significantly underperforming the Nifty. The correction was driven by the implementation of an additional 25% US tariff, continuing FII outflows, and softer retail participation as equity mutual fund inflows moderated to ₹33,430 crore, lower than July levels. Macro signals were mixed this month: industrial production showed signs of rebound, but CPI inflation in India increased to 2.07% from 1.61% in July, ending a nine-month easing trend. Crude oil prices largely stayed within a comfortable range as fuel inflation continued to decline. However, external risks persisted; tariff actions by the US and mixed economic cues from China contributed to cautious investor sentiment and selective risk-taking, particularly in the mid- and small-cap segments where valuations remain elevated. Despite short-term volatility, factors such as benign inflation, improved liquidity, and expectations of demand revival through GST rationalization remain constructive for Indian equities over the medium term. The combination of domestic flows, supportive macro conditions, and ongoing policy initiatives is expected to underpin the market’s resilience and gradual recovery from temporary corrections.
In August, the benchmark S&P BSE 500 TRI fell by 1.75%. Against that, Sameeksha PMS (Portfolio Management Service = Separately Managed Accounts) was down by 3.04% (net of all fees and expenses), indicating an underperformance of 1.3%; while having cash levels of 16.4% at the start of the month and 13% at the end of the month.
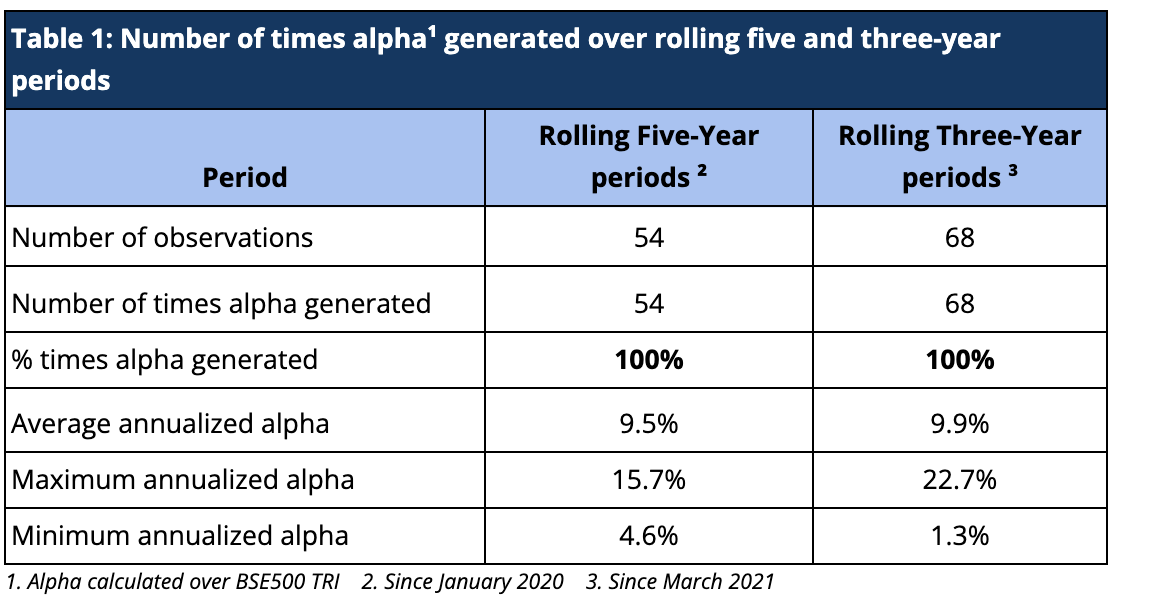
From the fifty-four rolling five year periods that we have completed, what stands out the most is the consistency of alpha generation across various periods. This stability indicates that the portfolio’s performance is not reliant on isolated stock picks or favorable market timing. Rather, it reflects a disciplined and repeatable investment process. The rolling return analysis reinforces that temporary market conditions do not drive the outcomes but are the result of a reliable, long-term approach to investing. We discuss the data in more detail later in this letter.
This consistent performance is further validated when benchmarked against the broader industry. When compared with the entire Multicap PMS universe reporting to PMS Bazaar, our strategy has consistently ranked in the top decile for five-year returns over fifty-four consecutive months.
Sameeksha Domestic AIF (Alternative Investment Fund = “Hedge Fund”) also continues to deliver top-notch performance, having recently completed three years of operating history. This AIF ranks right up at number two out of forty-six Long-Only AIFs reporting their performance to PMS Bazaar. Our AIF was down by 2.89% (post fees, expenses and taxes), indicating an underperformance of 1.14% over the benchmark. Positive contributions came from Healthcare and Diamond & Jewellery leading the gains at 0.13%. However, these were outweighed by negative contributions from Finance, Chemicals, Aviation, IT, and Business Services. We compare our performance with some of the highly recommended mutual funds. We have compared returns, the Sharpe Ratio, as well as upside and downside capture ratios.
We summarize key aspects of our performance as follows:
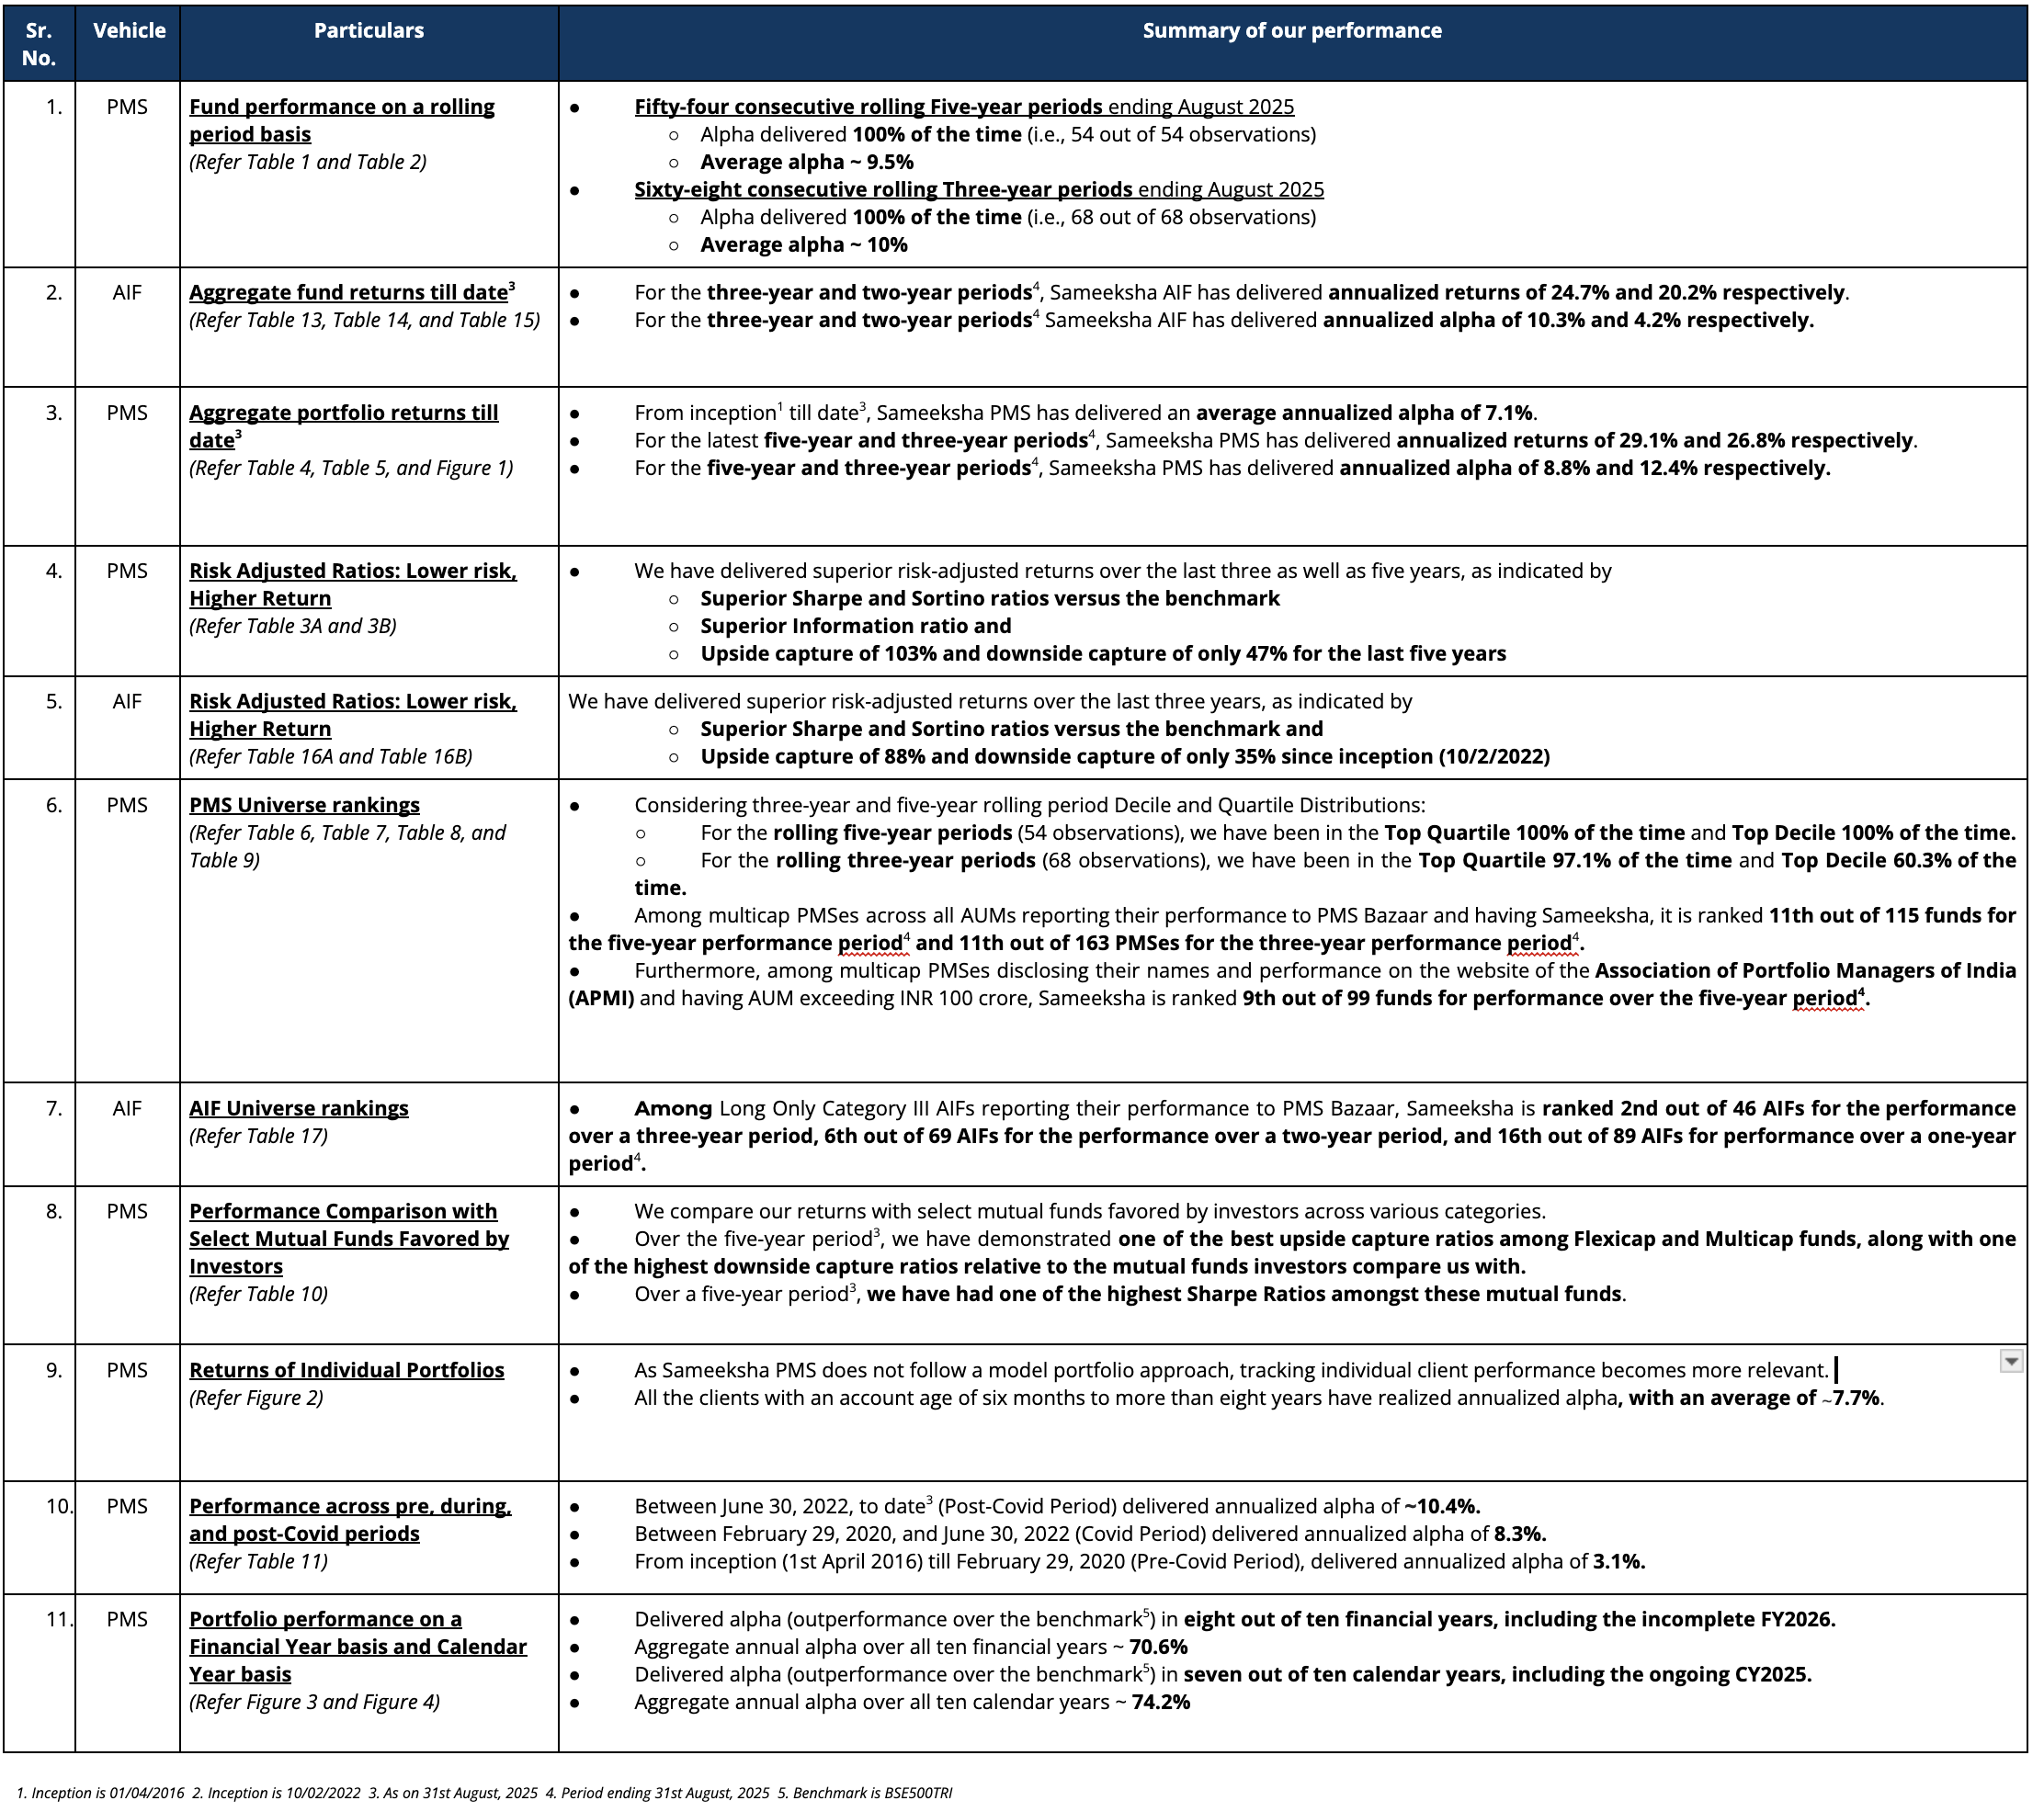
PMS Performance and other details
Three important things must always be kept in mind when looking at performance data. First, for funds such as ours that do not follow a model portfolio strategy, the performance of individual clients over different durations is important to examine. Second, some PMSes may charge fees outside the PMS, which could make their performance data non-comparable to ours after fees. Third, it is important to look at not only portfolio returns but also risk-adjusted ratios. We provide data to address all three points later in this note.
Aggregate Portfolio Performance and ranking on a rolling period basis
Rolling returns are a more useful indicator of consistency in performance versus single-period returns. For the rolling five-year periods applicable from March 2021 till date, Sameeksha PMS has delivered aggregate annualized alpha 100% of the time (54 out of 54 observations), ranging from ~5% to ~16%. For the rolling three-year periods applicable from January 2020 till date, Sameeksha PMS has delivered aggregate annualized alpha 100% of the time (68 out of 68 observations), ranging from ~1% to ~23%. (Table 1). For both rolling five and three-year periods covered in Table 1, alpha has averaged around 9.5% and 10% respectively.
To analyze the rolling five-year and three-year returns, we did an insightful exercise, analyzing average five-year and three-year rolling returns across different time frames.
The table below (Table 2) presents Sameeksha PMS’s portfolio performance using rolling five-year and three-year returns. This method evaluates returns over overlapping periods ending on each date within a given time range. By averaging these rolling returns over different lookback periods, we gain a deeper understanding of how consistently the portfolio has delivered value over time, compared to the BSE 500 TRI benchmark.
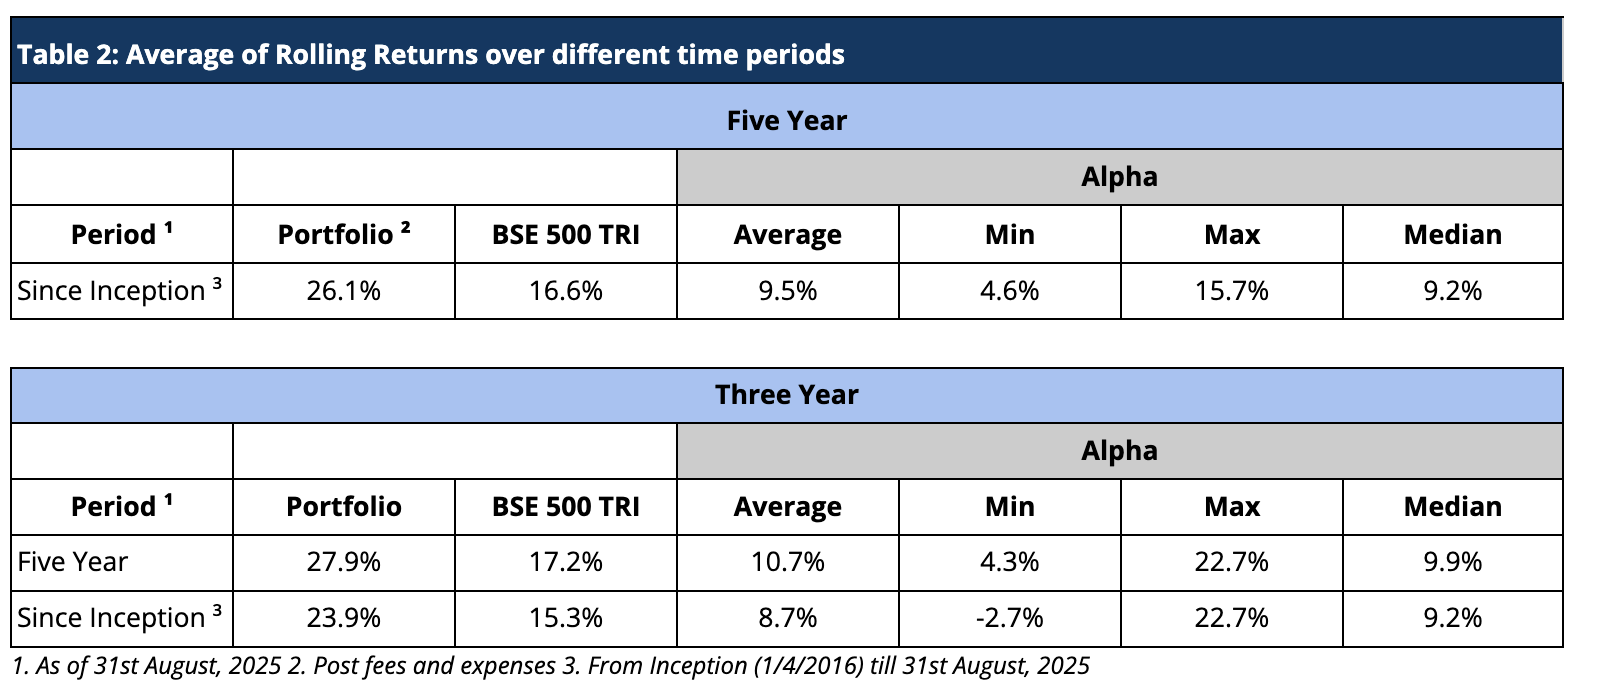
The results reveal a strong and persistent pattern of outperformance. Across all measured periods, average three-year or five-year rolling returns have consistently outpaced the benchmark. What stands out in particular is the stability of alpha across different lookback periods. This consistency suggests that the portfolio’s success is not driven by isolated bets or favorable market timing, but rather by a disciplined and repeatable process. The rolling return framework helps illustrate that this performance is not a result of temporary market positioning but instead reflects a reliable, long-term approach to investing.
Risk Adjusted Ratios: Not all returns are the same, Higher Returns at lower Risk
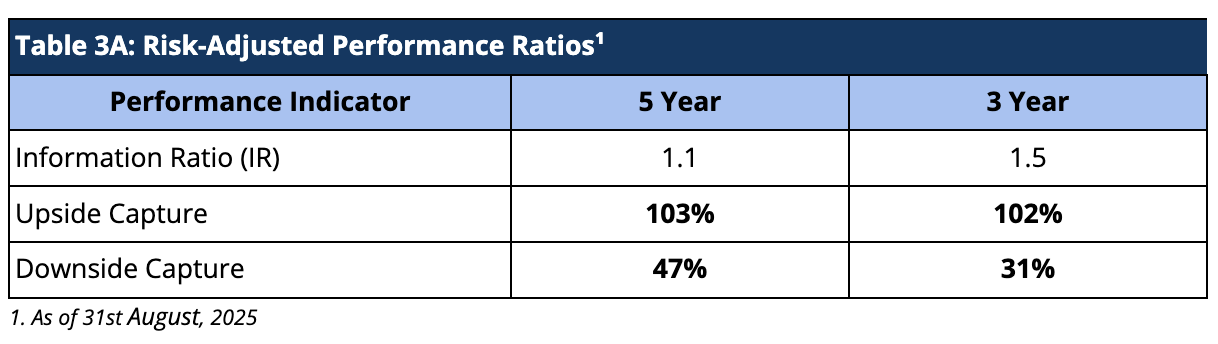
When compared on a risk-adjusted basis, our PMS has shown an even stronger performance. The Information Ratio (IR) measures the excess return of a portfolio over a benchmark per unit of active risk. A higher Information Ratio suggests better risk-adjusted performance.
Moreover, Upside Capture measures how well a fund performs as compared to a benchmark when the benchmark has positive returns. A higher upside capture ratio (>100%) indicates that the fund captures more of the benchmark’s positive movements. Whereas, Downside Capture measures how well a fund performs compared to a benchmark when the benchmark has negative returns. A lower downside capture ratio (<100%) indicates that the fund preserves capital better during market downturns. (Table 3A).
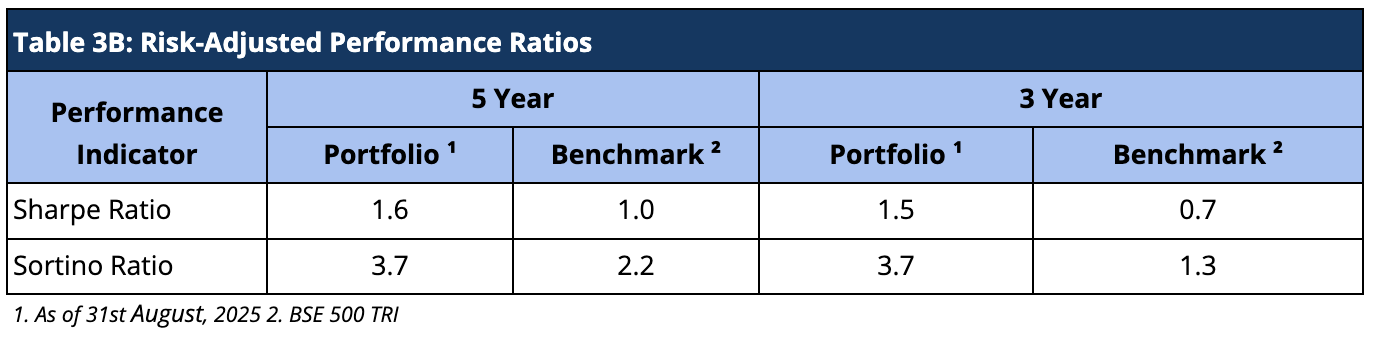
Furthermore, other risk-adjusted returns – Sharpe ratio is also significantly higher. The Sortino ratio measures the risk-adjusted return of an investment, focusing only on the downside risk. A higher Sortino ratio indicates better risk-adjusted returns, particularly concerning downside risk. (Table 3B).
Aggregate Portfolio Returns over various time periods
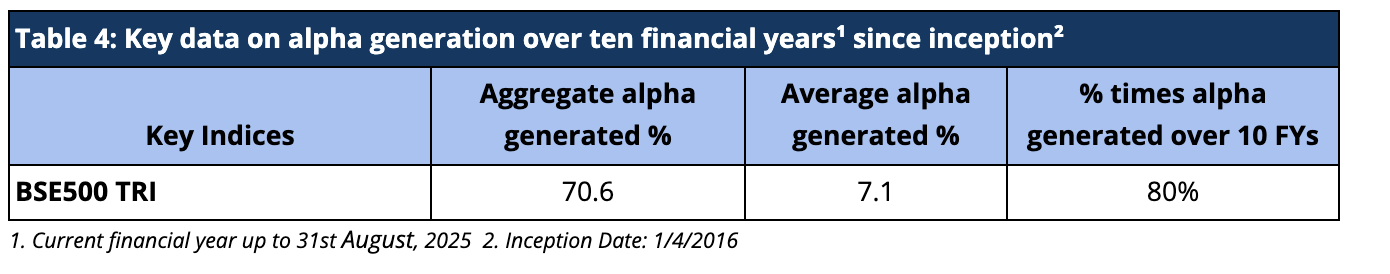
Sameeksha PMS has delivered a substantial aggregate annual alpha of 70.6% over BSE500 TRI over the ten financial years (including the current incomplete financial year), implying an average alpha of 7.1% since inception (Table 4).
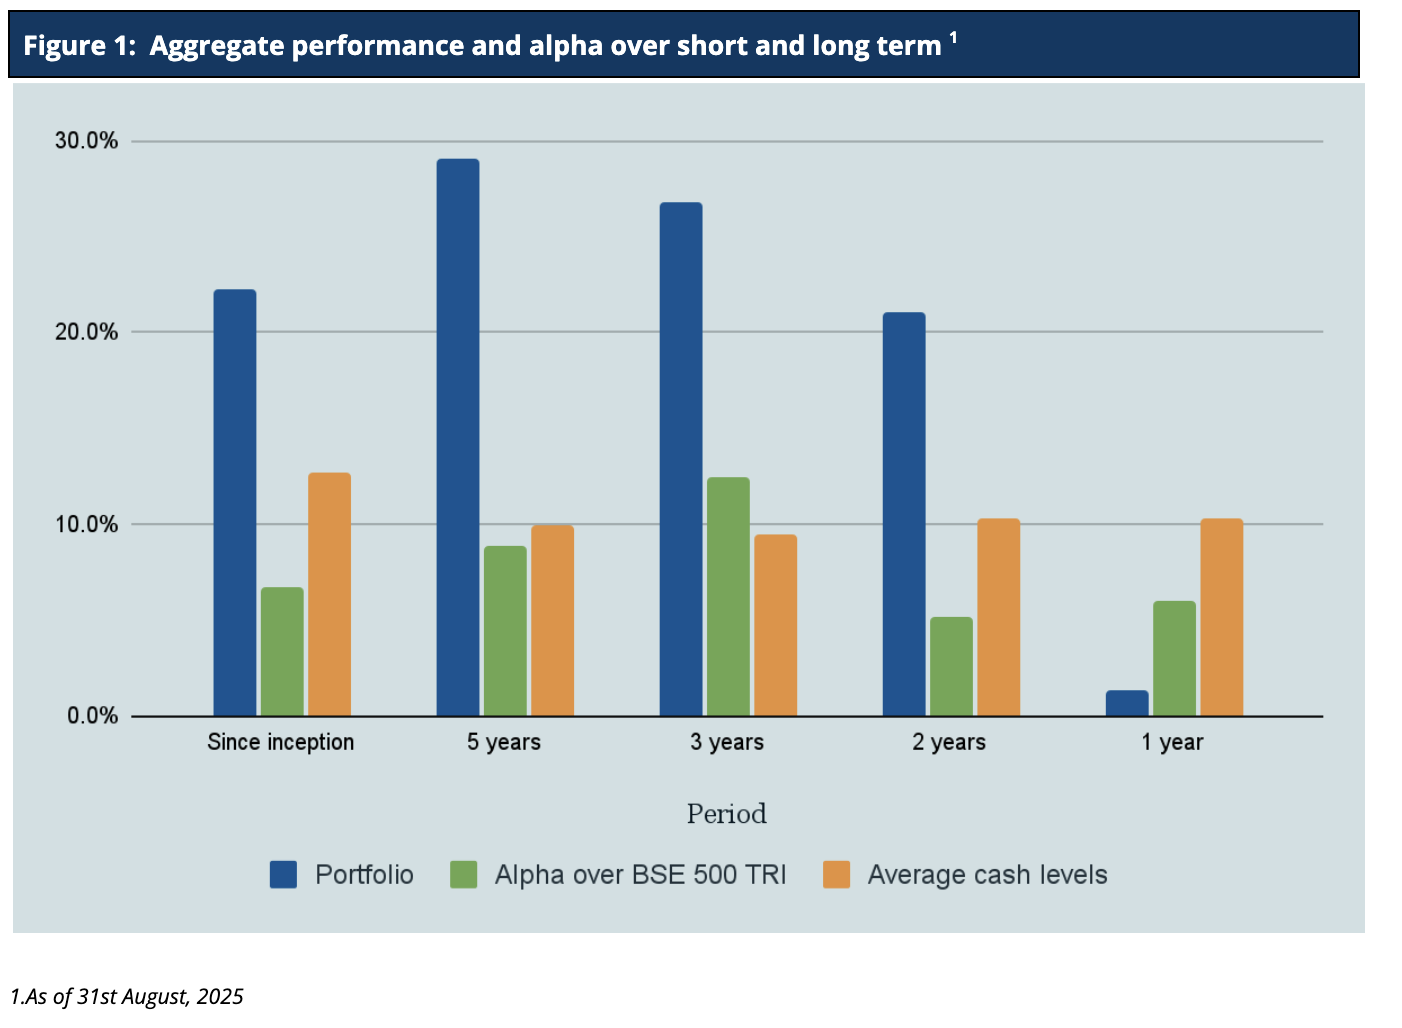
It is important to note that we have maintained relatively higher levels of cash (12.6% on average over the entire period since inception) from time to time throughout the management of the portfolio. Notwithstanding the same, from inception, over five years and three years respectively, we have generated returns of 22.2%, 29.1% and 26.8% in INR terms and 18.6%, 24.5%, and 22.6% in USD terms, thus generating substantial alpha over the Indian benchmark BSE500 TRI. Also, we have delivered strong returns relative to benchmark across various key time periods (Figure 1 and Table 5).

Performance within the PMS Universe
We continue to maintain our top rankings both within the multicap PMS universe as well as the entire PMS universe for key periods of three and five years. The multicap PMS universe rankings are more relevant to us since we follow the multicap strategy.
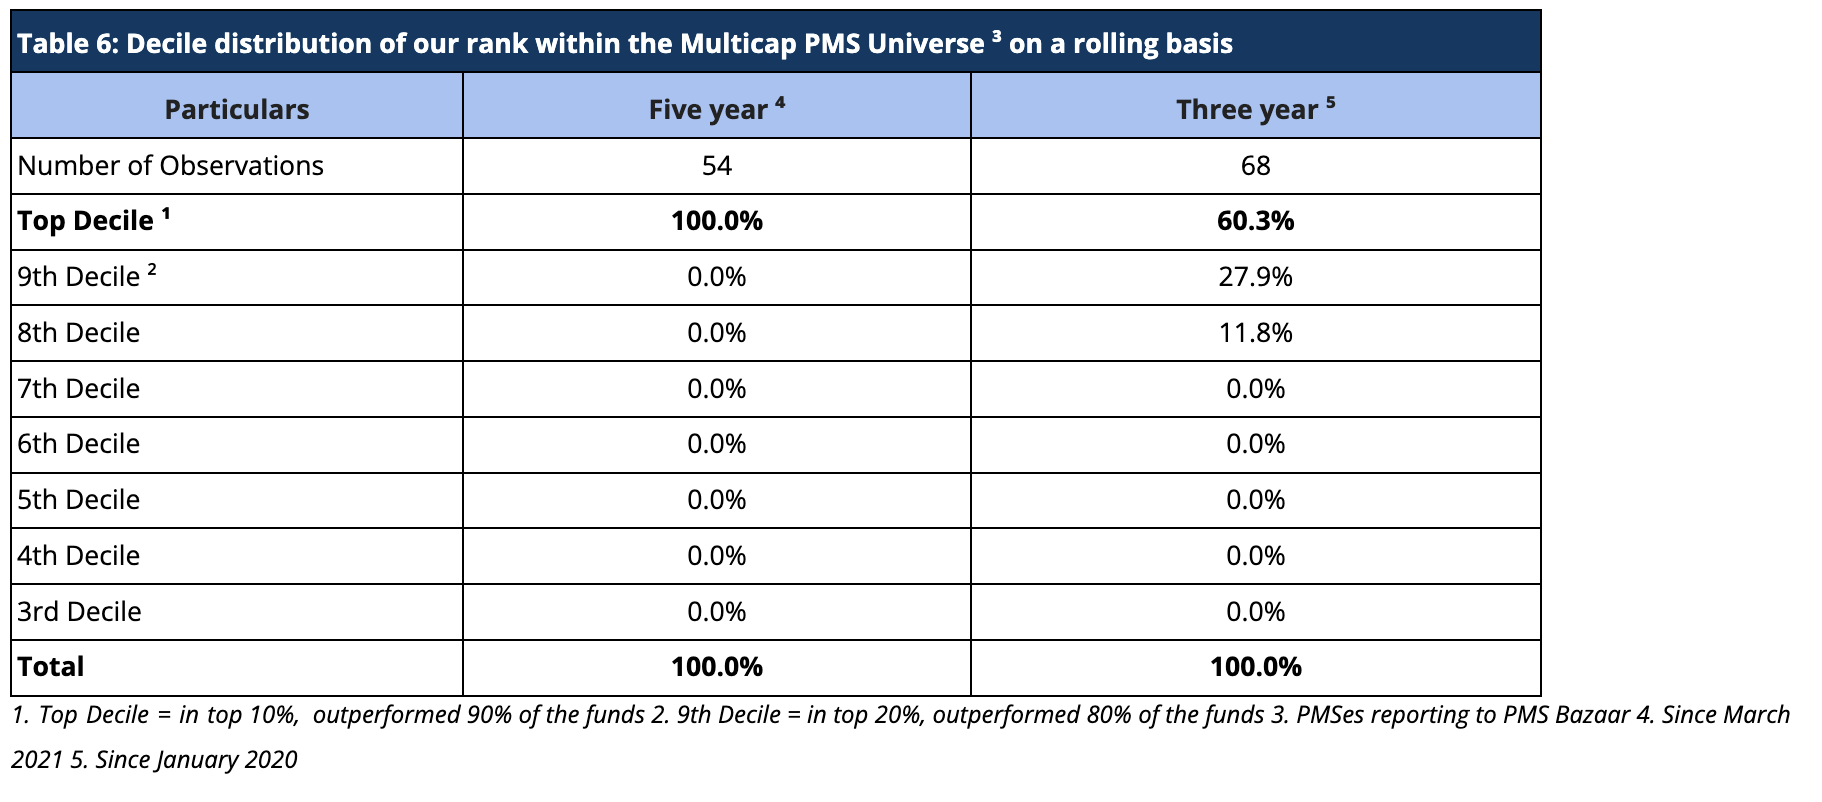
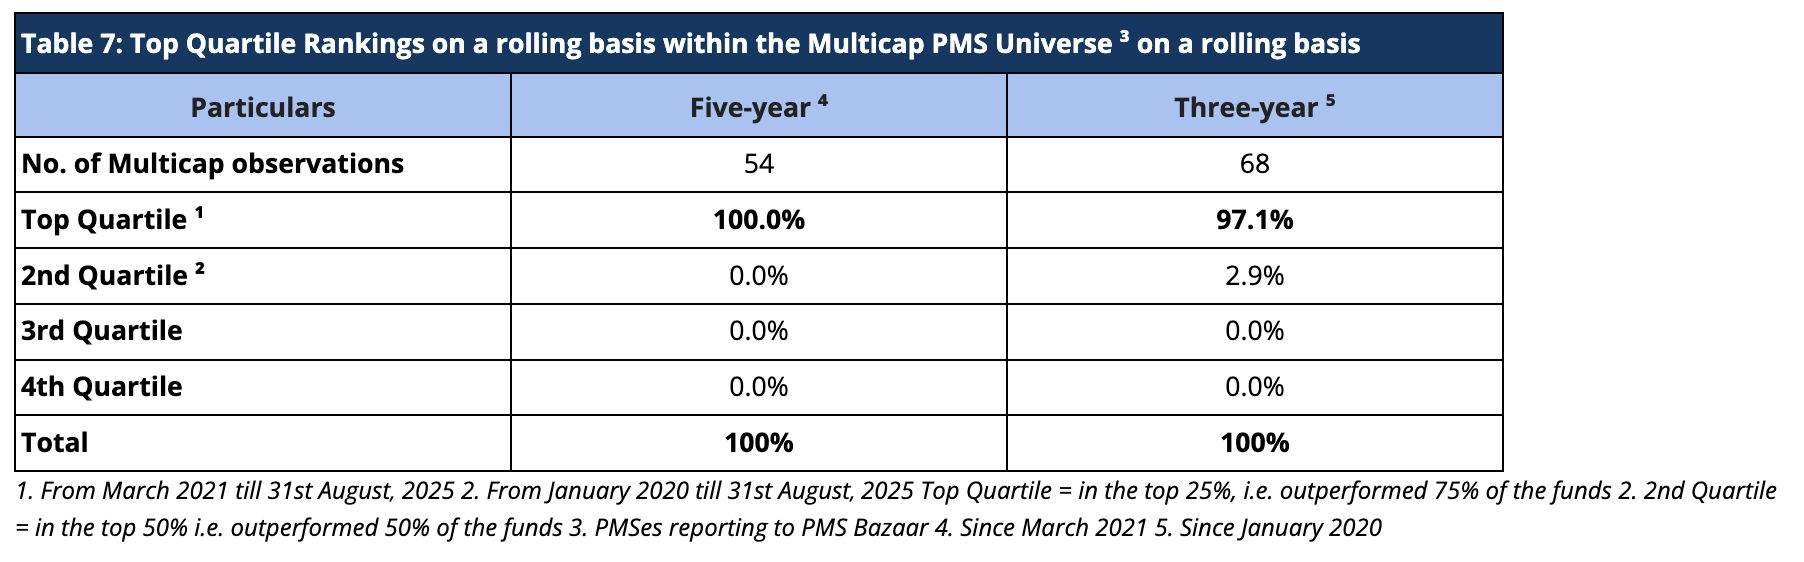
For rolling three-year periods applicable since January 2020, we have been ranked among the multicap universe in the Top Decile 60.3% of the time (41 out of 68 observations) and in the Top Quartile 97.1% of the time (66 out of 68 observations). For rolling five-year periods applicable to our entire operating history, we have been ranked among the multicap universe in the Top Quartile 100% (54 out of 54 observations) and Top Decile 100% of the time (54 out of 54 observations). (Tables 6 and 7)
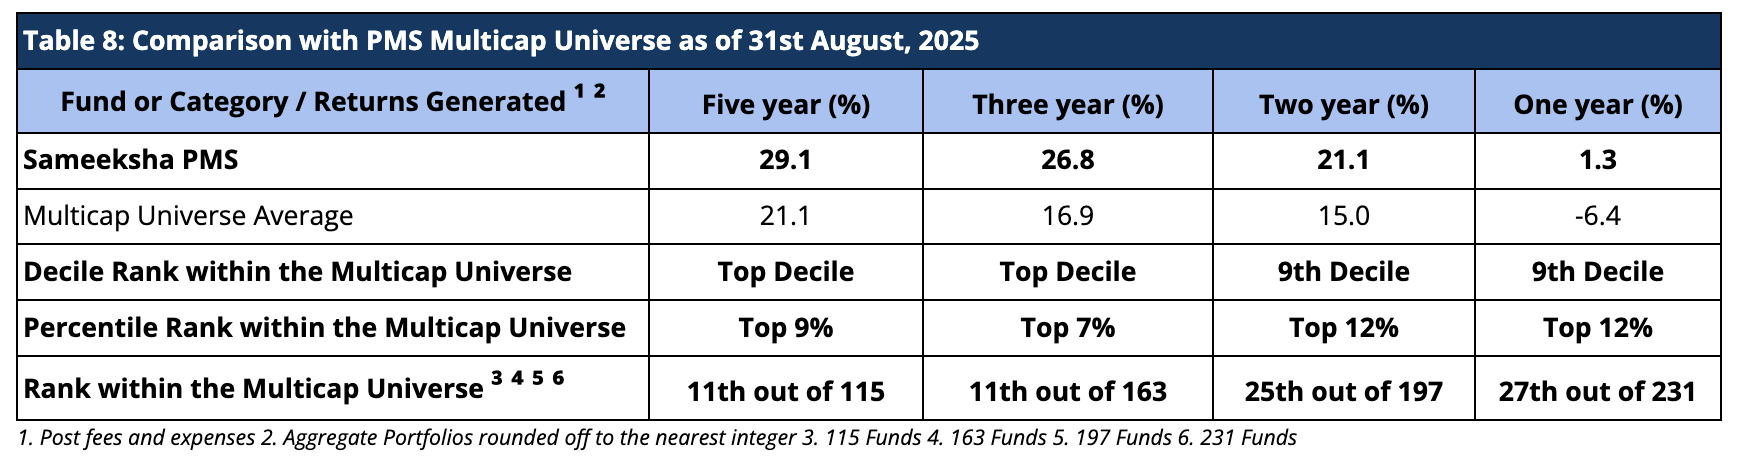
We present our rankings among the multicap PMSes across all AUM sizes. Within this universe, we are 11th out of 115 PMSes for the five year period and 11th out of 163 PMSes for three-year period, highlighting our superior performance over the long term periods (Table 8). Among the multicap universe across all AUM sizes, we are consistently ranked in the Top Decile for the five-year period for 54 out of 54 observations, reflecting well on the consistency of our performance.
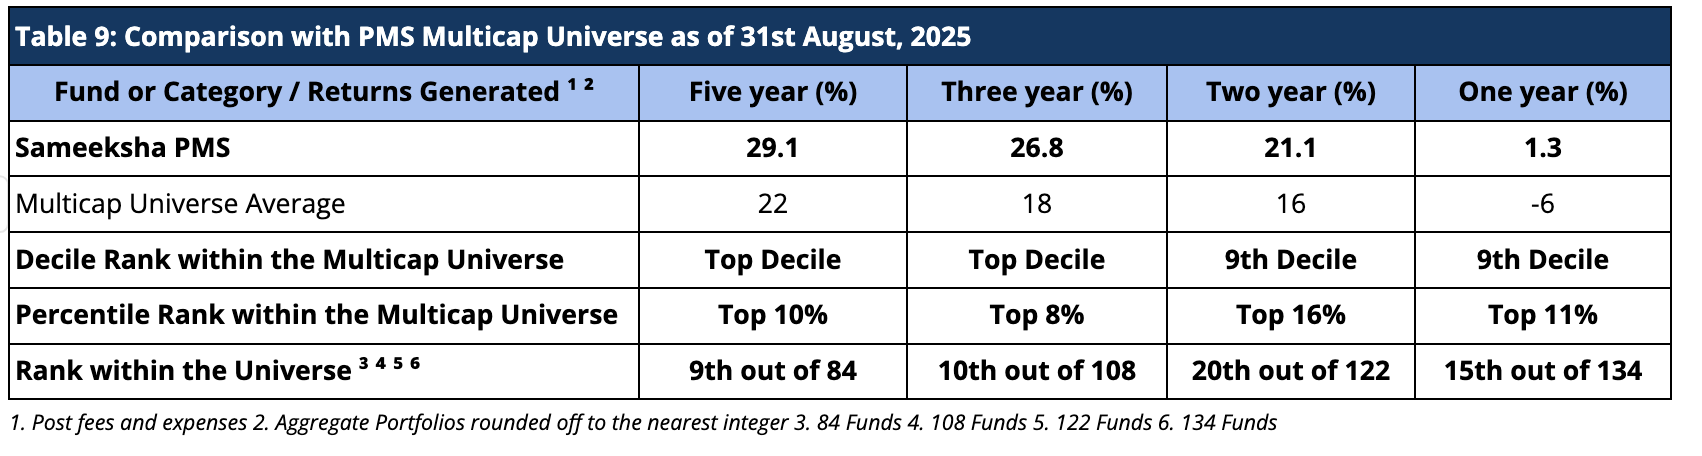
We also want to share our ranking among all Multicap PMSes having an AUM of more than or equal to INR 100 crs. Within this universe, we are ranked 9th out of 84 PMSes for the five-year period and 10th out of 108 PMSes for the three-year period (Table 9).
Performance Comparison with Select Mutual Funds Favored by Investors
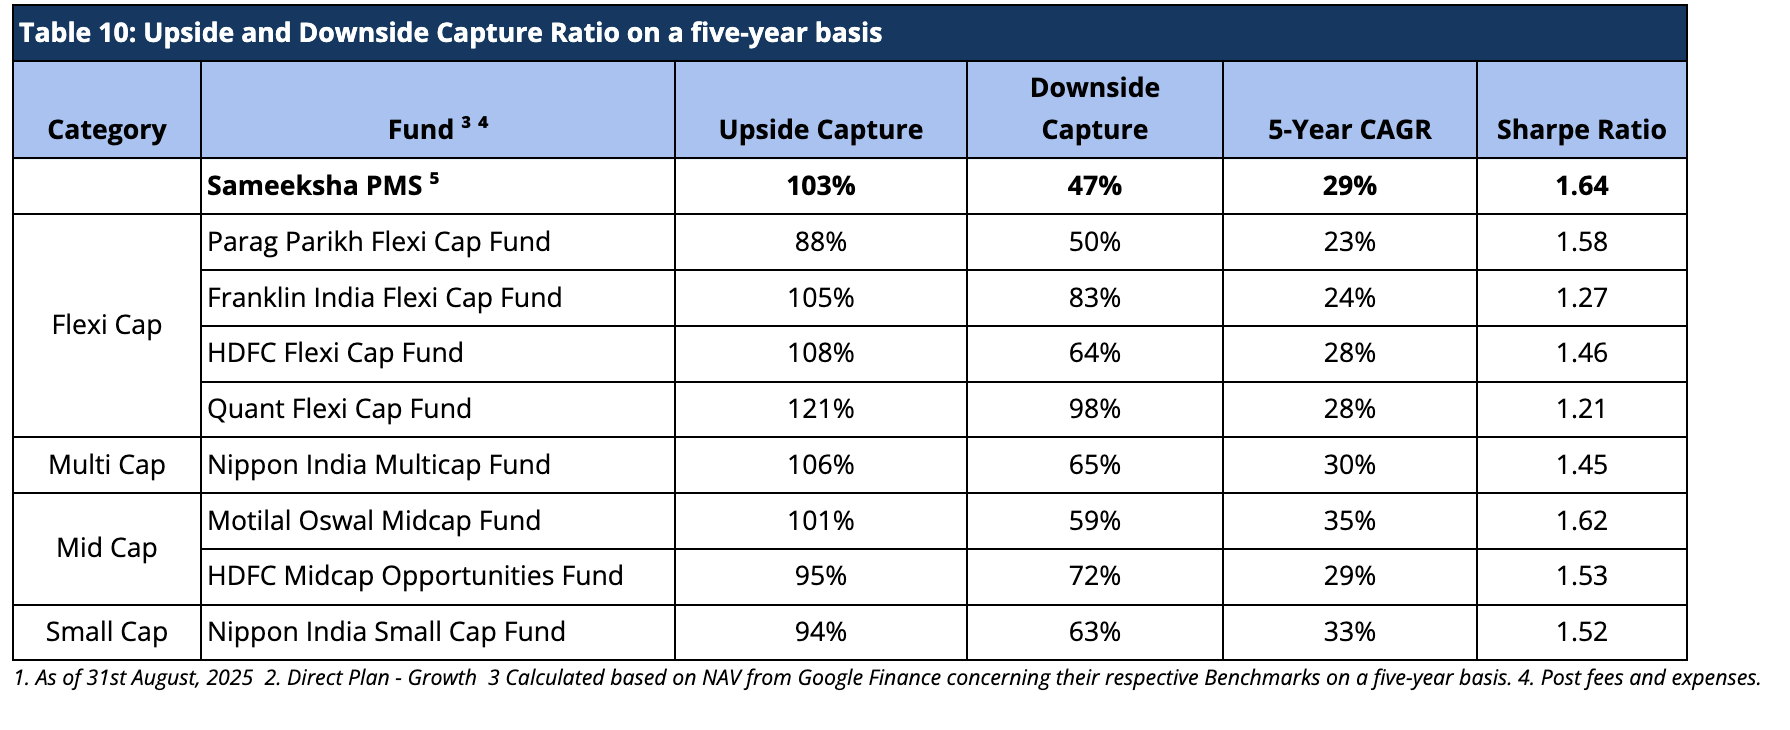
We compare our returns with a group of mutual funds favored by investors across various categories. This ensures that our performance assessment is both relevant and insightful, focusing on funds that align with investor preferences. We have achieved one of the lowest downside capture ratios compared to the mutual funds we analyze, reflecting our strong emphasis on risk management and minimizing losses during market downturns. Over a five-year period, we have delivered superior returns compared to these mutual funds, both in terms of CAGR as well as risk-adjusted returns, showcasing our ability to generate consistent and sustainable performance (Table 10).
Returns of Individual Portfolios
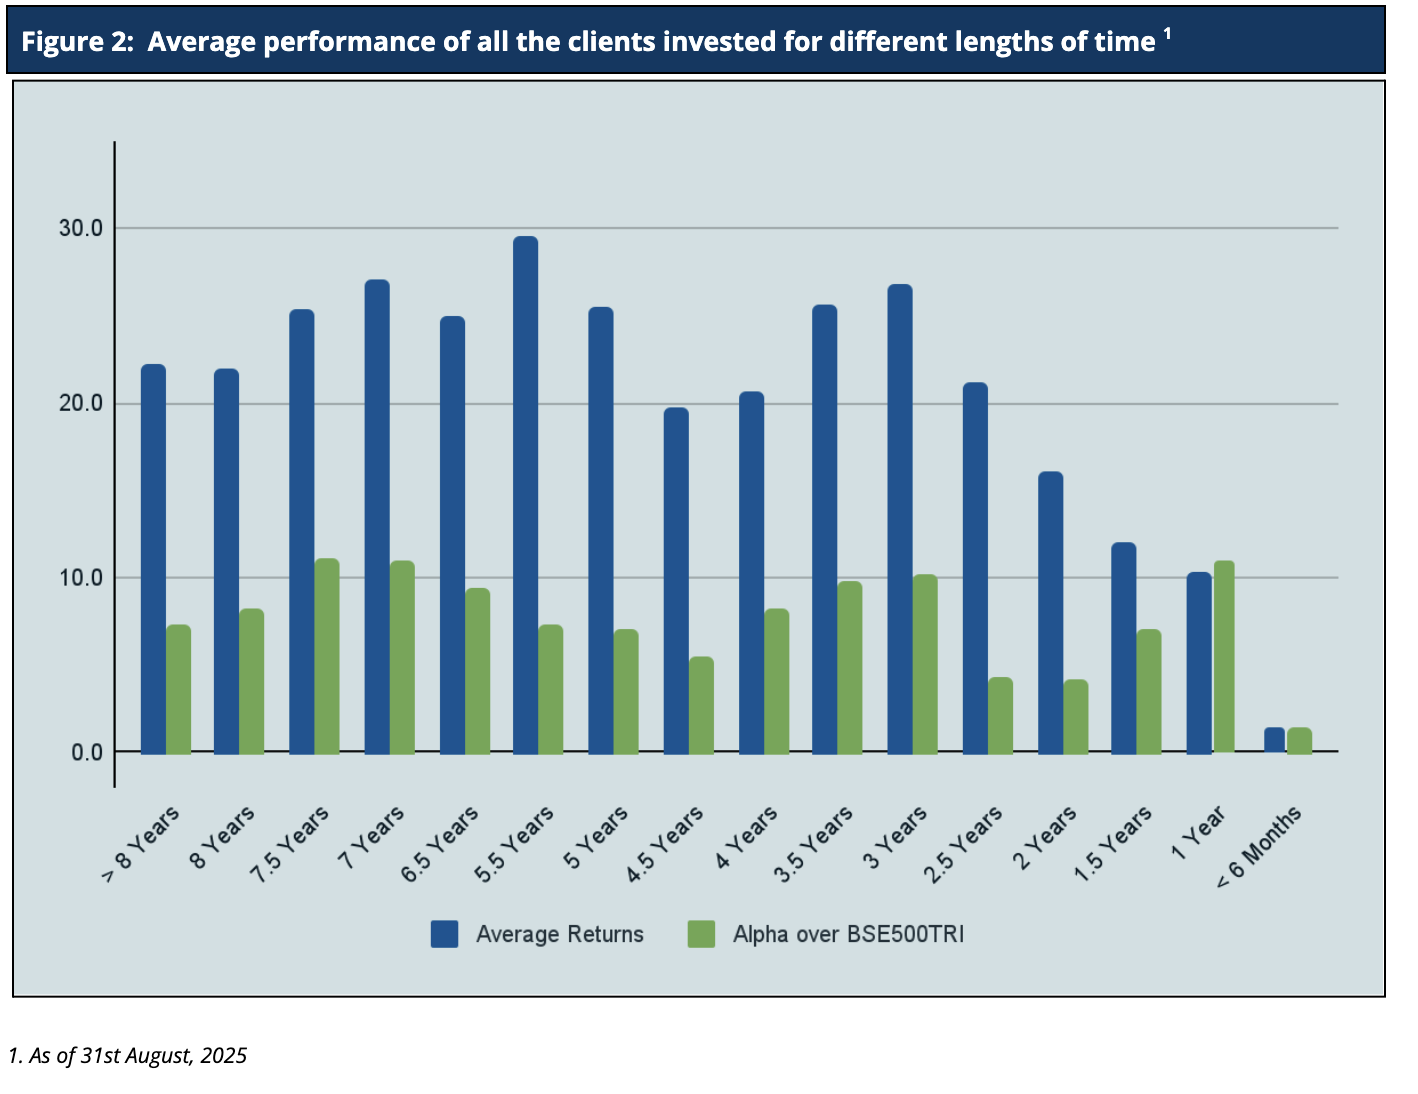
Because we don’t follow a model portfolio strategy, the performance of individual clients is far more important than overall portfolio aggregate returns (Figure 2). For investors who have been with us for five years or more, Sameeksha PMS has returned a very substantial alpha with an average annualized alpha of approx. 7% for the five years ending 31st August, 2025. Similarly, for investors who have been with us for three years or more, Sameeksha PMS has returned substantial alpha with an average annualized alpha of approx. 12% for the three years ending 31st August, 2025. The Figure below shows the average annualized returns and alpha over different periods of time of all the clients as on 31st August, 2025.
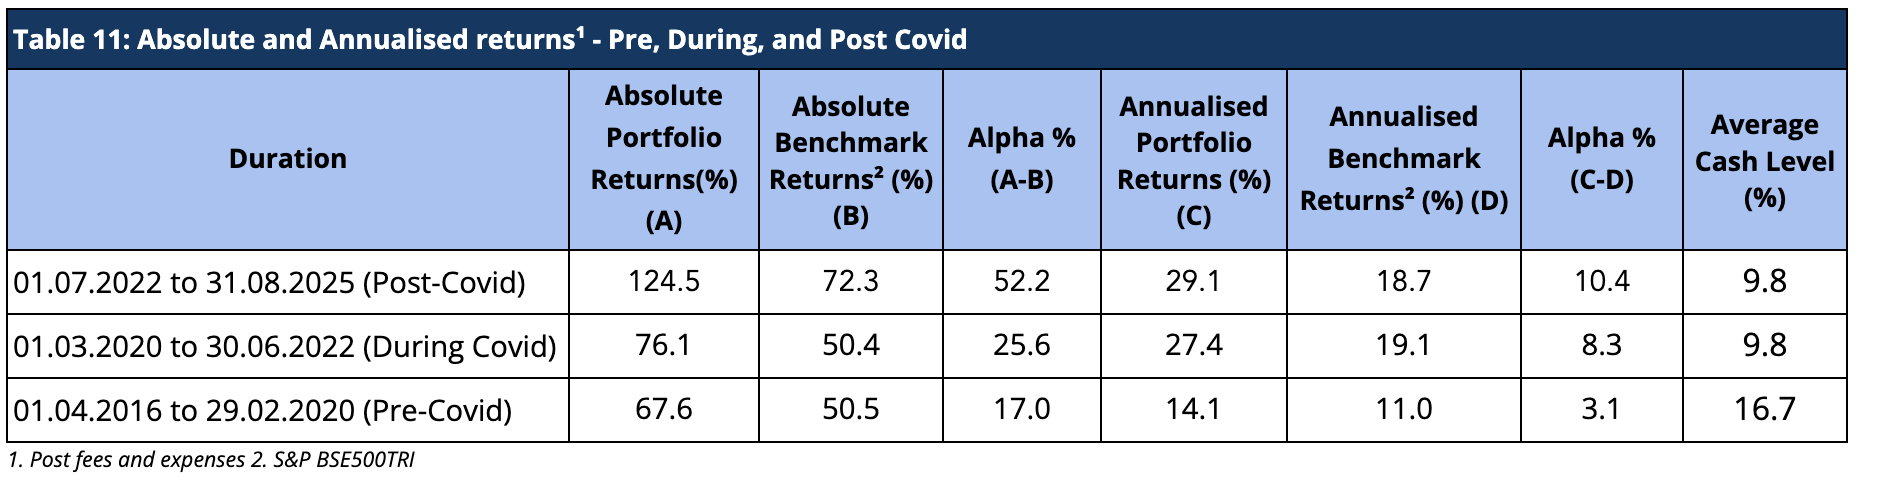
Performance Of PMS Over The Covid Timeline (Pre, During, And Post)
The COVID-19 pandemic induced significant volatility in the equity markets. Hence, it is useful to look at the performance across three time slices: Pre-COVID, During Covid, and Post-Covid. Sameeksha PMS has outperformed the benchmark across all three time periods with meaningful alpha (Table 11). This consistency of performance may be an important factor in comparing us with the other funds.
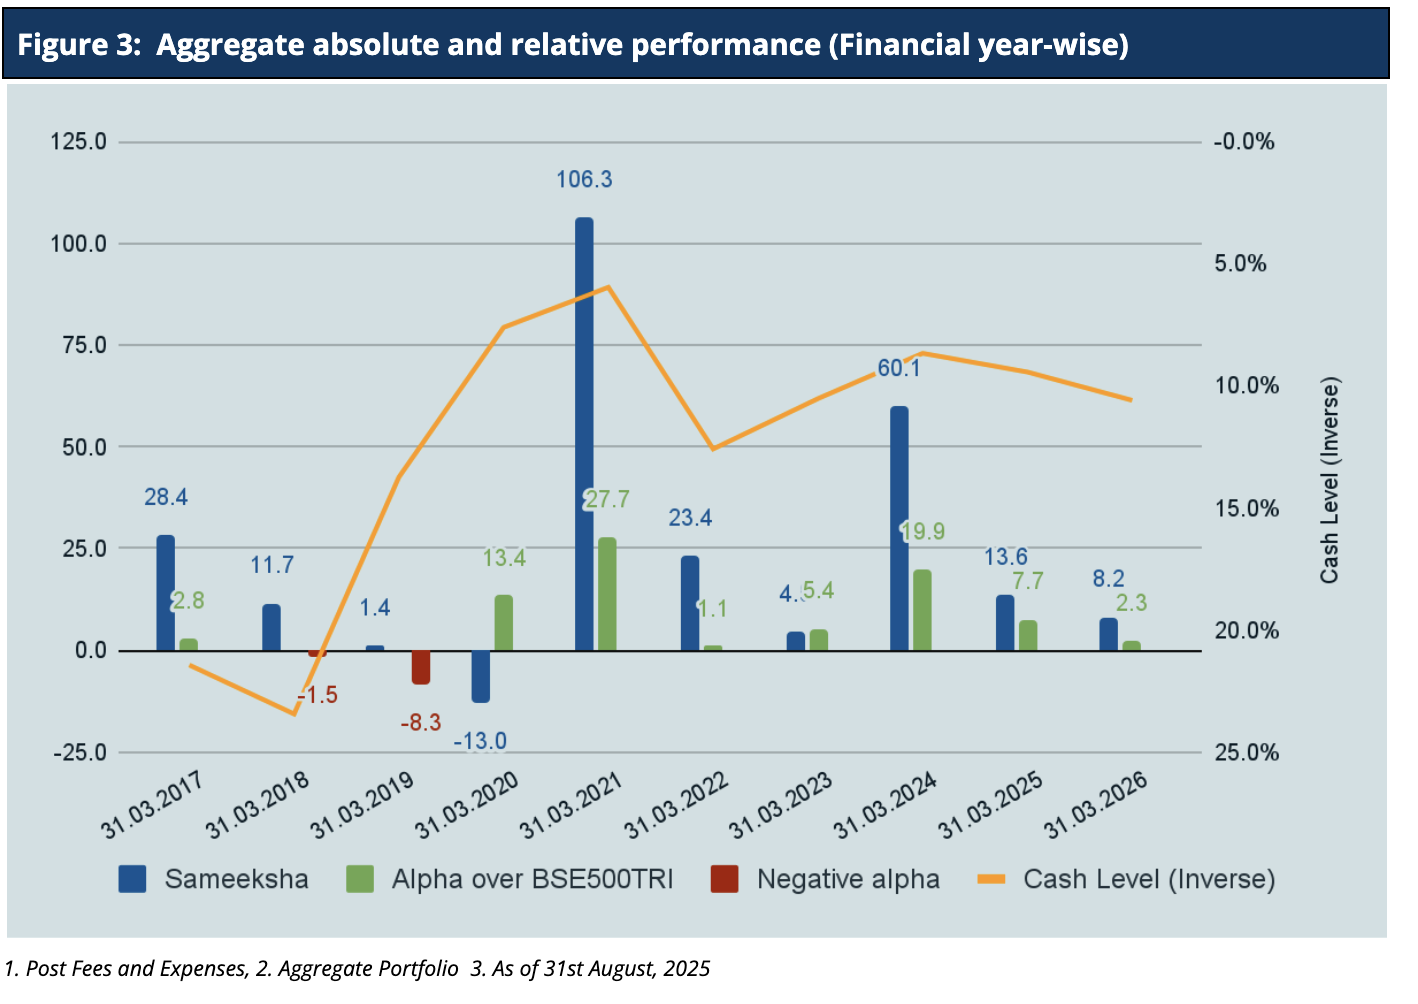
Aggregate Portfolio Performance on a financial year and calendar year basis
For August, Sameeksha PMS has slightly underperformed the benchmark BSE 500 TRI by 1.3%. For Financial Year 2025-26, we have outperformed BSE500 TRI by 2.3%. Looking at our performance over the financial years (Figure 3), we have outperformed our benchmark in eight out of ten financial years. Key however, is that the sum of outperformance of 80.4% in those eight years far exceeds the sum of underperformance of 9.8% in the remaining two years. We have successfully outperformed in the previous financial year, marking seven consecutive years of generating alpha including the incomplete FY 2026.
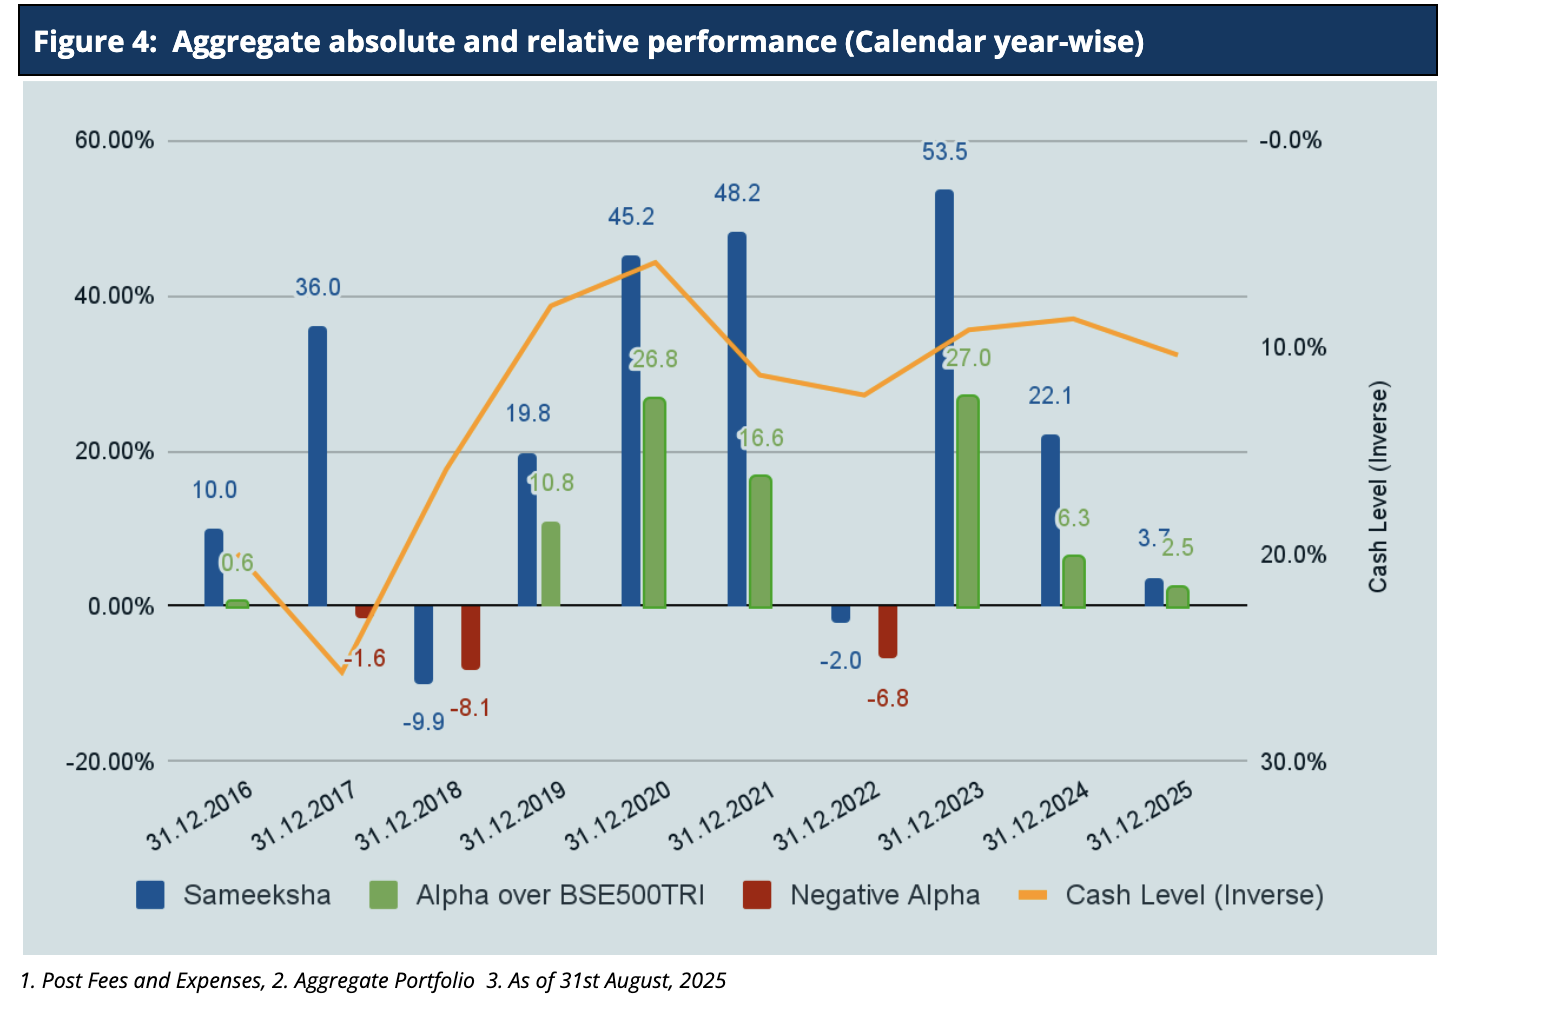
For the Calendar Year 2025, we have outperformed the benchmark BSE500 TRI by 2.5%. Looking at our performance over calendar years (Figure 4), we have outperformed the benchmark in seven out of ten calendar years, and the sum of outperformance of 90.7% in seven years far exceeds the sum of underperformance of 16.5% in the remaining three years.
It is important to note that we delivered this alpha despite maintaining an average cash level of 12.6% across the ten financial years.
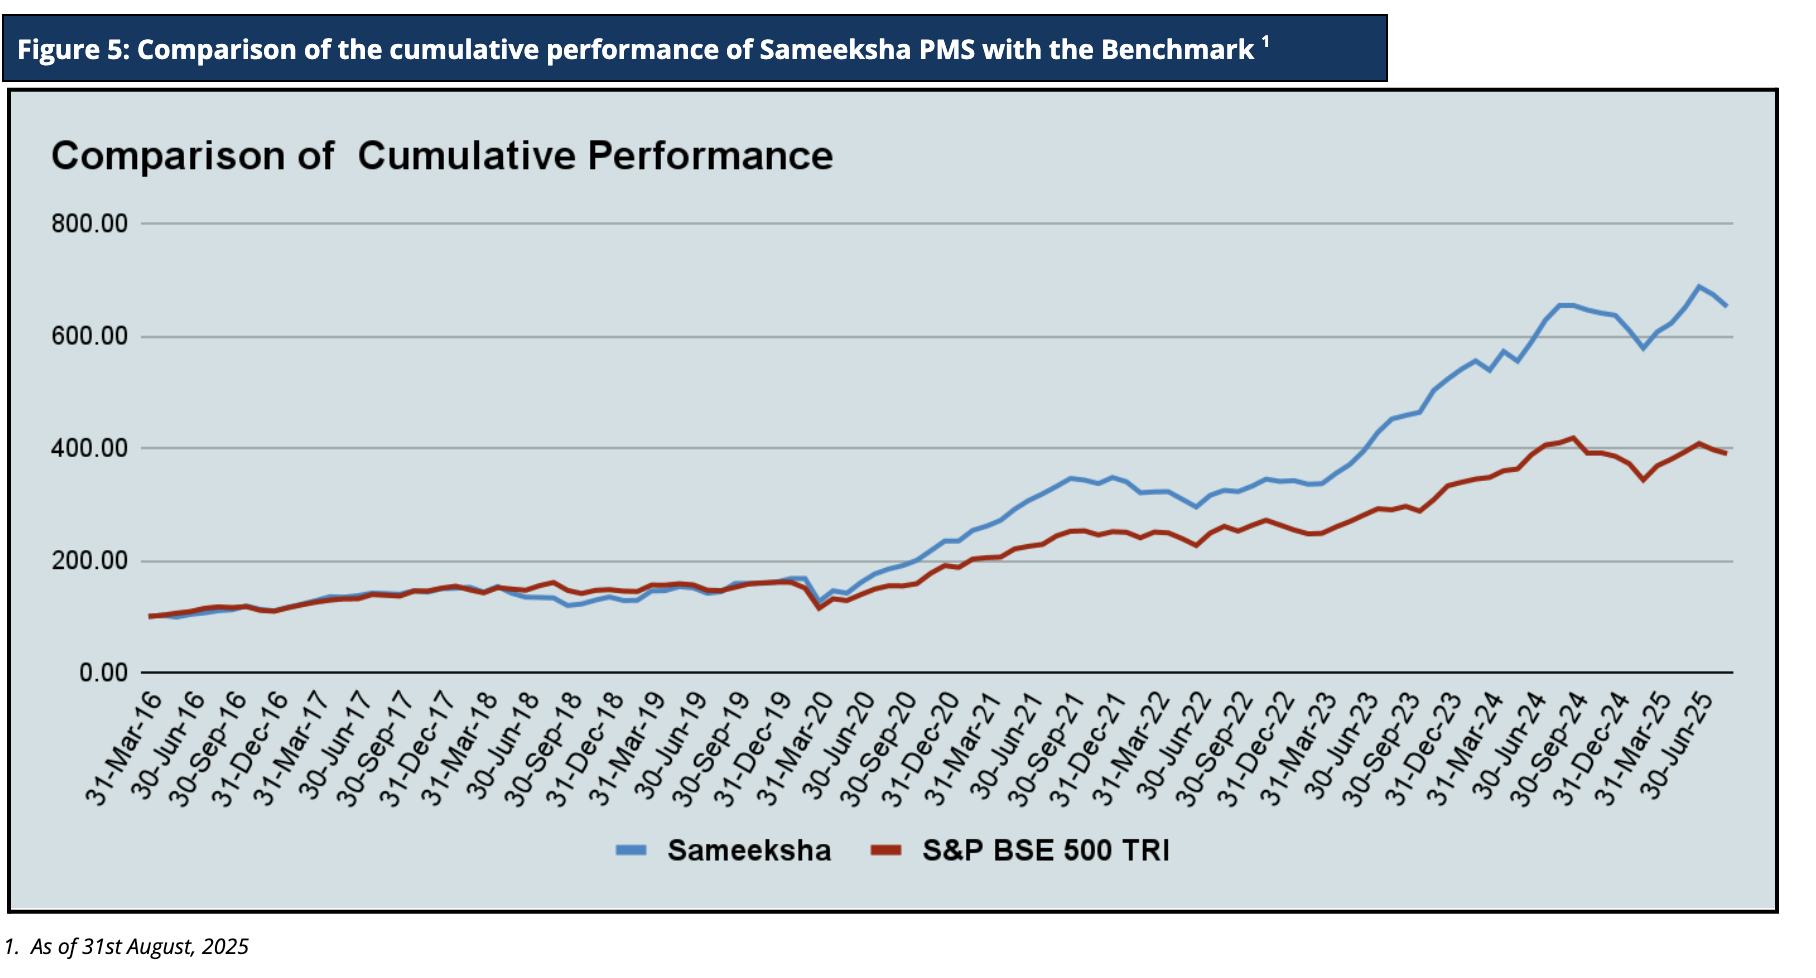
Cumulative Performance versus the benchmark
Sameeksha PMS’s outperformance over its benchmark has continued to widen positively over the years. An investment of Rs. 100 with us since inception (April 2016) would have grown to Rs. 652, far outpacing what one would have earned by investing in a fund that achieved benchmark returns (Figure 5).
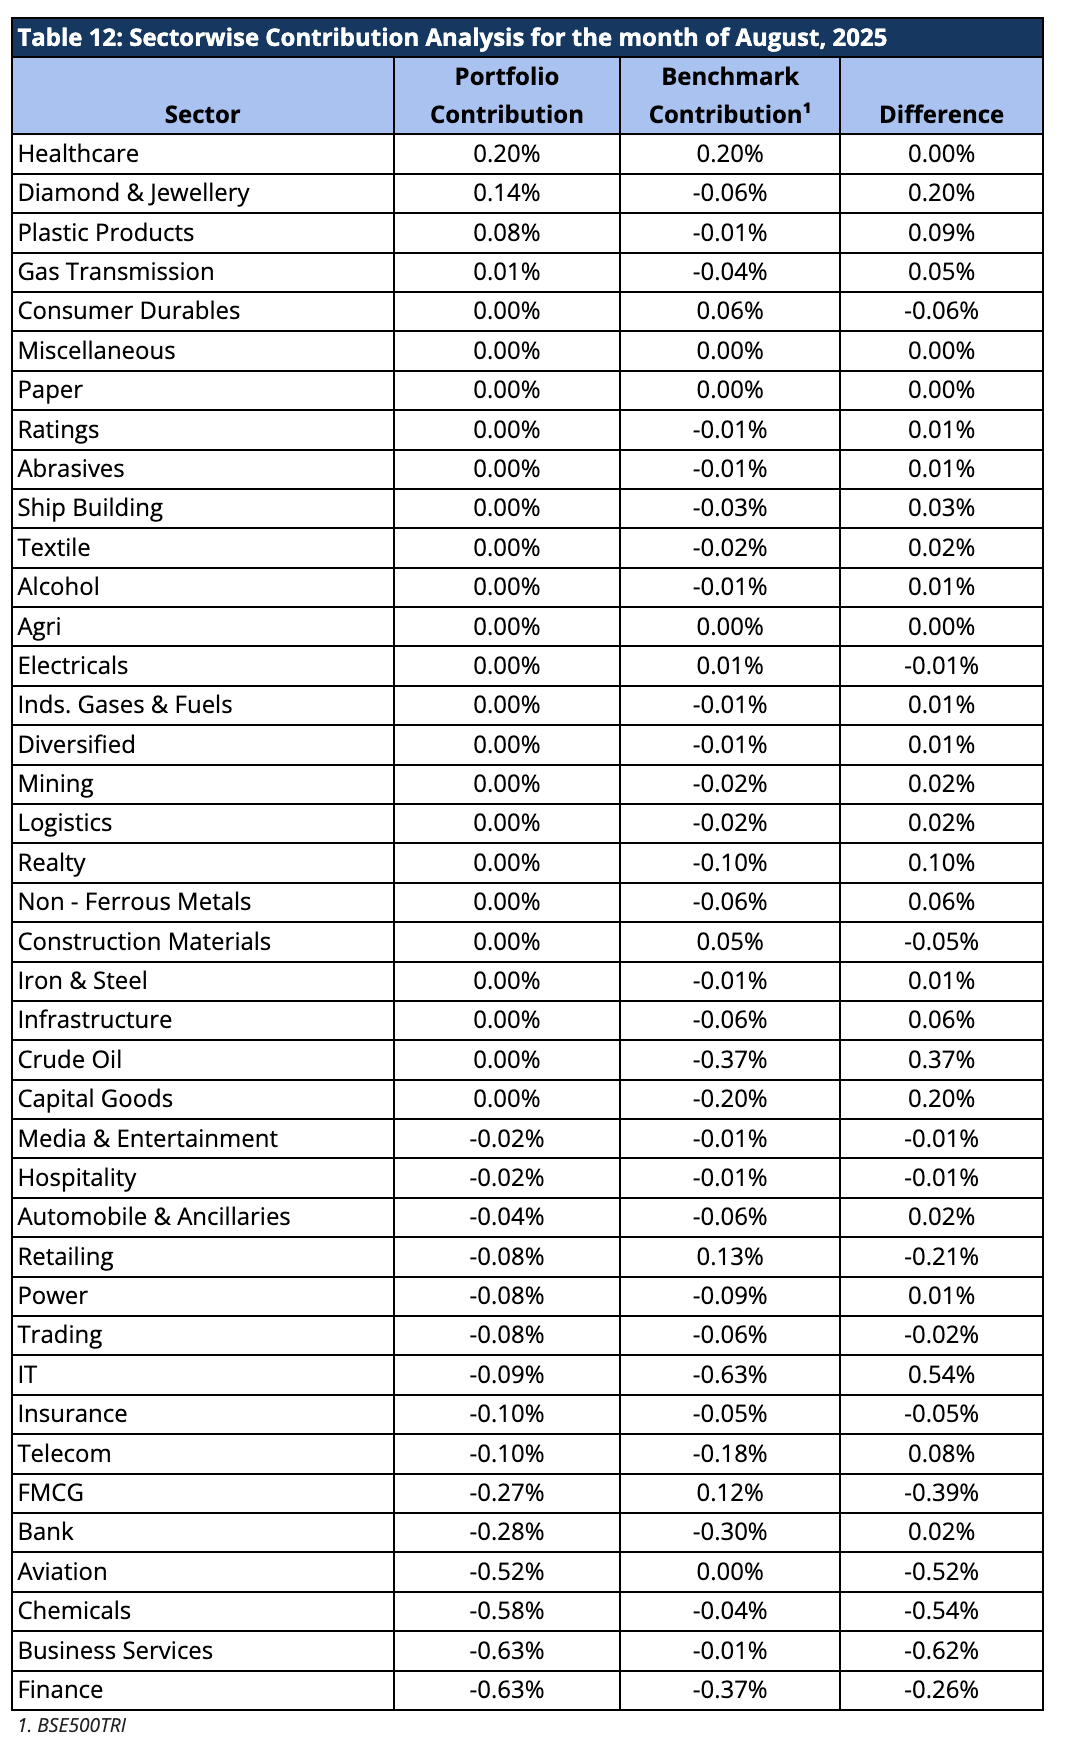
Analyzing the sector performance during the month
The portfolio underperformed the benchmark in August 2025. Positive contributions came primarily from Healthcare, Diamond & Jewellery, Plastic Products, and Gas Transmission, with additional support from sectors such as Realty, Non-Ferrous Metals, Infrastructure, Crude Oil, and Capital Goods relative to the benchmark. However, performance was dragged down by significant weakness in Business Services, Finance, and Chemicals, along with notable headwinds from Aviation, FMCG, and Banks. Retailing, Insurance, and Media & Entertainment also weighed on relative returns. Overall, while selective sector exposures added value, broad-based weakness across several key segments led to portfolio underperformance for the month.
Below is the contribution analysis for the month of August 2025 (Table 12).
AIF Performance and other details
Aggregate Fund Returns over various time periods
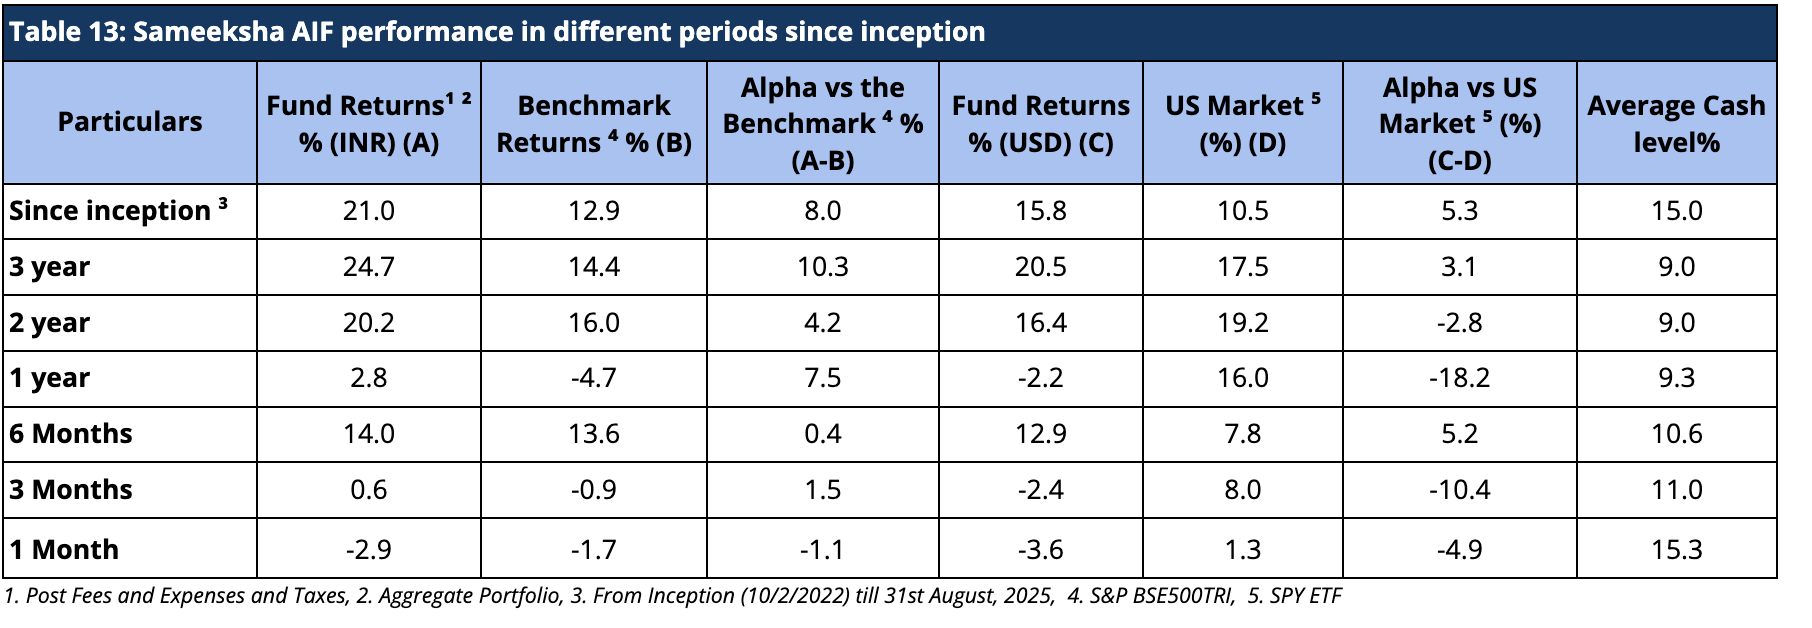
Since inception, we have maintained relatively higher levels of cash (15% on average over the entire period from inception) from time to time throughout the management of the fund. Notwithstanding the same, from inception, over three years and two years, we have generated returns of 21%, 24.7% and 20.2% in INR terms and 15.8%, 20.5% and 16.4% in USD terms, beating the benchmark BSE500 TRI returns and ETF tracking S&P 500 index, respectively, after fees and taxes. (Table 13).
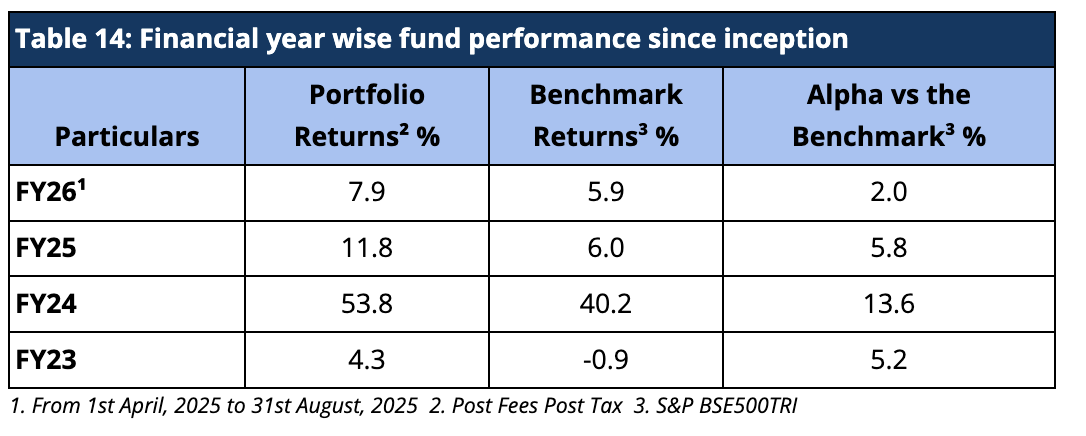
Aggregate Fund Performance on a Financial Year and Calendar Year basis
For FY26, Sameeksha AIF has outperformed the benchmark BSE 500 TRI by generating 7.9% returns against the benchmark BSE500TRI returns of 5.9%. Looking at our performance over the financial years (Table 14), we have outperformed our benchmark in FY 2023, FY 2024, and FY 2025, and we continue to outperform in the current incomplete FY 2026. For the Financial year 2026 to date, we have positioned ourselves by outperforming the benchmark BSE500 TRI by 2%.
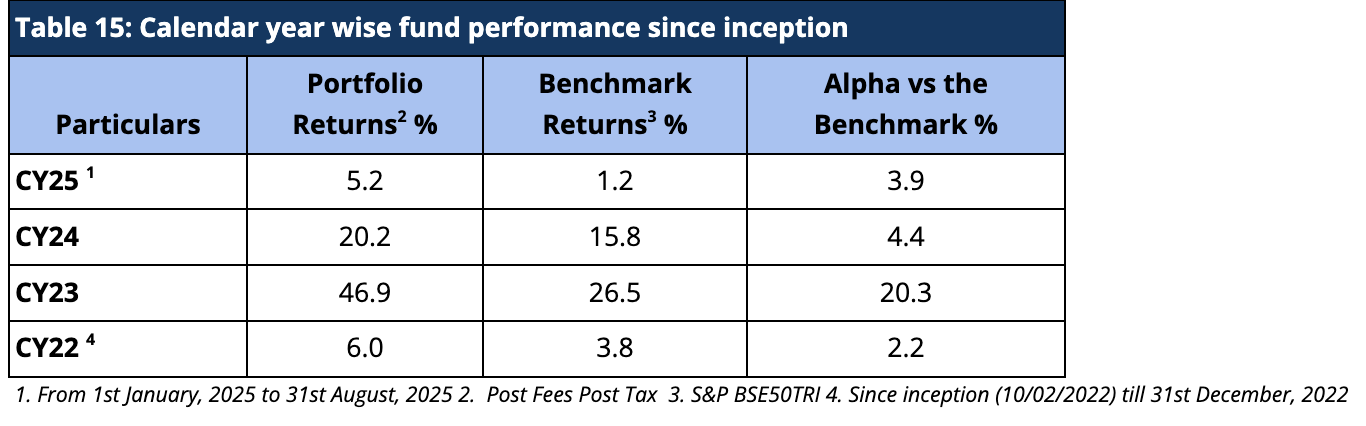
For the Calendar year 2025, we have outperformed the benchmark BSE 500 TRI by 3.9%. Despite being a new fund, we were still able to produce alpha for calendar years 2022, 2023, and 2024 and outperformed the benchmark BSE500 TRI by 2.2%, 20.3% and 4.4% respectively. (Table 15)
Risk Adjusted Ratios
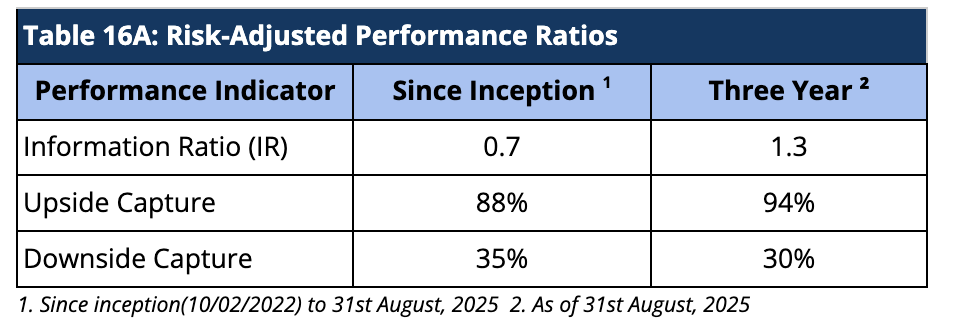
When compared on a risk-adjusted basis, our AIF has shown an even stronger performance. The Information Ratio (IR) measures the excess return of a portfolio over a benchmark per unit of active risk. A higher Information Ratio (IR) suggests better risk-adjusted performance.
Moreover, Upside Capture measures how well a fund performs as compared to a benchmark when the benchmark has positive returns. A higher upside capture ratio (> 100%) indicates that the fund captures more of the benchmark’s positive movements. Whereas, Downside Capture measures how well a fund performs compared to a benchmark when the benchmark has negative returns. A lower downside capture ratio (< 100%) indicates that the fund preserves capital better during market downturns. (Table 16A)
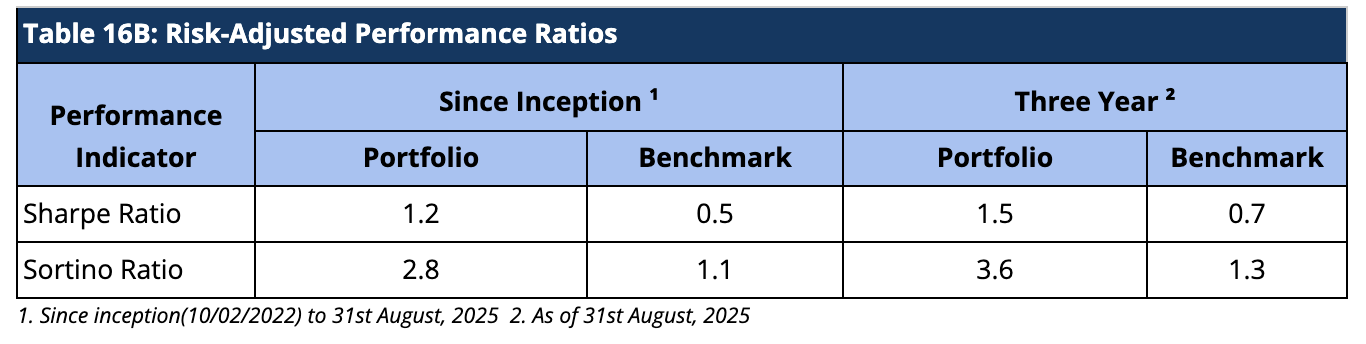
Furthermore, other risk-adjusted returns – Sharpe ratio is also significantly higher. The Sortino ratio measures the risk-adjusted return of an investment, focusing only on the downside risk. A higher Sortino ratio indicates better risk-adjusted returns, particularly concerning downside risk. (Table 16B).
Performance within the AIF Universe
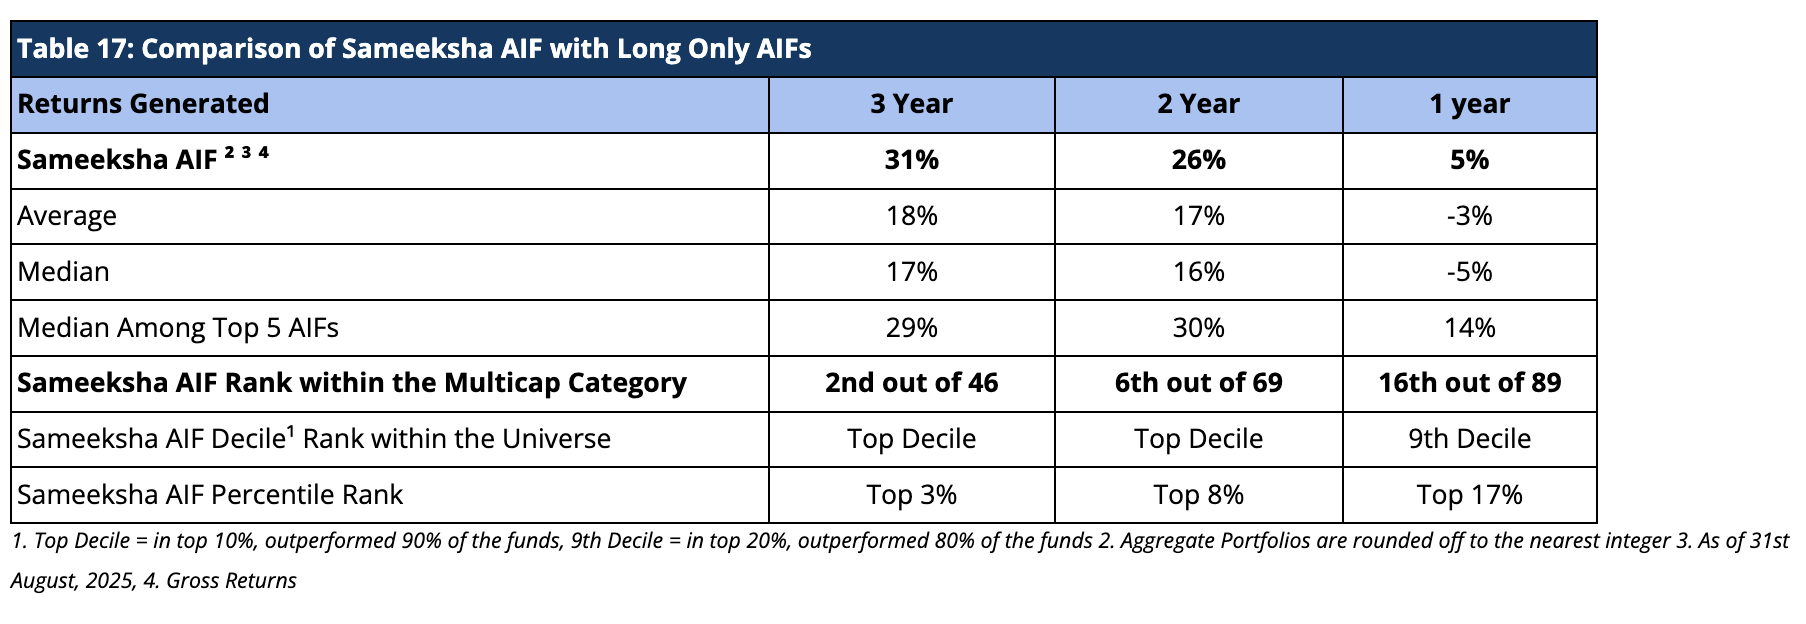
We present our rankings among Long Only Category III AIFs. For the period ending 31st August, 2025, we are ranked 2nd out of 46 AIFs for the three-year period, 6th out of 69 AIFs for the two-year period, and 16th out of 89 AIFs for the one-year period (Table 17). Sameeksha has been Top Decile consistently in the last three years. Because there is a lot of divergence in the way funds report their returns (post-exp & tax; post-exp, pre-tax; gross returns, and post-exp & tax pre-perf. fees &), we are doing a comparison on gross return basis to cover the entire applicable universe of funds.
Cumulative Performance versus the benchmark
Sameeksha AIF’s outperformance over its benchmark has continued to widen positively since inception. An investment of Rs. 100 with us since inception (Feb 10, 2022) would have grown to Rs. 197, far outpacing what one would have earned by investing in a fund that achieved benchmark returns (Figure 6).

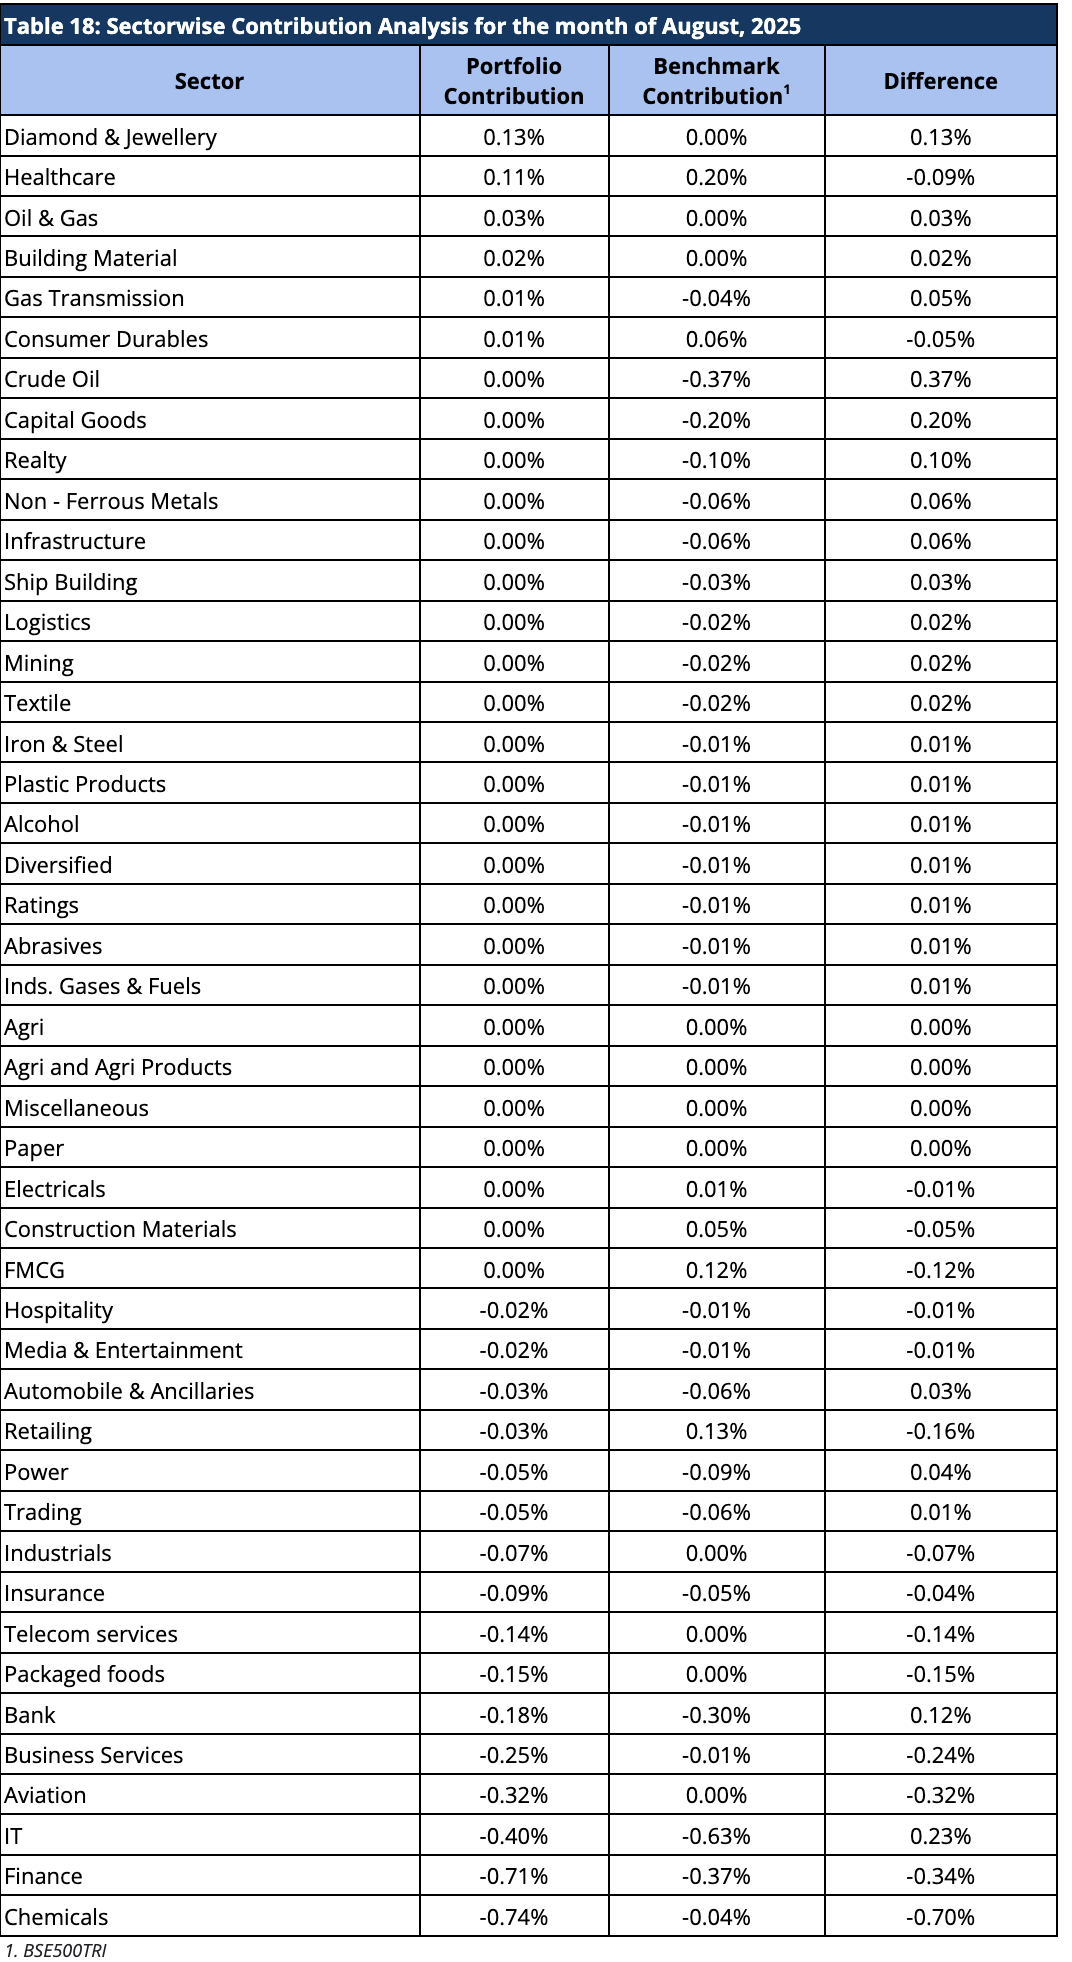
Analyzing the sector performance during the month
Sameeksha AIF underperformed the benchmark in August 2025, primarily due to sharp negative contributions from Finance, Chemicals, Aviation, Business Services, and IT. Consumer-facing segments such as Retailing, Packaged Foods, and FMCG also weighed on relative performance. Offsetting these headwinds, meaningful positive contributions came from Diamond & Jewellery and Healthcare added marginal support. The portfolio’s positioning across cyclical sectors such as Oil & Gas, Building Material and Gas Transmission further cushioned downside. Overall, while select sectoral drags drove underperformance during the month, the portfolio maintained a balanced allocation strategy with risk-managed exposures across defensive and cyclical areas. (Table 18)
Disclaimer – The information contained in this update is provided by our fund accounting platform and is not audited. This document is for informational purposes only and is not intended for solicitation to residents of the United States or any other jurisdiction that would subject Sameeksha Capital or its affiliates to any registration requirement within such jurisdiction or country. It does not constitute an offer to buy or sell securities or financial instruments. Recipients are advised to conduct their own research and seek professional advice before making any investment decisions.