As Sameeksha has completed nine years of operating the PMS, it is worth reviewing eight key aspects of our performance.
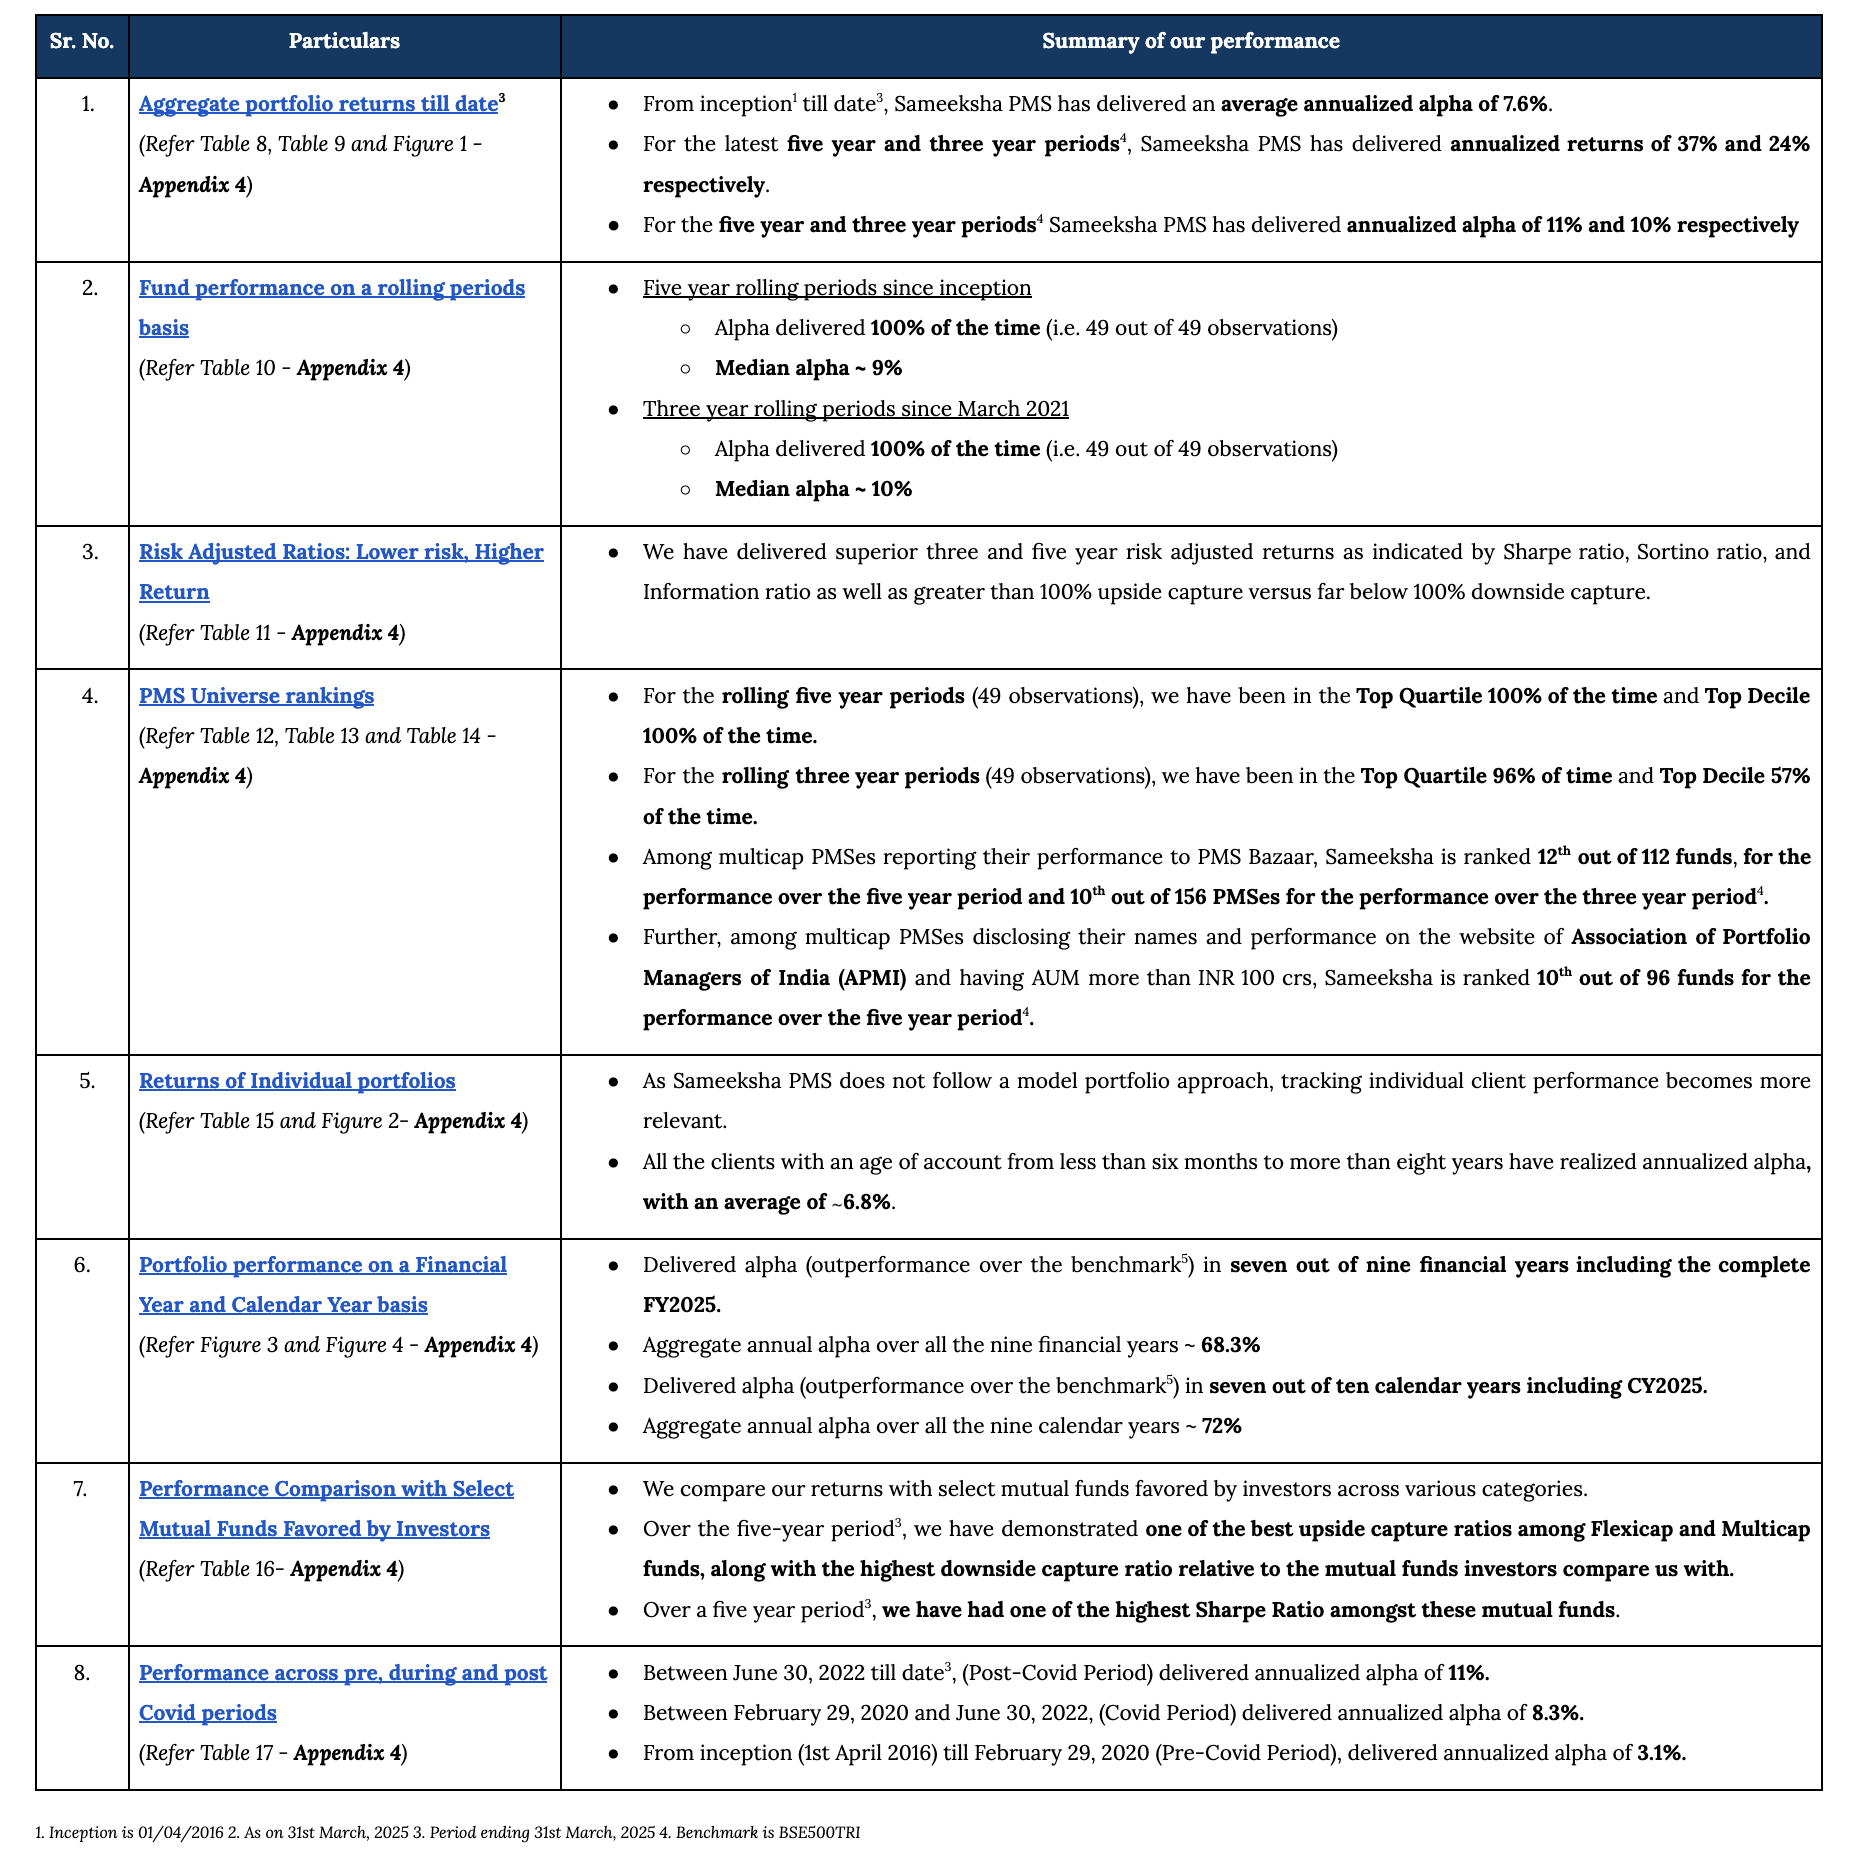
Aggregate Portfolio Returns over various time periods
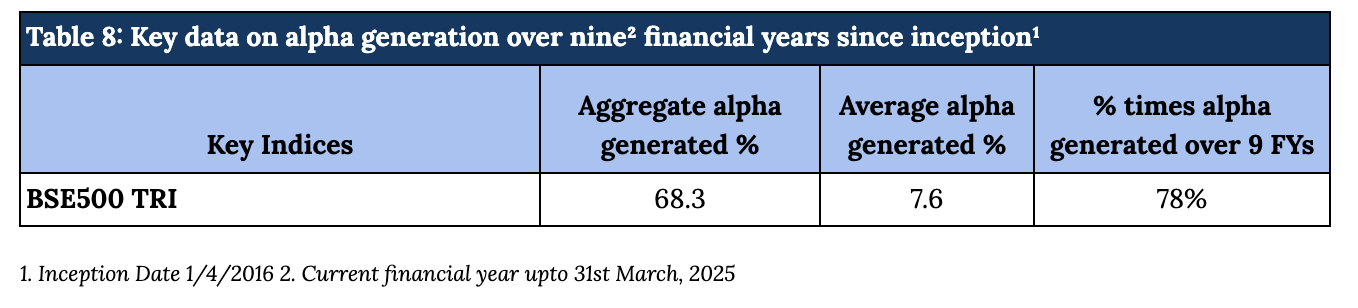
Sameeksha PMS has delivered a substantial aggregate annual alpha of 68.3% over BSE500 TRI over the nine financial years implying an average annual alpha of 7.6% since inception (Table 8).
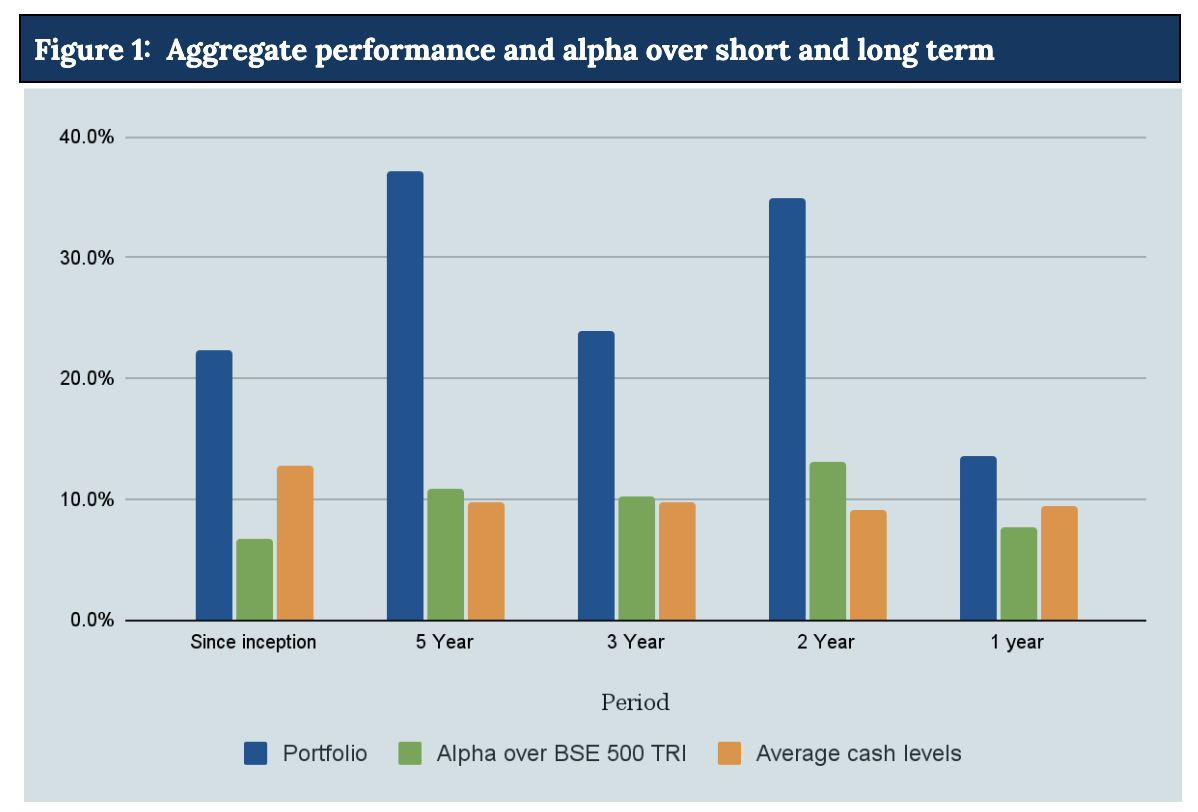
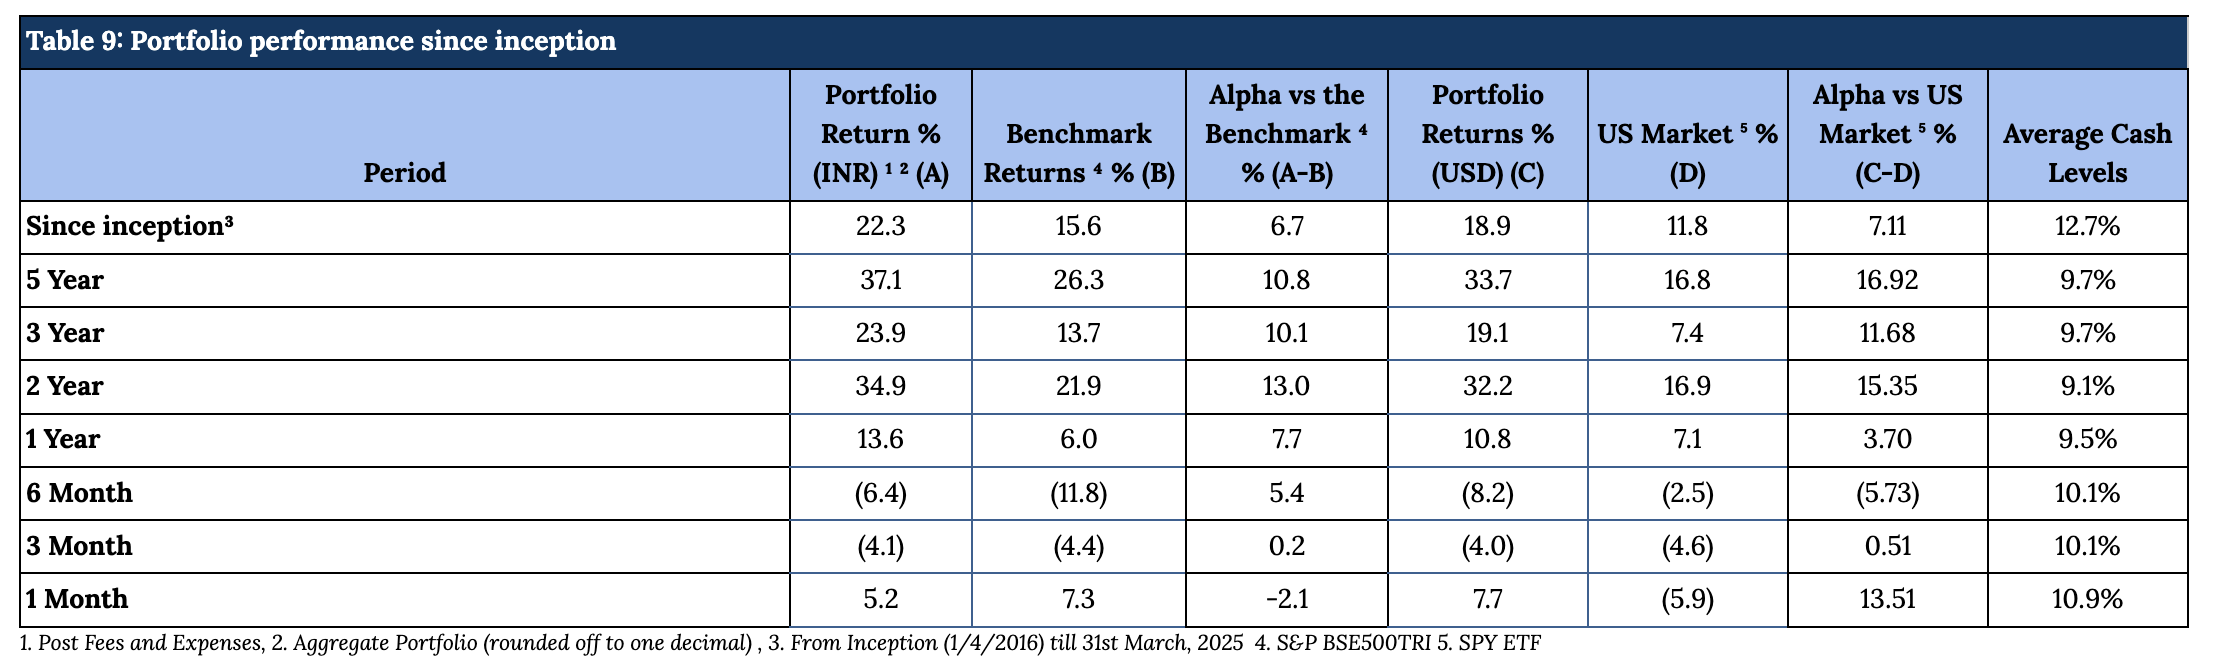
It is important to note that we have maintained relatively higher levels of cash (13% on average over the entire period from inception) from time to time over the duration of managing the portfolio. Notwithstanding the same, from inception, over five years and over three years respectively, we have generated returns of 22.3%, 37.1% and 23.9% in INR terms and 18.9%, 33.7% and 19.1% in USD terms thus generating substantial alpha over the Indian benchmark BSE500 TRI returns and SPY ETF (ETF tracking US S&P 500 index), respectively. Also, we have delivered strong returns relative to benchmark across various key time periods (Table 9 and Figure 1).
Aggregate Portfolio Performance and ranking on a rolling periods basis
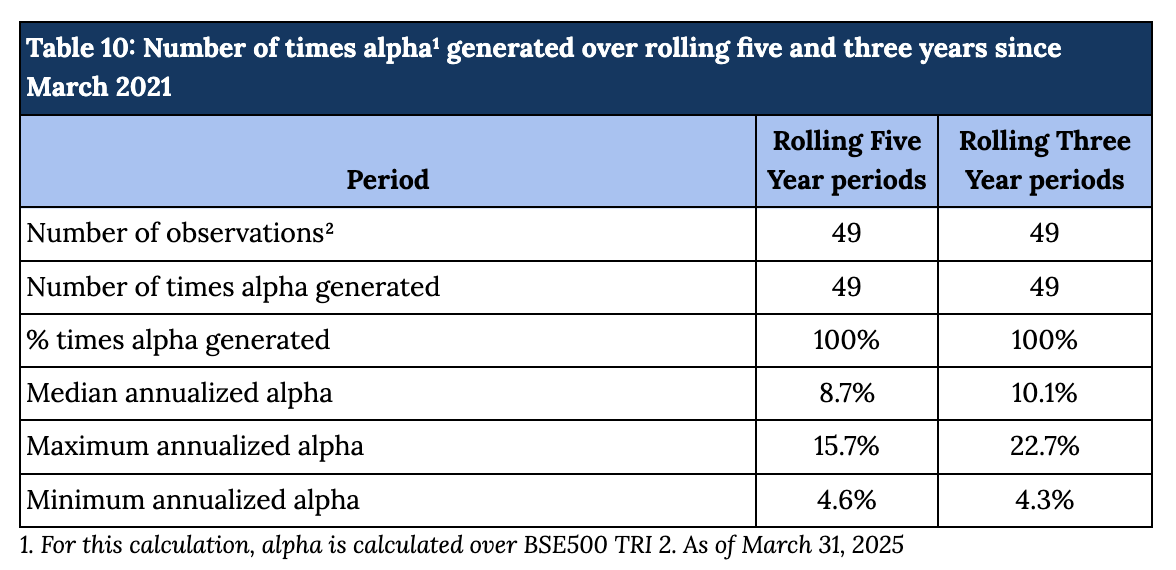
Rolling returns are a more useful indicator of consistency in performance versus single period returns. For the rolling five year periods applicable from March 2021 till date, Sameeksha PMS has delivered aggregate annualized alpha ranging from 5% to 16%, 100% of the time (49 out of 49 observations). For the rolling three year periods applicable from March 2021 till date, Sameeksha PMS has delivered aggregate annualized alpha 100% of the time (49 out of 49 observations) ranging from 4% to 23% (Table 10).
Risk Adjusted Ratios: Not all returns are the same, Higher Returns at lower Risk
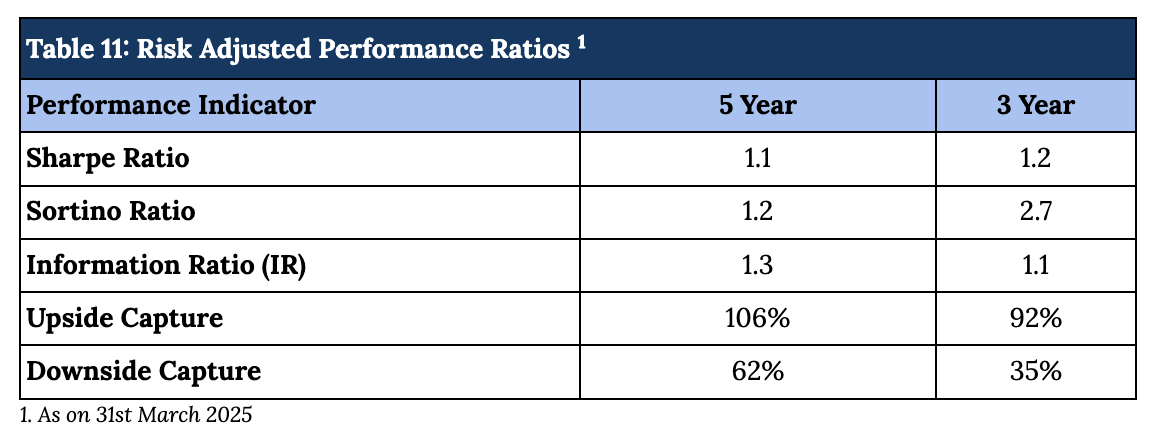
When compared on a risk adjusted basis, our PMS has shown an even stronger performance. The Information Ratio (IR) measures the excess return of a portfolio over a benchmark per unit of active risk. A higher Information Ratio (IR) suggests better risk-adjusted performance. The Sortino ratio measures the risk-adjusted return of an investment, focusing only on the downside risk. A higher Sortino ratio indicates better risk-adjusted returns, particularly with respect to downside risk.
Moreover, Upside Capture measures how well a fund performs as compared to a benchmark when the benchmark has positive returns. A higher upside capture ratio (> 100%) indicates that the fund captures more of the benchmark’s positive movements. Whereas, Downside Capture measures how well a fund performs compared to a benchmark when the benchmark has negative returns. A lower downside capture ratio (< 100%) indicates that the fund preserves capital better during market downturns. Furthermore, other risk-adjusted returns (Table 11).
Performance within the PMS Universe
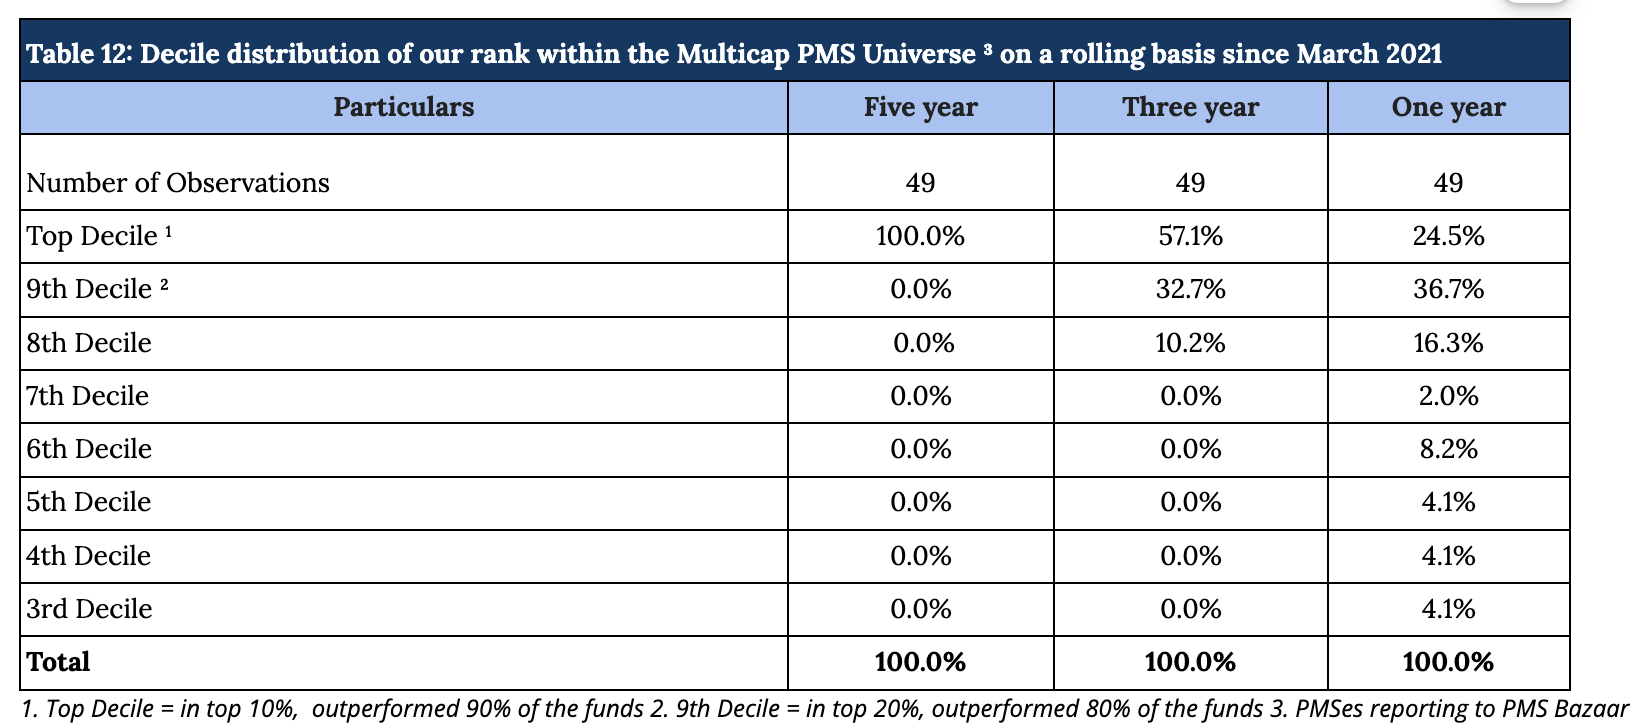
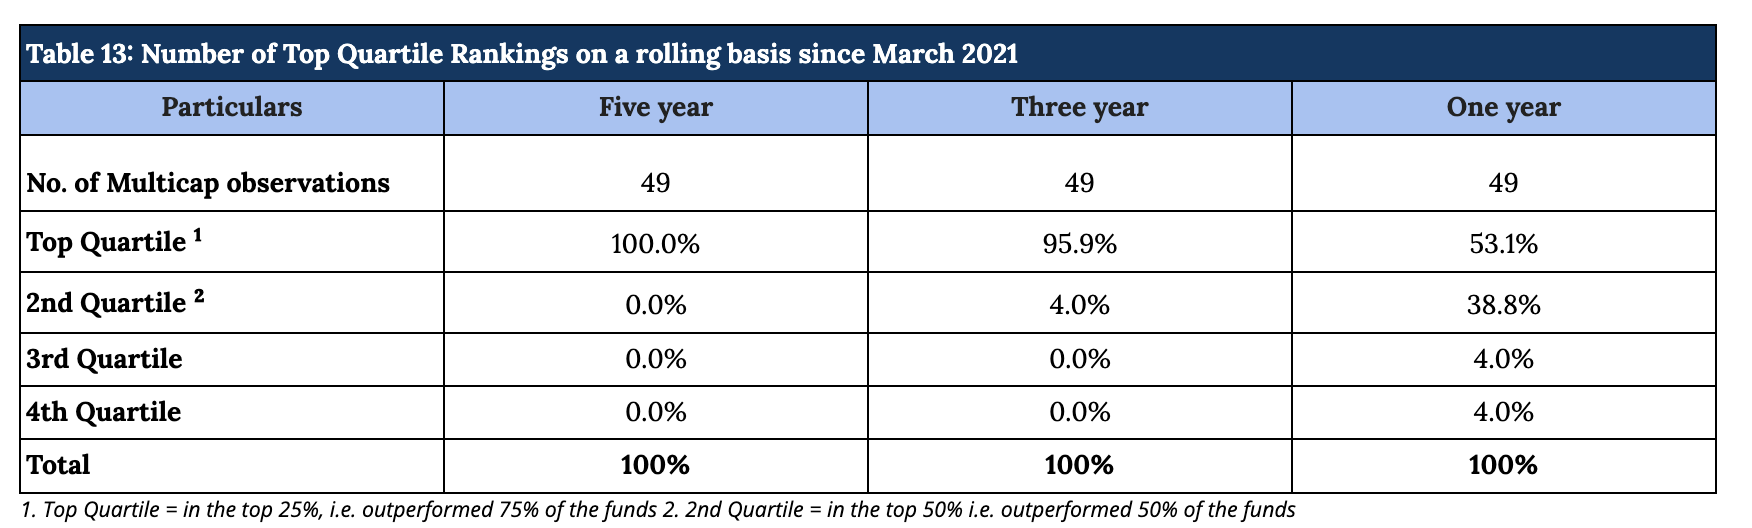
We continue to maintain our top rankings both within the multicap PMS universe as well as the entire PMS universe for key periods of three and five years. The multicap PMS universe rankings are more relevant to us since we follow the multicap strategy.
For rolling three year periods applicable since March 2021, we have been ranked among the multicap universe in the Top Decile 57.1% of the time (28 out of 49 observations) and in the Top Quartile 95.9% of the time (47 out of 49 observations). For rolling five-year periods applicable to our entire operating history, we have been ranked among the multicap universe in the Top Quartile 100% (49 out of 49 observations) and Top Decile 100% of the time (49 out of 49 observations). (Tables 12 and 13)
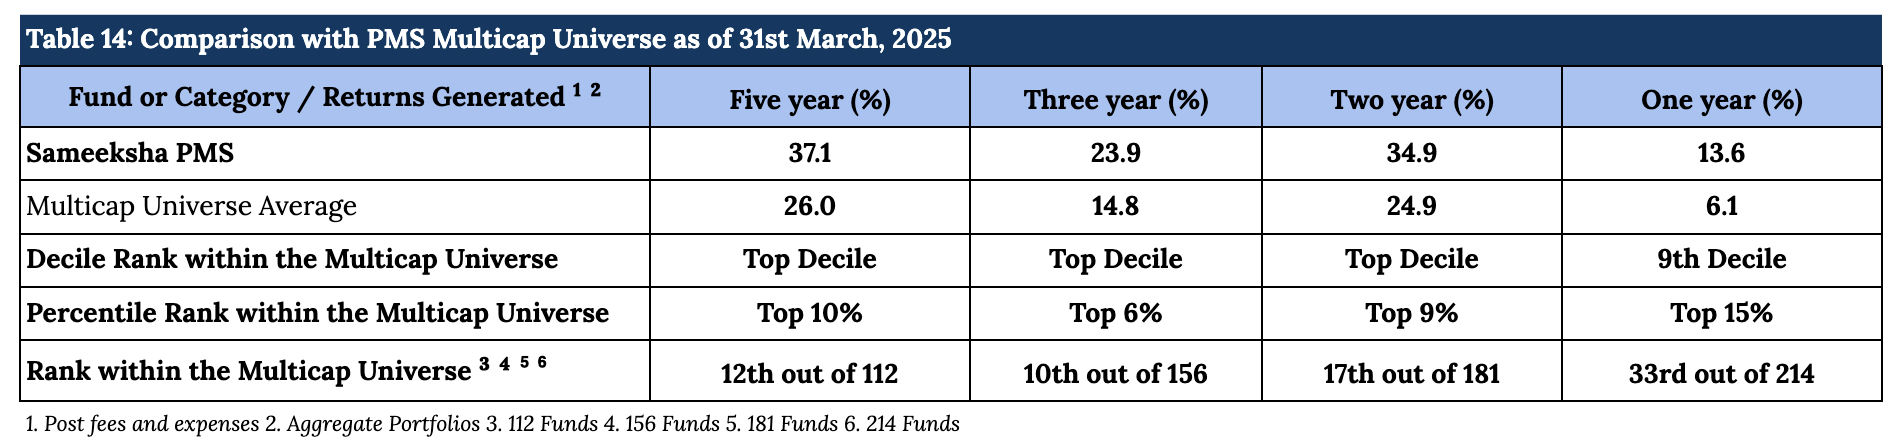
We present our rankings among those multicap PMSes across all AUM sizes. Within this universe, we are 12th out of 112 PMSes for the five year period and 10th out of 156 PMSes for three year period, highlighting our superior performance over the long term periods (Table 14). Among the multicap universe across all AUM sizes, we are consistently ranked in the Top Decile for the five year period for 49 out of 49 observations reflecting well on the consistency of our performance.
Returns of Individual Portfolios
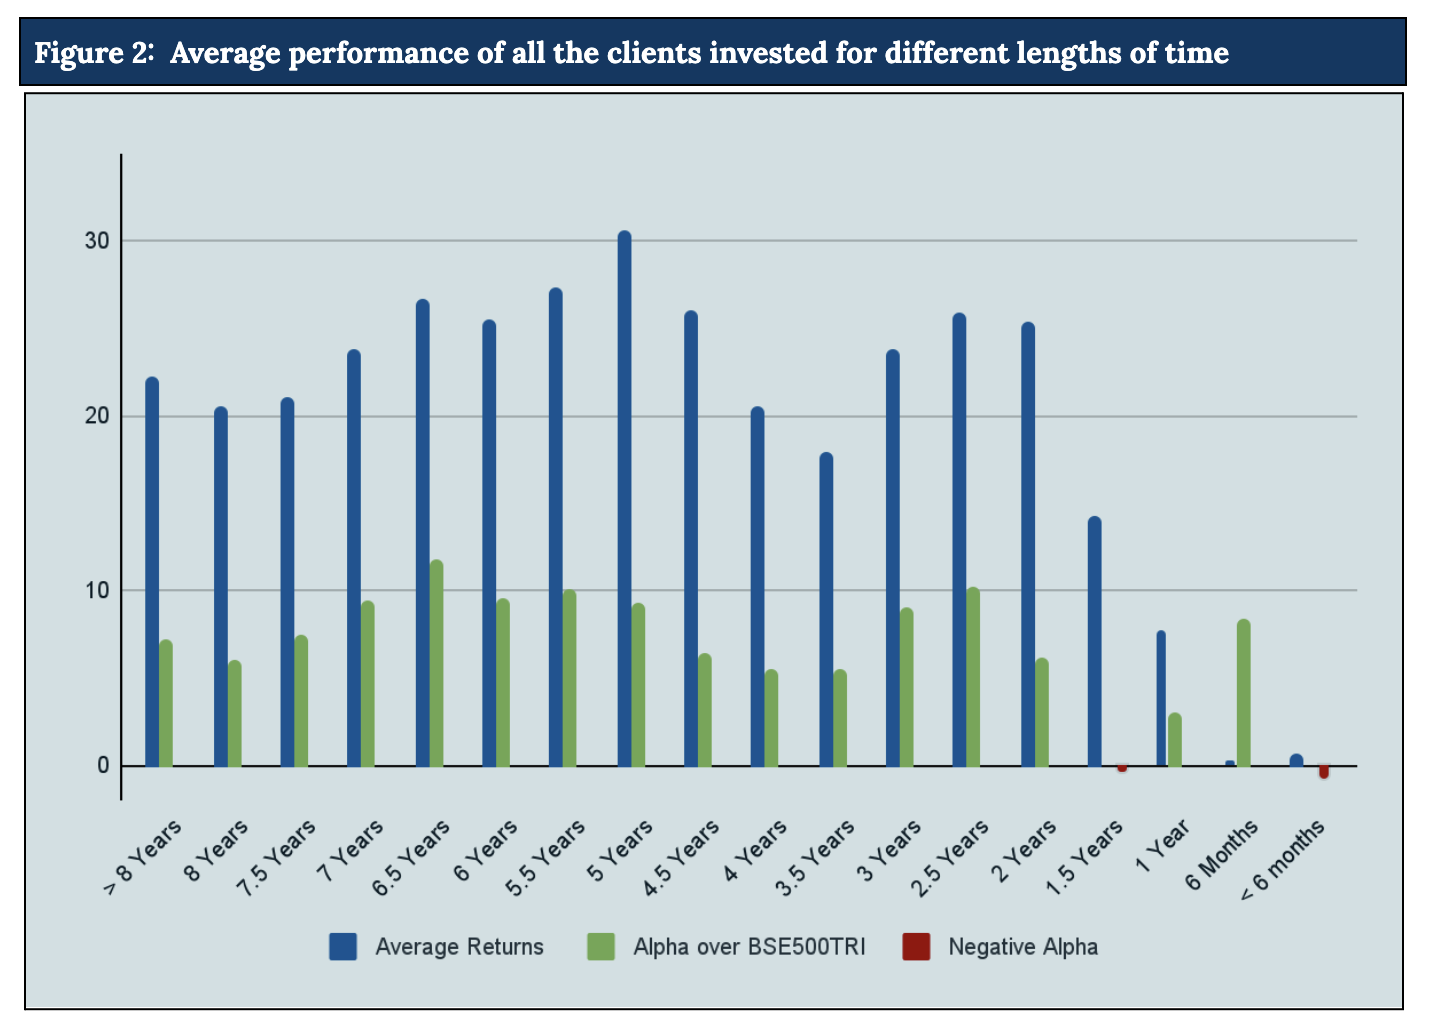
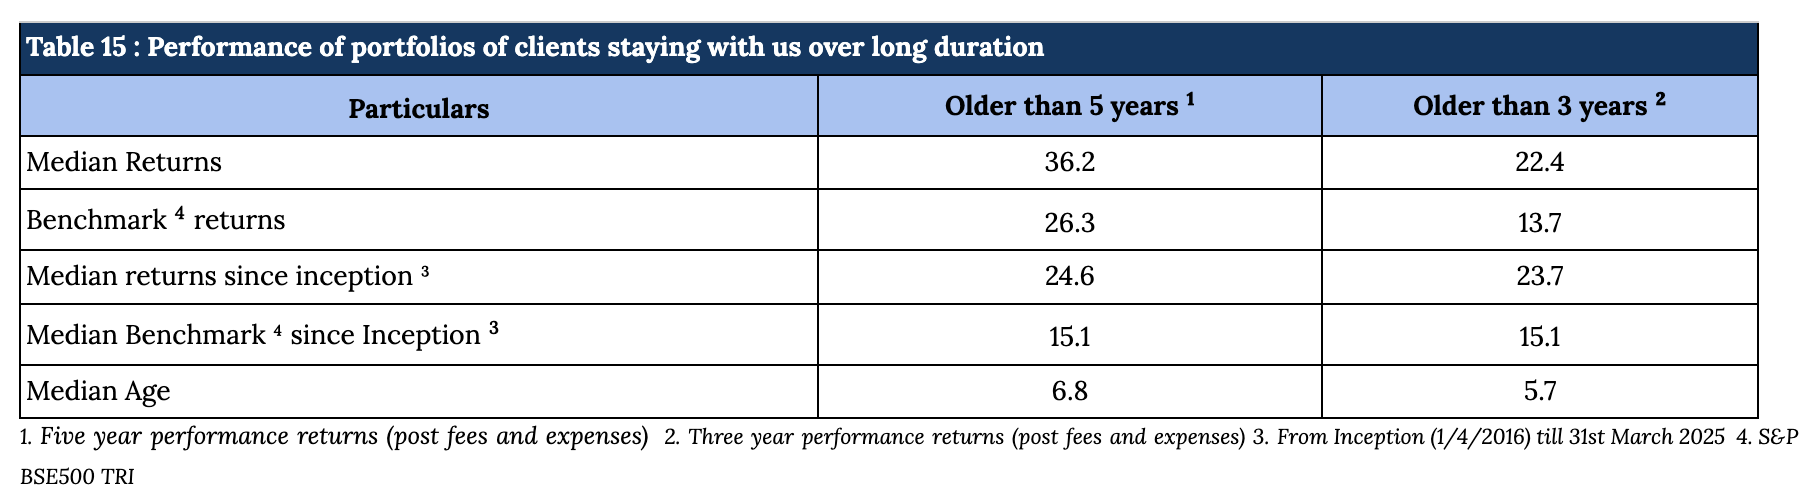
Because we don’t follow model portfolio strategy, the performance of individual clients is far more important than overall portfolio aggregate returns (Table 15 and Figure 2). For investors who are with us for three years and more, Sameeksha PMS has returned a very substantial alpha with an average annualized alpha of approx. 8.4% for the three year period ending 31st March, 2025. Similarly, for investors who are with us for five years or more, Sameeksha PMS has returned substantial alpha with an average annualized alpha of approx. 9.7% for the five year period ending 31st March, 2025. The Figure below shows the average annualized returns and alpha over different periods of time of all the clients as on 31st March, 2025.
Long term investors, mainly investor accounts older than five years and three years, have carved out strong alpha, thereby proving Sameeksha PMS to be a valuable partner for their investments (Table 15).
Aggregate Portfolio Performance on a Financial Year and Calendar Year basis
For the current financial year ending March 2025 (April 2024 to March 2025), Sameeksha PMS has outperformed the benchmark BSE 500 TRI by generating 13.6% returns against the benchmark BSE500TRI returns of 6%. Looking at our performance over the financial years (Figure 3), we have outperformed our benchmark in seven out of nine financial years. Key however is that the sum of outperformance of 78.1% in those seven years far exceeds the sum of underperformance of 9.8% in the remaining two years. We have successfully outperformed in the current financial year, marking six consecutive years of generating alpha.
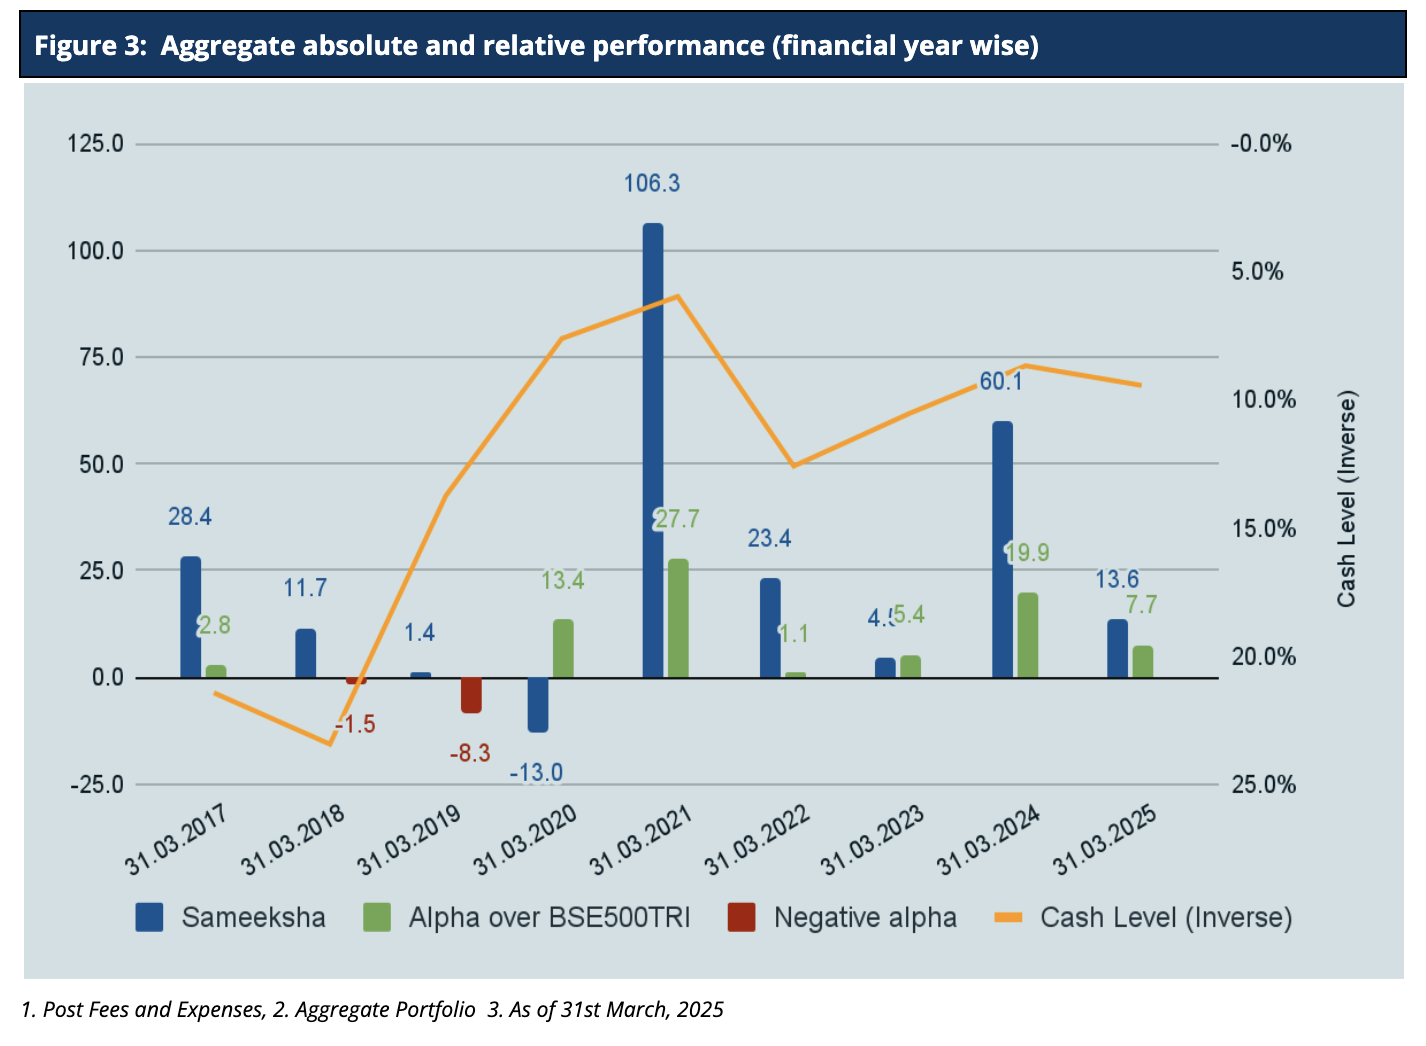
For the calendar year 2025, we have marginally outperformed the benchmark BSE500 TRI by 0.2%. Looking at our performance over calendar years (Figure 4), we have outperformed the benchmark in six out of nine calendar years and the sum of outperformance of 88.4% in six years far exceeds the sum of underperformance of 16.5% in the remaining three years.
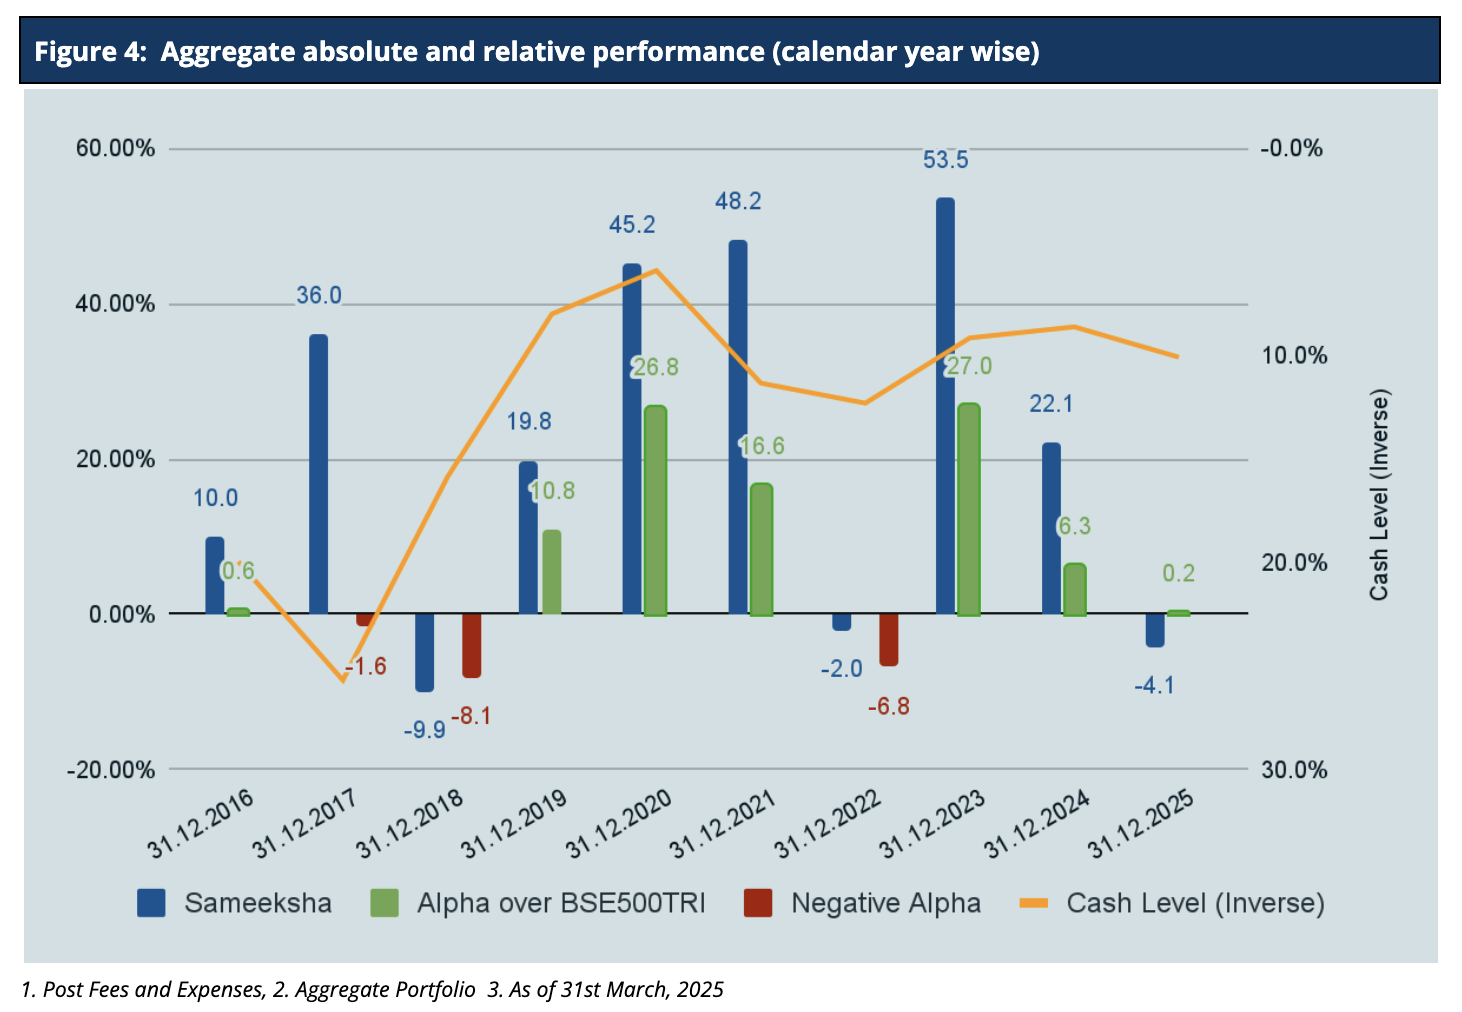
It is important to note that we delivered this alpha despite maintaining an average cash level of 12.7% across the nine financial years.
Performance Comparison with Select Mutual Funds Favored by Investors
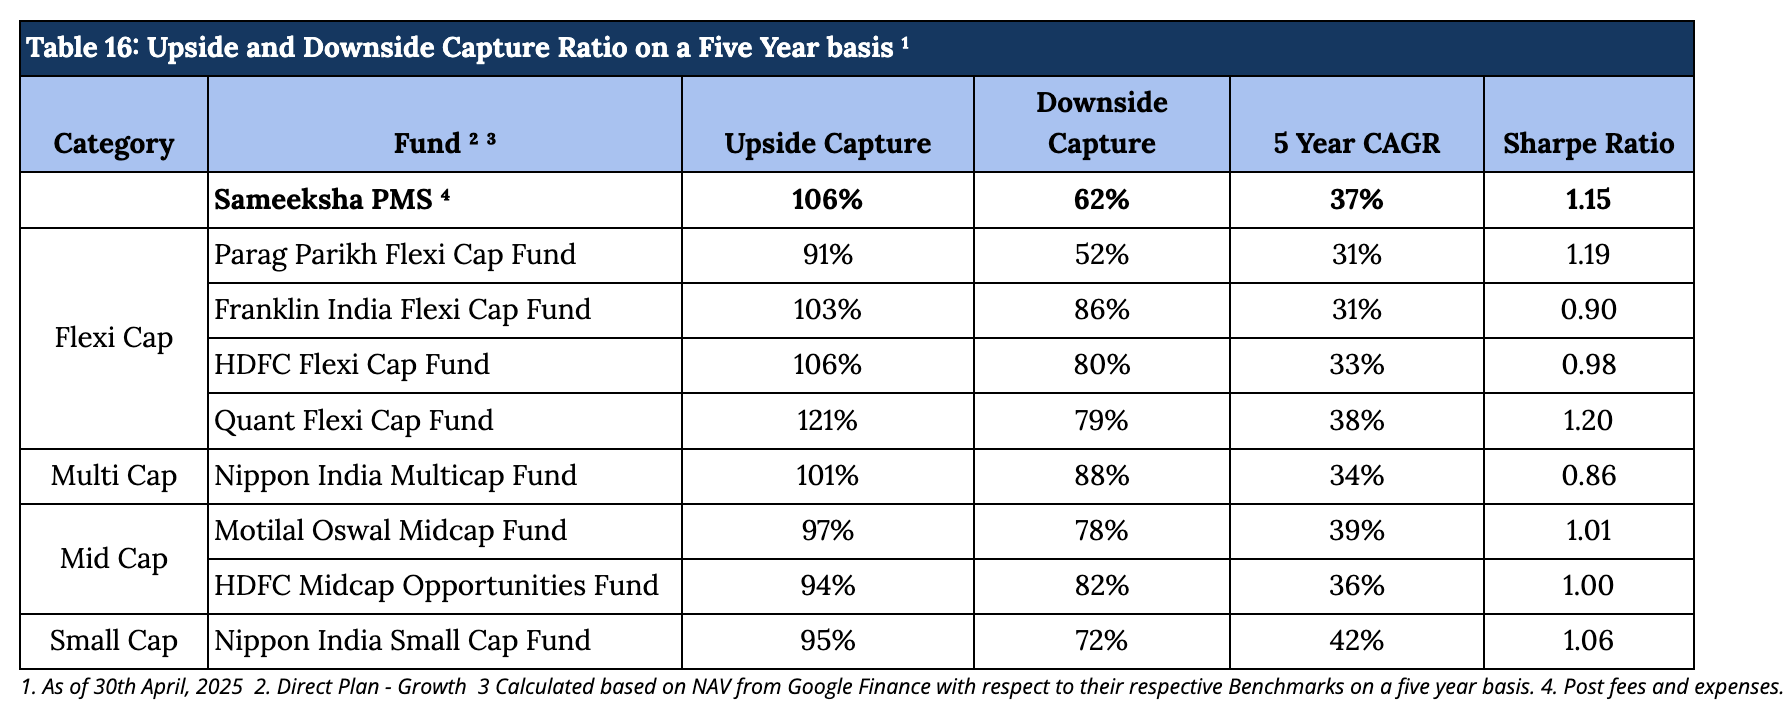
We compare our returns with a group of mutual funds favored by investors across various categories. This ensures that our performance assessment is both relevant and insightful, focusing on funds that align with investor preferences. We have achieved one of the lowest downside capture ratios compared to the mutual funds we analyze, reflecting our strong emphasis on risk management and minimizing losses during market downturns. Over a five-year period, we have delivered superior returns compared to these mutual funds, both in terms of CAGR as well as risk-adjusted returns, showcasing our ability to generate consistent and sustainable performance (Table 16).
Performance Of PMS Over The Covid Timeline (Pre, During, And Post)
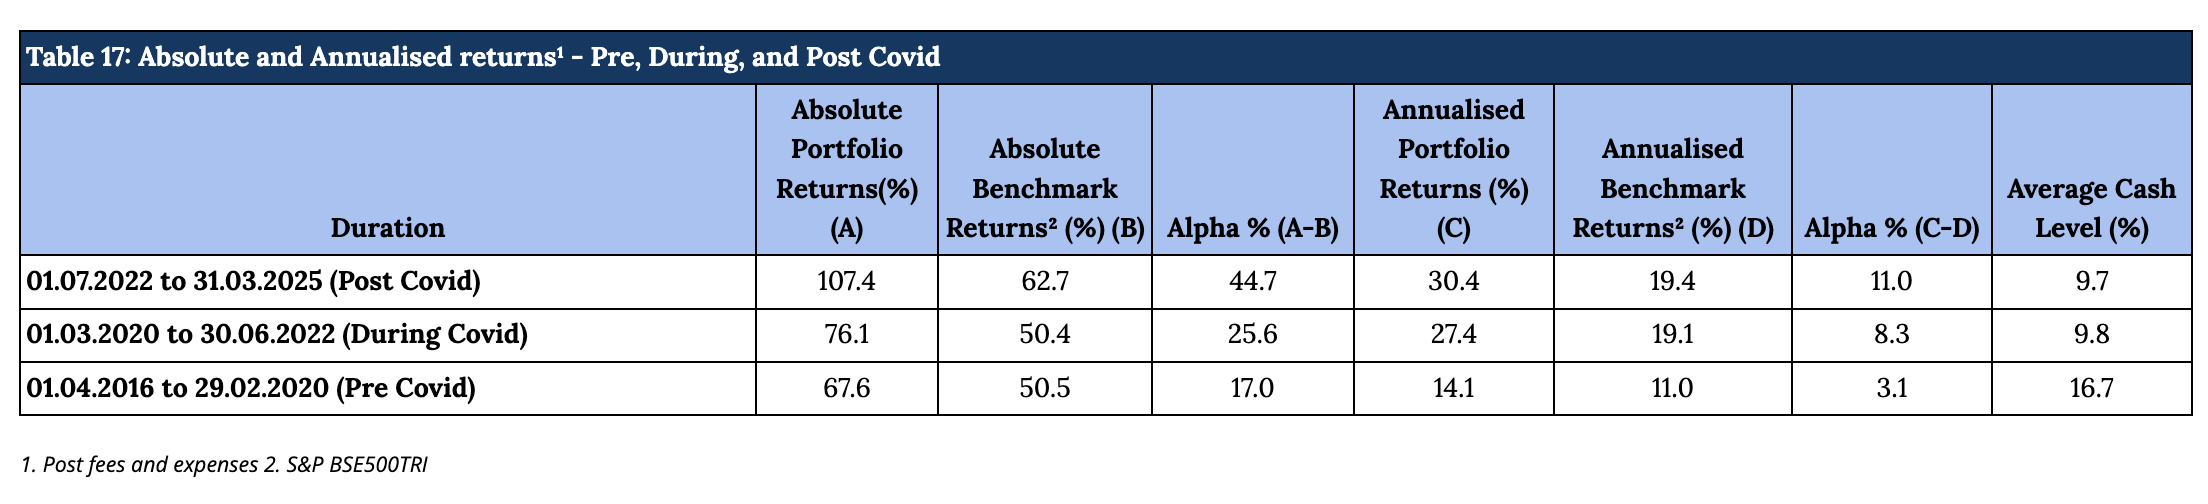
The Covid Pandemic induced significant volatility in the equity markets. Hence, it is useful to look at the performance across three time slices : Pre Covid, During Covid and Post Covid. Sameeksha PMS has outperformed the benchmark across all of these three time periods with meaningful alpha (Table 17). This consistency of performance may be an important factor in comparing us with the other funds.
Cumulative Performance versus the benchmark
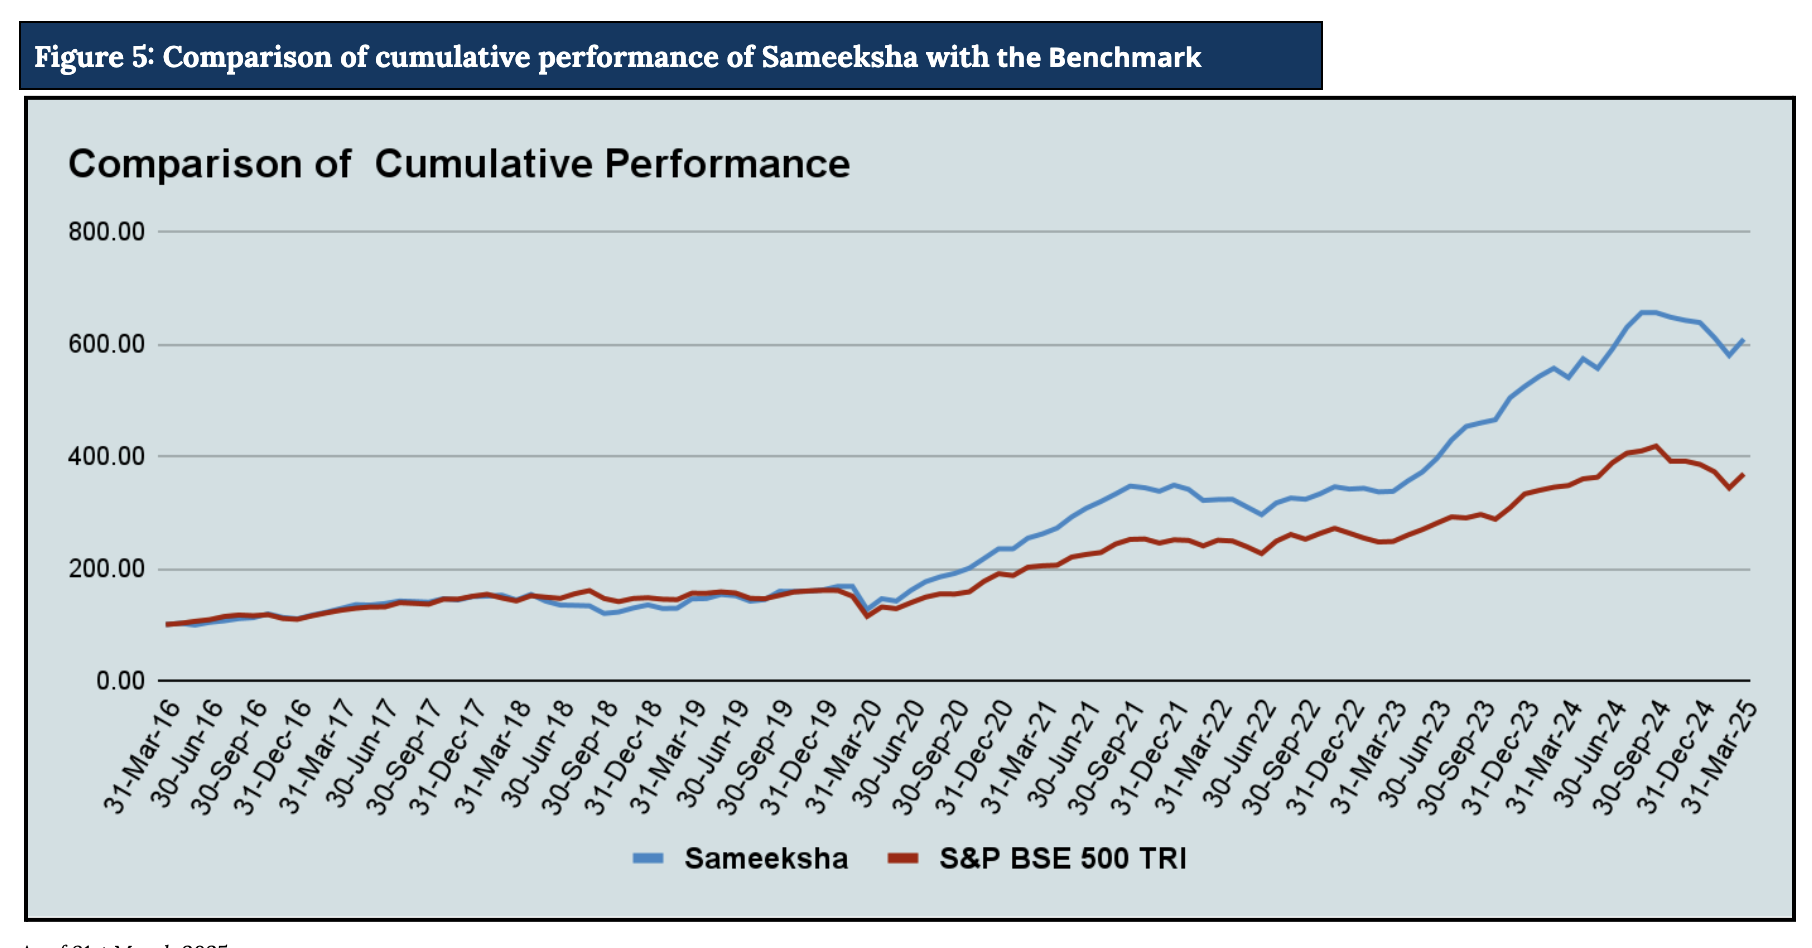
Sameeksha’s outperformance over its benchmark has continued to widen positively over the years. An investment of Rs. 100 with us since inception (April 2016) would have grown to Rs. 607, far outpacing what one would have earned by investing in a fund that achieved benchmark returns (Figure 5).
Links:
Appendix 1: Performance of the fund for FY2025
Appendix 2: Key Performance Contributors in FY2025