Introduction
Sameeksha completed nine years of managing money in Indian equities in March 2025. Back in late 2015, we started Sameeksha with the objective to manage our investors’ assets just as we manage our own by investing in businesses that were durable and were managed by stewards who view their company capital with the same care that we manage our investor assets. Our established investment process remains rules-based, technology backed, with extensive due diligence, and an unyielding focus value discipline in order to generate superior long-term returns. Integral to this process is our rigorous assessment of a company’s intrinsic value based on its cash flows or excess ROE and ensuring that the expected returns for incremental holdings are justified by the underlying risk of that business and the liquidity in the stock. You can find a detailed discussion of our fund’s performance over these nine years in Appendix 4.
For Indian Investors, we offer our investors multiple investment avenues, including both Portfolio Management Services (PMS) and Alternative Investment Funds (Domestic AIF). With our AIF having achieved meaningful scale, we have also begun participating in select IPO opportunities that aligns with our investment objectives. This enables us to further enhance our strategy by accessing high-conviction ideas early and providing our investors with exposure to compelling primary market opportunities.
For Overseas Investors looking to invest their US$ funds in the Indian equities market, the IFSC based investment route now allows them to tap into the wider local fund management talent pool. With the launch of multiple AIFs based out of GIFT City, investors now have a much wider choice of funds and strategies to pick from. We launched our IFSC-based CAT III AIF fund in March 2024 that follows the same underlying investment strategy as our domestic PMS and AIF funds – hence offering a more seamless investment experience as compared to a PMS for overseas investors.
India remains the fastest growing large economy while the US is home to world leading companies. Amongst various asset classes, India and US equities have delivered some of the highest returns over the long term. Hence, it is advantageous for investors, both domestic and foreign, to have exposure to these two markets in their portfolio. However, Indian investors investing in the US need to be mindful of the significant obligations and complex filing requirements in case of inheritance and estate taxes for portfolio values exceeding a threshold limit. In line with our commitment to offering investors with various investment products that outperform the markets on a risk adjusted basis, we are working on providing solutions that help domestic investors gain exposure to the US markets, while helping to mitigate current hurdles around estate taxes.
AI is increasingly becoming an integral part of our daily lives and in businesses. We are constantly trying to see how we can harness the power of AI to enhance our efficiency, improve idea generation, and sharpen our investment theses and ensure that we stay competitive in an evolving landscape driven by data and speed. For instance, our research team meticulously notes and categorises interactions with company managements – by integrating AI into our proprietary research platform – ‘RAW’ – we have made the process more efficient. RAW is designed to not only manage our research work flow but also facilitate further insights by being the repository of our past research on hundreds of companies.
We refrained from making any drastic changes to our portfolio over the past year, despite various macro challenges and event risks that led to market upheavals. For most of the year, the markets traded above their past median P/E multiples with the mid and small cap indices trading at relatively more expensive valuations as compared to the large cap indices. Despite this, our strategy maintains a larger tilt towards the mid and small-cap market segments. We draw comfort from the fact that the Sameeksha ratio of our portfolio has been more favorable than that for the mid and small cap indices. Sameeksha Ratio is our proprietary framework that looks at P/B normalized by ROE and interest rates. We also drew comfort from an improving GDP growth outlook and policy interventions that present a wider opportunity pool while market churn has thrown up pockets of value within the broader market. However, our internal risk rules place a cap of exposure to individual stocks to adhere to stock and overall portfolio liquidity limits. Hence, our commitment to risk management and diversification has led to an increase in the number of stocks in our portfolio as compared to last year. The Nifty50 Index saw a maximum drawdown of 16% during FY25 whereas the strategy proved effective in mitigating portfolio risks, as reflected in the downside capture ratio of 56% for FY25.
Incrementally, we are introducing certain changes in the fee structure that we believe are unique and more favorable for the investors that qualify for it.
Review of the Year
The Indian equity market in FY2025 was a tale of two halves as barring the election-day volatility, the markets continued to rally till the end of September 2024 and then saw a significant correction till the end of February 2025. The post-election optimism and rally in global equities lifted the domestic equity indices in the first half while a slowing urban consumption and FPI outflows pulled down the indices in the second half.
Slowdown in government spending and weaker investment activity brought down India’s GDP growth to a low of 5.6% in Q2FY25. Higher government spending, buoyant rural demand and resilient services sector growth has seen GDP growth recover in the subsequent quarters to 7.4% for Q4FY25 and 6.5% for the year. Urban demand, after driving consumption in previous years, saw a moderation in FY25, as reflected in the growth of passenger vehicles and FMCG volumes in urban areas.
The Union budget in February 2025 raised the individual income tax exemption limits under the New Regime – to stimulate urban demand by leaving more money in the hands of the middle class. It also provisioned for a 17.4% increase in the effective capital expenditure for FY26, increasing it to Rs 1.55 tn which is at 4.34% of GDP.
Headline inflation moderated from an average of 5.4% during FY2024 to an average of 4.6% during FY2025. CPI inflation, after moving above the upper tolerance band in October 2024 to 6.21%, corrected sharply to a 67-month low of 3.34% for the month of March 2025 and stood at 2.82% for the month of May 2025. Inflation has cooled on the back of higher agri output that brought down food inflation, as well as deflation in fuel prices.
The RBI’s MPC in October 2024 voted to change the monetary policy stance from ‘Withdrawal of Accommodation’ to ‘Neutral’. Subsequently, RBI cut the CRR by 50 basis points in December 2025 and Repo rate by 25 basis points February – cutting rates for the first time in five years, followed by another 25 basis points cut in April 2025. In June 2025, the RBI further front loaded its monetary policy interventions with a 50-bps cut in the Repo rate, a 100-bps cut in the CRR and changing its stance back to ‘Neutral’. The India 10 Year GSec yield closed FY2025 at 6.58%, down from 7.05% at the end of FY2024.
Tighter capital requirements imposed in late 2023 for personal and credit card loans dampened growth in those segments as the YoY growth in personal loans is down from ~20 % in FY24 to 9 % in FY25 . Monetary policy apart, the RBI has shifted from restrictive to supportive policy measures as indicated in the following:
- MFI/NBFC relaxation: In February 2025, RBI reversed parts of its 2023 tightening by reducing risk-weights on consumer microfinance and NBFC exposures by 25 percentage points. In June 2025, it eased the qualifying-asset criterion for NBFC‑MFIs, lowering the threshold from 75 % to 60 %.
- Relaxation to infrastructure lending in June 2025: Provisioning requirements for under-construction infrastructure loans reduced from 5 % to 1 %, effective October 1, 2025 . The circular also extends project timelines to support quality rather than quantity.
Impacted by sentiment and sharp moves in US Dollar and US Bond Yields, the Foreign Institutional Investor flows swung dramatically since October 2024 and remained significantly negative through February 2025.
The Indian equity markets for the year 2024-25 had a roller coaster ride, rallying in the first half and then correcting in the second half. For the financial year, our benchmark index BSE500 TRI was up by 6%, following very strong returns in the previous year. The large, mid and small cap indices , all had similar returns for the year. On a rolling 3 and 5 year return basis, the mid and small cap indices are outperforming the Nifty 50 Index. Defence, Financials and Healthcare were the best performing sector indices while Media, Energy and Realty were the worst performing indices in FY25. The BSE500 TRI Index returns lagged the S&P 500 TR Index of 8.3% and MSCI EM Index returns of 8.3%. The underperformance as compared to global markets can be attributed to a mix of domestic and external factors, mainly the slowdown in domestic growth and large FII outflows in the second half.
In this financial year 2024-25, Sameeksha PMS has managed to generate positive absolute return as well as meaningful outperformance as compared to our benchmark BSE500 TRI. The PMS returned 16.6% before performance fees but with the application of performance fees, our returns came to 13.6%, outperforming the benchmark BSE500 TRI by 7.7 percentage points. We analyze the Fund performance for the year in greater detail in Appendix 1. Further, we discuss key contributors to the portfolio performance in Appendix 2. We discuss the outlook for our key investment positions in Appendix 3. We have further discussed the performance of the Fund over the last nine years in Appendix 4. Lastly, we discuss in detail the outlook of the Indian economy in Appendix 5.
Market Outlook
RBI has projected GDP growth at 6.5% in FY26, which is the same rate as that achieved in FY25 indicating stable growth. Although fiscal and monetary stimulus, along with low inflation, provide a supportive backdrop for economic recovery, tangible signs of a sustained pickup in consumption and investment demand remain elusive, tempering the pace of corporate earnings growth in recent quarters.
The IMD has forecast above normal rainfall for the 2025 monsoon season (106% of Long Period Average with a model error or +/-4%), which is likely to sustain the buoyancy in rural demand. There has been a significant easing of the monetary policy with a 100 basis point cut in the interest rates and 150 basis point cut in the CRR, that is likely to aid the growth in consumption as well as corporate earnings growth. Crude oil prices have cooled off and are currently down as compared to FY25 average of $78.6/bl for the Indian basket – this will aid in keeping inflationary pressures off and in fiscal consolidation. A modest current account deficit (CAD) and adequate forex reserves continue to provide adequate cushion to absorb pressures on the currency even as capital flows exhibit volatility.
Higher trade tariffs may impact global growth and sentiment though India is relatively better placed with the share of Merchandise Exports to GDP comparatively low at about 11%-12% – some export sectors may even gain in case there are any relative tariff advantages. India is also geopolitically right aligned and any US-China friction will provide further impetus to China+1 sourcing in the long term. Delays in pick up of private investments and headwinds on account of US tariffs pose key challenges to growth.
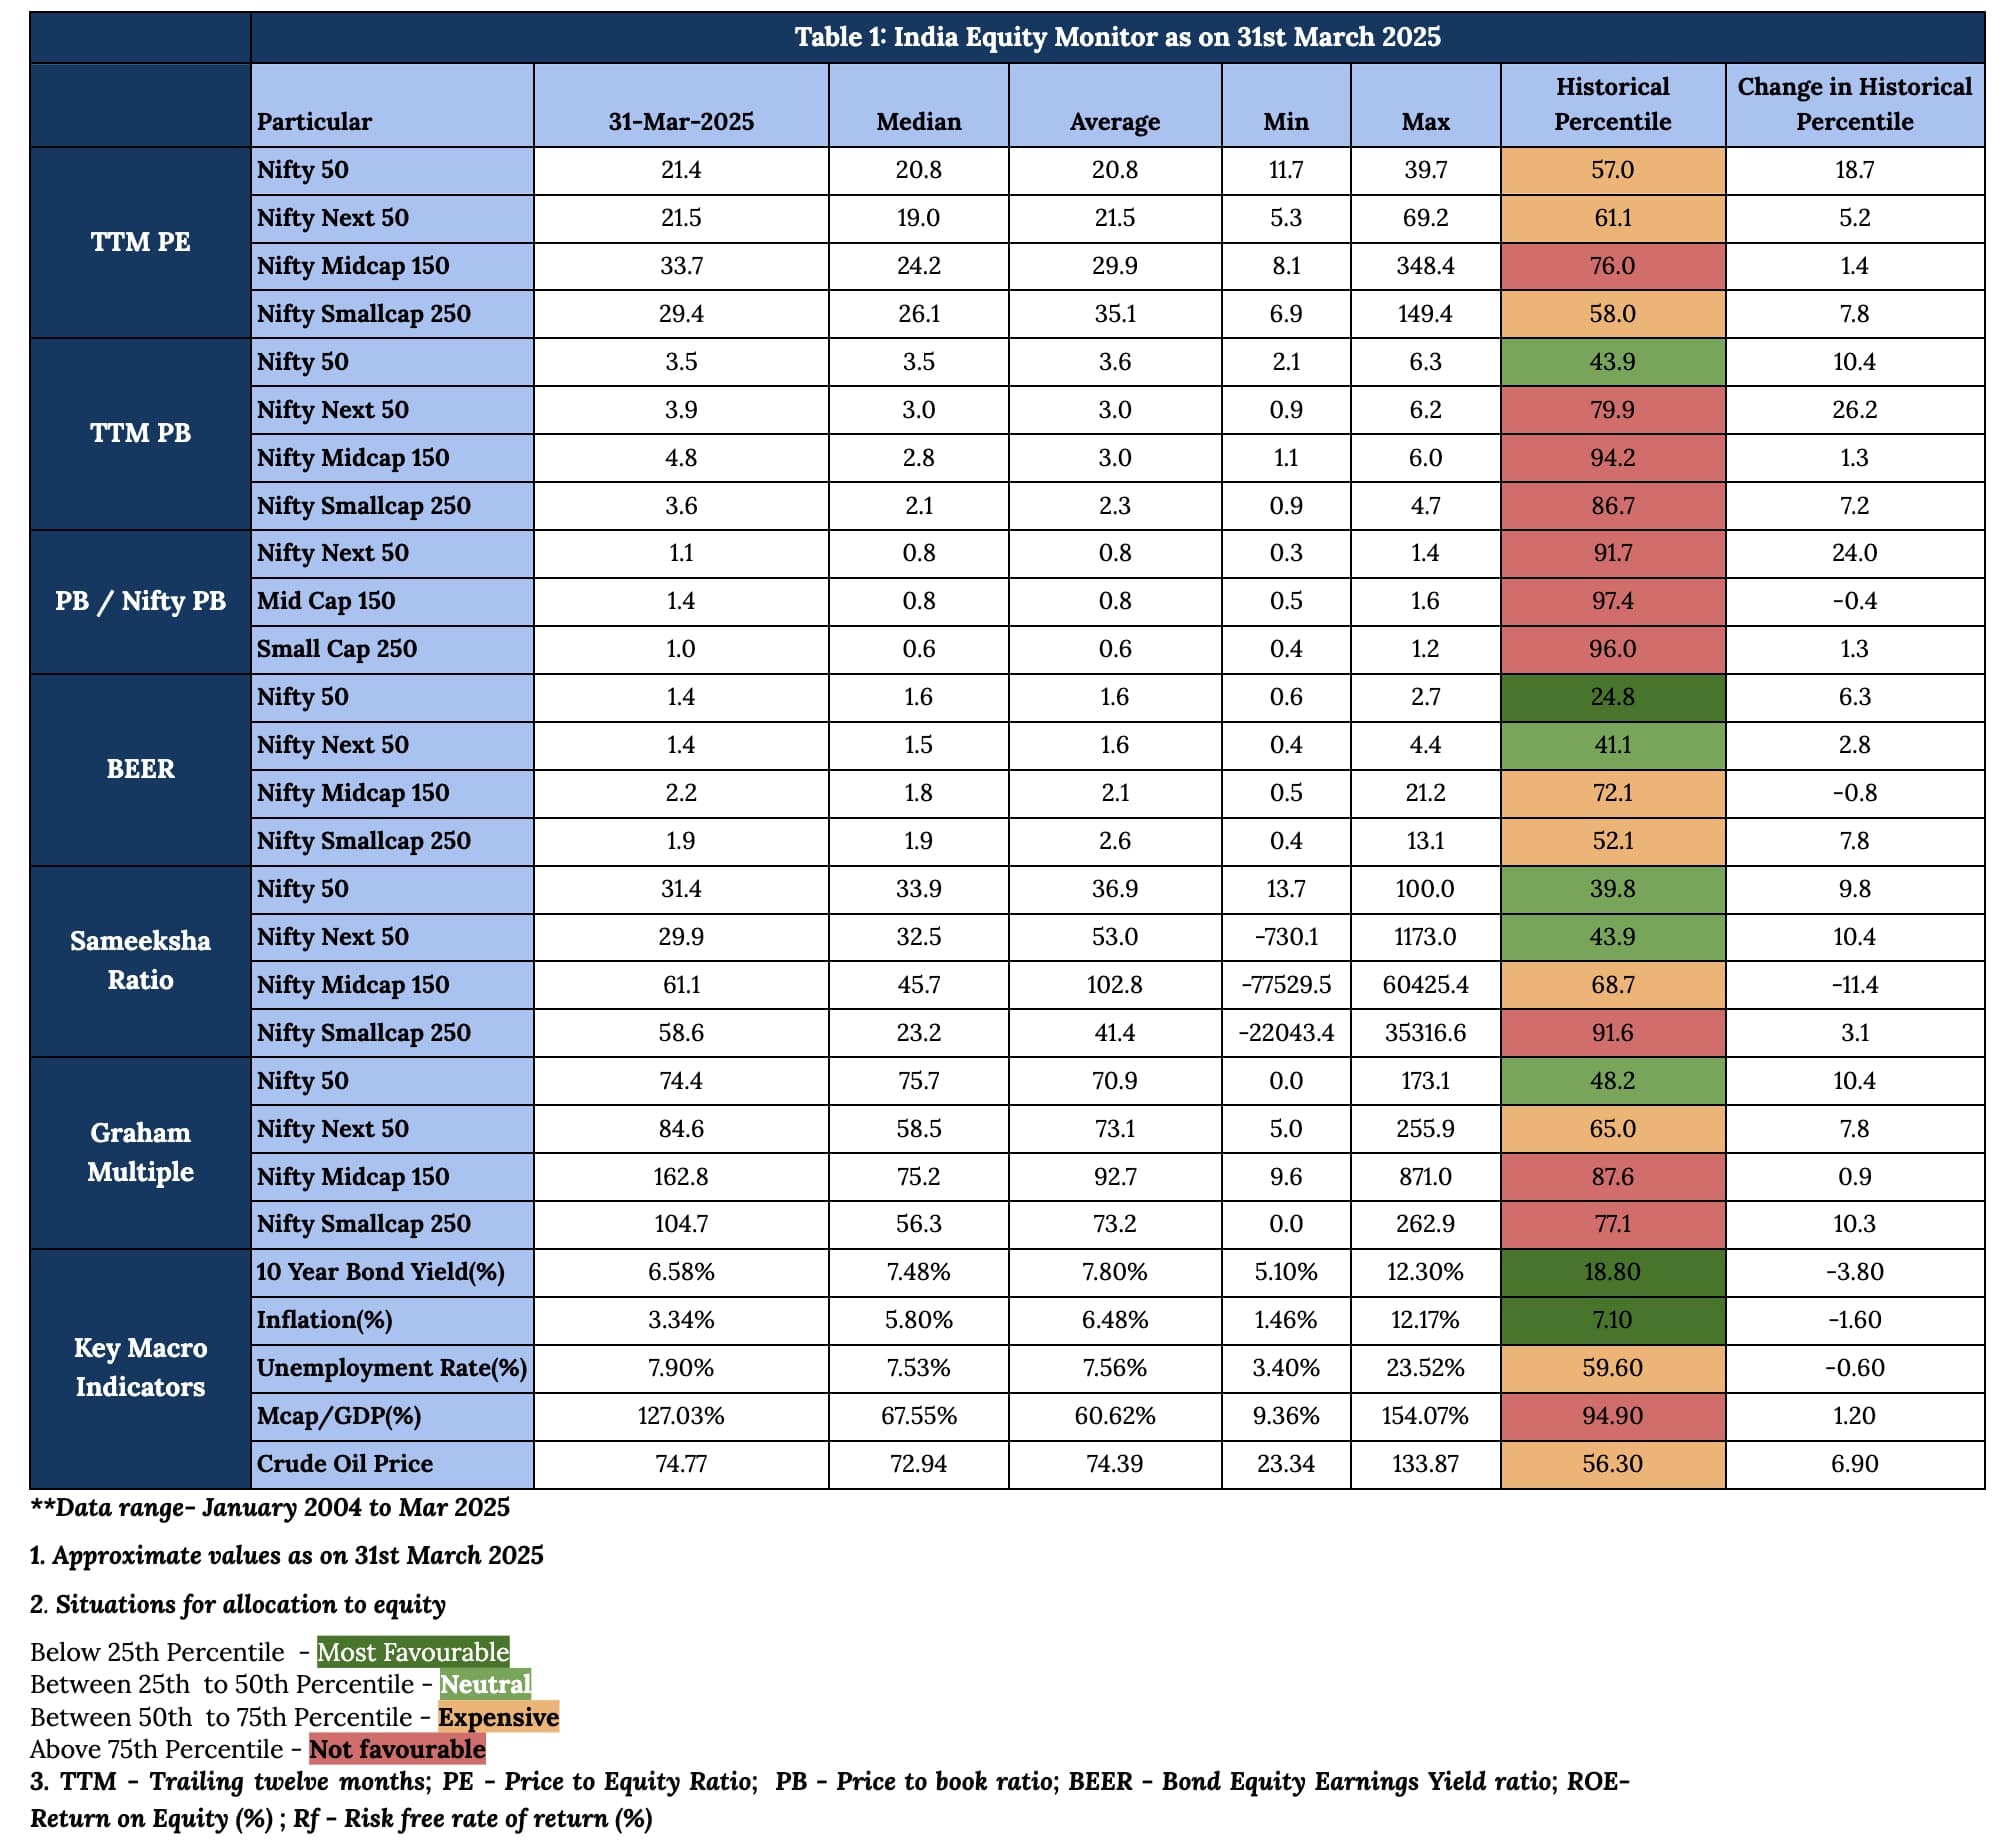
Our Indian market monitor (Table 1) for end-March indicates that valuations have remained above historical median levels on a P/E basis across the large, mid and small cap indices. The Sameeksha Ratio which looks at P/B normalized by ROE and interest rate continues to remain favorable for the large cap indices – supported by a combination of lower interest rates and higher corporate profitability. With P/E multiples currently at elevated levels, prospective market returns from hereon may remain below the levels seen over the past 3-5 years.
Links:-
Appendix 1: Performance of the fund for FY2025
Appendix 2: Key Performance Contributors in FY2025
Appendix 3: Current view on top seven positions
Appendix 4: Analysis of our performance over last Nine years