Indian markets ended the month of October 2022 with gains of 4.09% for BSE500TRI though gains were stronger for large caps. BSE MidcapTRI and BSE Smallcap TRI gained 2.05% and 1.30%, respectively. Sameeksha PMS had a positive performance of 3.01% (net of all fees and taxes). Large allocation to Small and Midcap stocks for the month of October (~60%), explains the underperformance versus BSE500TRI.
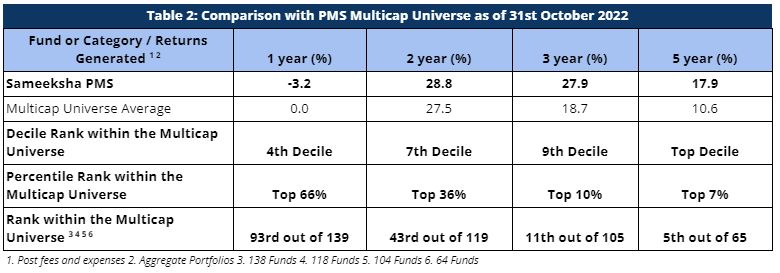
Among the multicap PMS universe tracked by PMS Bazaar, we are ranked 5th out of 65 multicap PMSes for the five year period ending October 2022. For the three year period ending October 2022, we are ranked 11th out of 105 multicap PMSes reporting to PMS Bazaar.
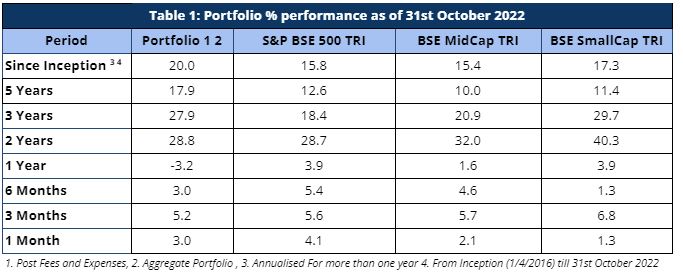
As defined by our strategy, we have maintained relatively higher levels of cash (14% on average over the entire period from inception) from time to time over the duration of managing the portfolio. Notwithstanding the same, from inception as well as over five and three years respectively, we have generated returns of 20.0%, 17.9% and 27.9% beating the benchmark BSE500 TRI returns of 15.8%, 12.6% and 18.4% respectively.
Portfolio Returns
For this month, the broader market ended at 4.09% returns. BSE Midcap TRI and BSE Smallcap TRI returned 2.05% and 1.30%, respectively. Global headwinds persisted: Relentless hawkishness by the U.S. Fed, prominent U.S. recession fears and continued tensions related to Russia’s invasion of Ukraine. Despite these headwinds, October saw the ray of light mainly because of two factors – the inherent strength of the Indian economy with early signs of peaking of inflation, accelerating growth in credit and healthy balance sheets of financial institutions. For the month of October, the rallying sectors were largely rate sensitive sectors such as Banks. The IT sector was also a surprise gainer after being an underperformer in the last few months. The gains in the IT sector can be attributed to better than expected results in Q2 with abating margin pressure, strong order pipelines despite weak market conditions and benefit of a weaker rupee. Oil & Gas sector was another key gainer this month. On the other hand, FMCG and Consumer Durables underperformed the benchmark because of rising input costs and slowing down of rural demand despite a festival quarter. While we could sufficiently participate in the Banking and IT sector rally, our allocation to the sectors that performed well this month was not significant enough to outperform the benchmark BSE500TRI.
For longer periods where the outperformance is much more meaningful, we have strongly outperformed our benchmark index across all the relevant key periods – as can be observed in Table 1.
Performance within the PMS Universe
We continue to maintain our top rankings both within the multicap PMS universe as well as the entire PMS universe for key periods of three and five years. The multicap PMS universe rankings are more relevant to us since we follow multicap strategy.
For the three year period, we are ranked 11th out of 105 PMSes. Further, we are ranked 5th out of 65 funds for the five year period comparison within the Multicap universe – highlighting our superior performance over the long term (Table 2).
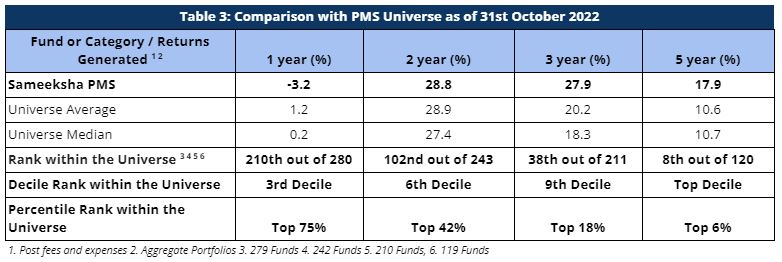
When compared with the entire PMS universe, we have maintained top rankings for longer key periods. We are consistently ranked in the Top Decile for the five year period (Table 3).
Fund Performance on a Financial Year and Calendar Year basis
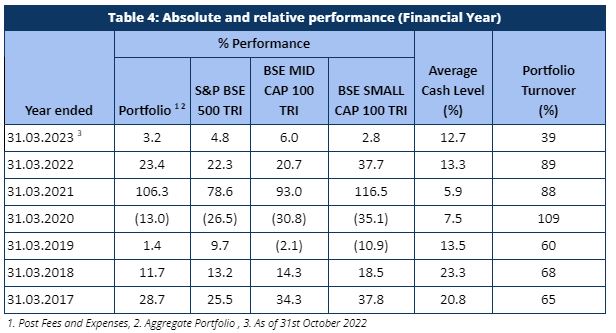
For the first 7 months of the current financial year ending March 2023 (April 2022 to October 2022), Sameeksha PMS has underperformed the benchmark BSE 500 TRI by generating 3.2% returns for the period against the benchmark 4.8% returns (Table 4).
Looking at our performance over the financial years, we have outperformed our benchmark in four out of seven financial years. Key however is that the sum of outperformance of 45% in those four years far exceeds the sum of underperformance of 11% in the remaining three years (including the current incomplete financial year).
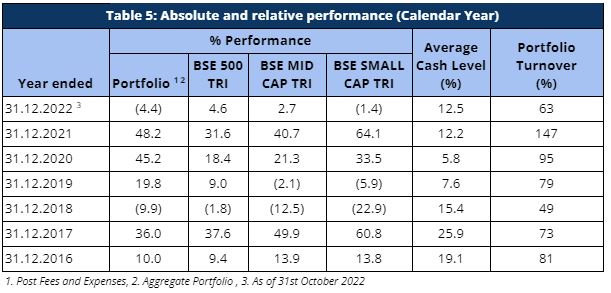
The performance pattern on a calendar year basis has been quite similar as well (Table 5). Although, for the current calendar year 2022, we are underperforming the benchmark, for the recently completed calendar year ending 2021, we have generated a return of 48.2% with an alpha of 16.6% over our benchmark BSE 500 TRI.
Rolling Returns and Rankings
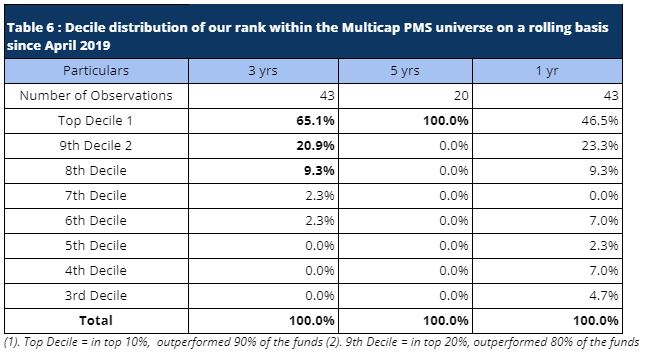
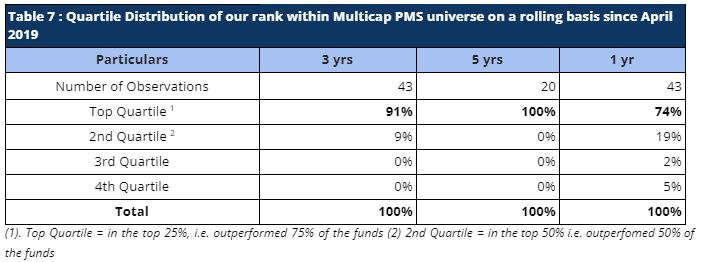
Rolling returns are a more useful indicator of consistency in performance versus single period returns. For the rolling three year periods applicable for our entire operating history, we have been ranked among the multicap universe in the top decile 65% of the time (28 out of 43 observations) and in top Quartile 91% of the time (39 out of 43 observations). For the remaining 9% observations, we were ranked in the second quartile (Tables 6 and 7). For the rolling five year periods applicable for our entire operating history, we have been ranked among the multicap universe in the Top Decile 100% of the time (20 out of 20 observations).
Performance Of Individual Portfolios
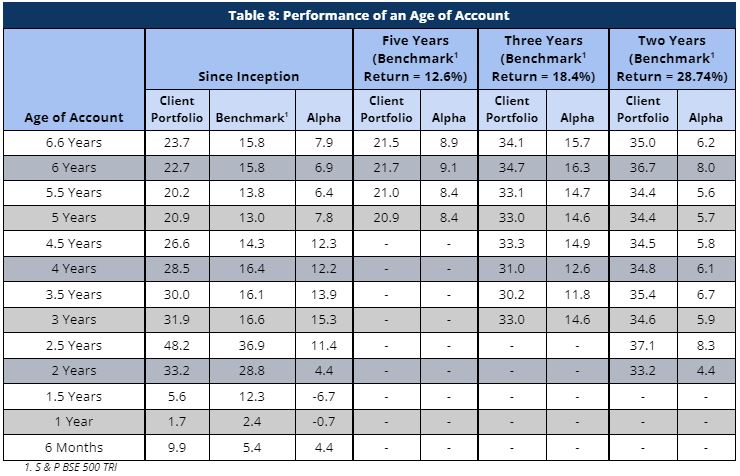
Portfolio returns for clients, except for investors starting with us between a period of one year ago to 18 months ago, have seen remarkably strong (Table 8). For a long term investor, Sameeksha PMS has proven to be a valuable partner for their investments. Performance of portfolios of clients who joined us between a year to eighteen months ago is below par and we hope that reverses over time.
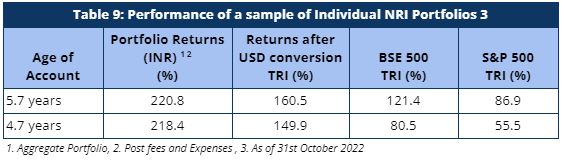
Our NRI clients have seen strong returns even after factoring in rupee depreciation against US dollars. The portfolio returns are significantly higher than both BSE 500 TRI and S&P 500 TRI, generating strong alpha over both these indices (Table 9).
Cumulative Performance versus the benchmark
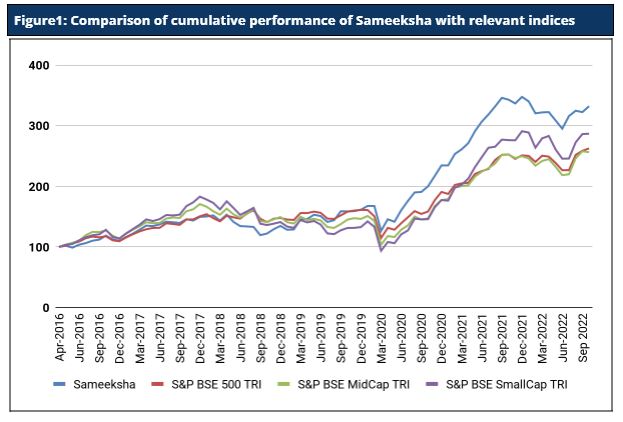
Sameeksha’s outperformance over its benchmark has continued to widen positively over the years. An investment of Rs. 100 with us since inception (April 2016) would have grown to Rs. 332, far outpacing what one would have earned by investing in a fund that achieved benchmark returns (Figure 1).
Risk Adjusted Ratios
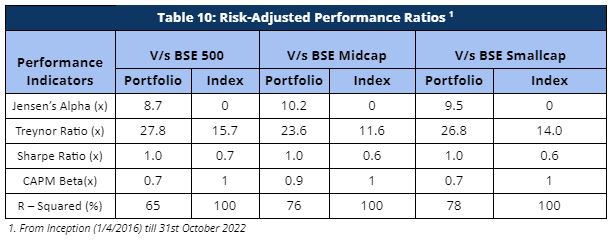
When compared on a risk-adjusted basis (Table 10), our PMS shows even stronger performance with a risk-adjusted alpha generation of 8.7% over the broad market benchmark since its inception. While our portfolio beta has been materially lower than our benchmark, our returns have been higher than the benchmark since inception, implying superior strong risk adjusted returns.
Furthermore, other risk-adjusted returns – Sharpe ratio and Treynor ratio, are also significantly higher than the benchmark indices (Table 10). It is worth noting that we offer superior risk adjusted returns not only compared to the broad BSE 500 index heavily weighted towards large cap but also the small cap and mid cap benchmarks as demonstrated by our Sharpe ratio, Alpha, Treynor ratio and Beta.