* Period ending 30th June, 2024 , ** Among multicap PMSes for five year period , *** Five year Period
In the month of June, the benchmark S&P BSE 500 TRI has grown by 7.1%. Against that, Sameeksha PMS (Portfolio Management Service = Separately Managed Accounts) has grown by 6.2% (net of all fees and expenses) while having cash levels of 10.9% at start of the month and 6.9% at the end of the month. Sameeksha AIF (Alternative Investment Fund = “Hedge Fund”) gained by 5.7% (post fees and expenses), indicating marginal underperformance.
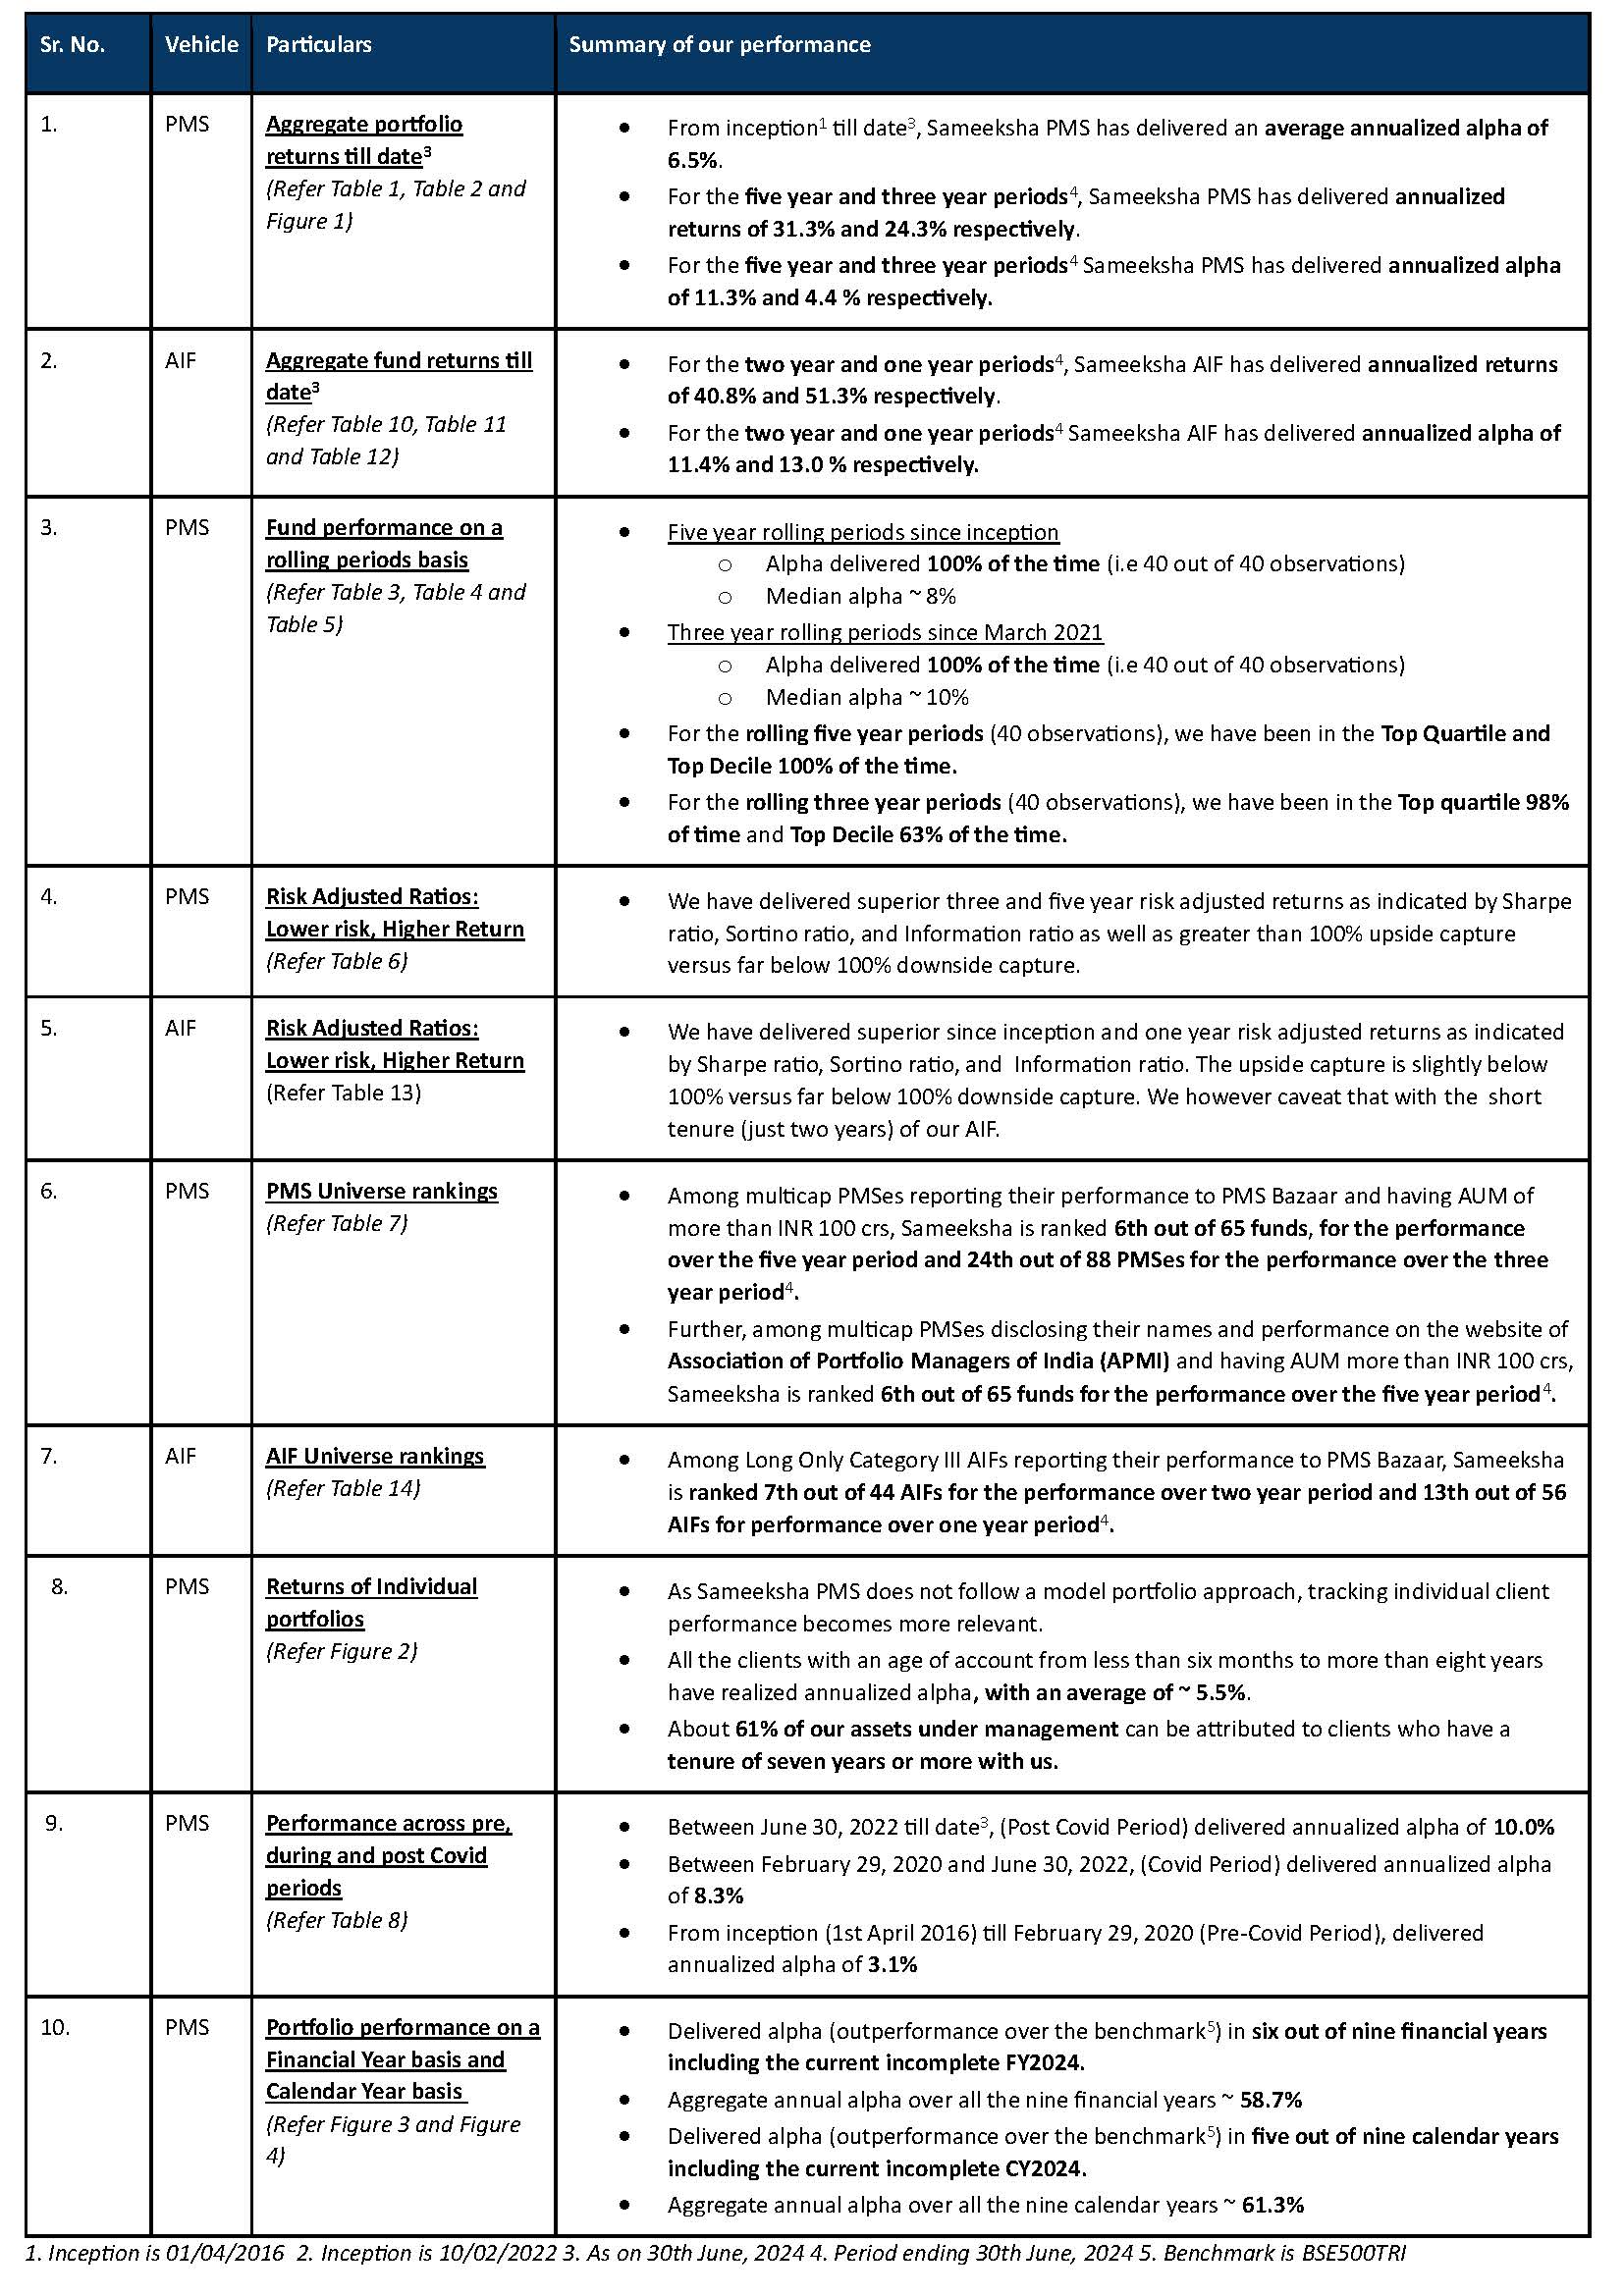
We summarize key aspects of our performance as follows:
PMS Performance and other details
Three important things must always be kept in mind when looking at performance data. First, for funds such as ours that do not follow model portfolio strategy, the performance of individual clients for different duration is important to look at. Second, some PMSes may be charging fees outside the PMS and hence after fees, performance data may not be comparable to ours. Third, it is important to look at not only portfolio returns but also risk adjusted ratios. We provide data to address all three points later in this note.
Aggregate Portfolio Returns over various time periods
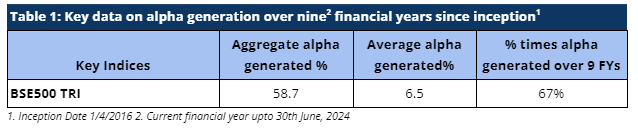
Sameeksha PMS has delivered a substantial aggregate annual alpha of 58.7% over BSE500 TRI over the nine financial years (including the current incomplete financial year) implying an average alpha of 6.5% since inception (Table 1).
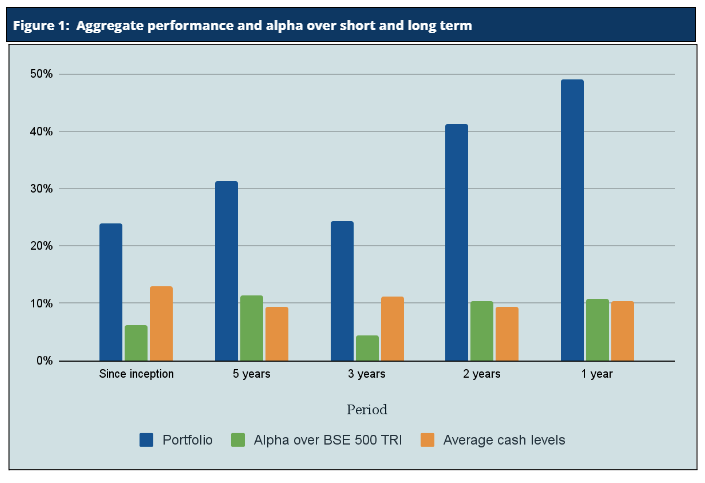
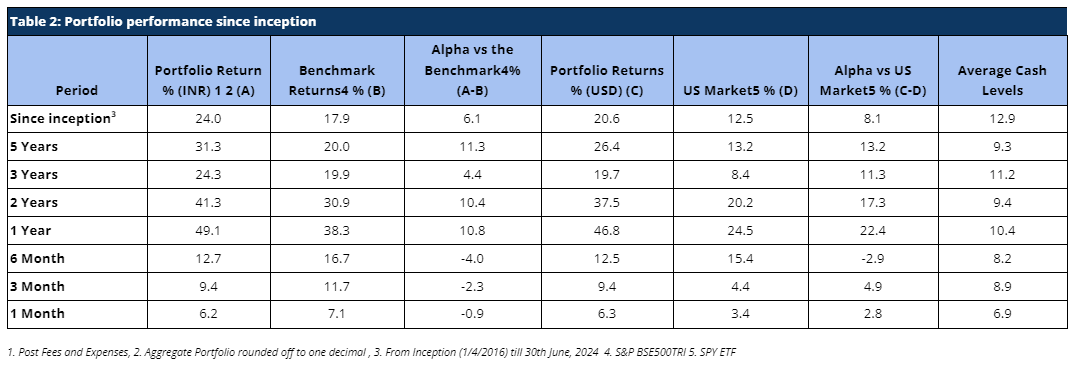
It is important to note that we have maintained relatively higher levels of cash (13% on average over the entire period from inception) from time to time over the duration of managing the portfolio. Notwithstanding the same, from inception, over five years and over three years respectively, we have generated returns of 24.0%, 31.3% and 24.3% in INR terms and 20.6%, 26.4% and 19.7% in USD terms thus generating substantial alpha over the Indian benchmark BSE500 TRI returns and SPY ETF (ETF tracking US S&P 500 index), respectively. Also, we have delivered strong returns relative to benchmark across various key time periods (Table 2 and Figure 1).
Aggregate Portfolio Performance and ranking on a rolling periods basis
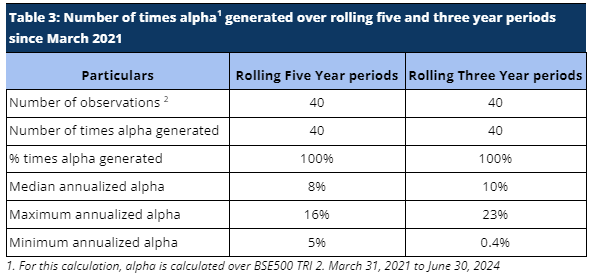
Rolling returns are a more useful indicator of consistency in performance versus single period returns. For the rolling five year periods applicable from March 2021 till date, Sameeksha PMS has delivered aggregate annualized alpha ranging from 5% to 16%, 100% of the time (40 out of 40 observations). For the rolling three year periods applicable from March 2021 till date, Sameeksha PMS has delivered aggregate annualized alpha 100% of the time (40 out of 40 observations) ranging from 0.4% to 23%.
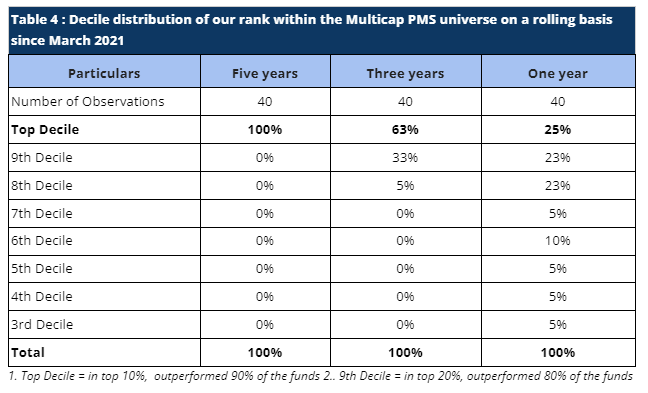
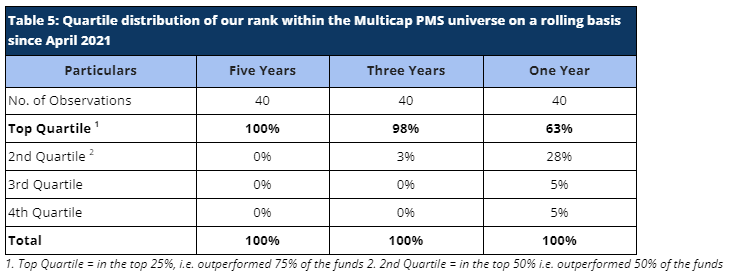
For rolling three year periods applicable since March 2021, we have been ranked among the multicap universe in the Top Decile 63% of the time (25 out of 40 observations) and in the Top Quartile 98% of the time (39 out of 40 observations). For rolling five year periods applicable to our entire operating history, we have been ranked among the multicap universe in the Top Decile and Top Quartile 100% of the time (40 out of 40 observations). (Tables 4 and 5)
Risk Adjusted Ratios: Not all returns are the same, Higher Returns at lower Risk
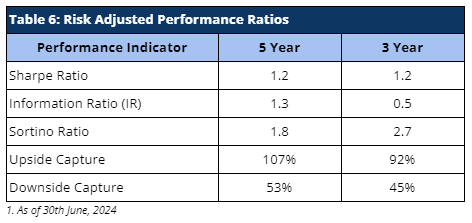
When compared on a risk adjusted basis, our PMS has shown an even stronger performance. The Information Ratio(IR) measures the excess return of a portfolio over a benchmark per unit of active risk. A higher Information Ratio suggests better risk-adjusted performance.The higher five year IR indicates better performance over the longer period in comparison to the IR in the 3 year period. The Sortino ratio measures the risk-adjusted return of an investment, focusing only on the downside risk. A higher Sortino ratio indicates better risk-adjusted returns, particularly with respect to downside risk.
Moreover, Upside Capture measures how well a fund performs as compared to a benchmark when the benchmark has positive returns. A higher upside capture ratio (> 100%) indicates that the fund captures more of the benchmark’s positive movements. Whereas, Downside Capture measures how well a fund performs compared to a benchmark when the benchmark has negative returns. A lower downside capture ratio (< 100%) indicates that the fund preserves capital better during market downturns.
Furthermore, other risk-adjusted returns – Sharpe ratio is also significantly higher (Table 6).
Performance within the PMS Universe
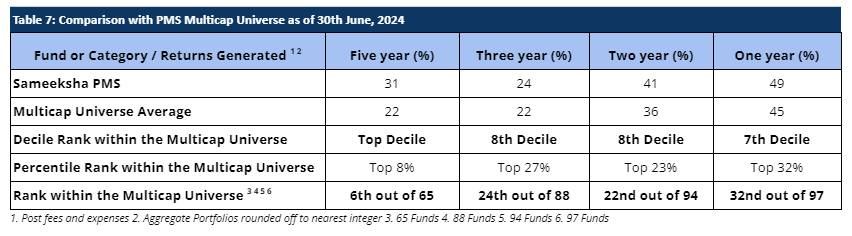
We continue to maintain our top rankings both within the multicap PMS universe as well as the entire PMS universe for key periods of three and five years. The multicap PMS universe rankings are more relevant to us since we follow the multicap strategy.
In the interest of a fair comparison, we present our rankings among those multicap PMSes with AUM more than INR 100 crs. Within this universe, we are 6th out of 65 PMSes, for the five year period and 24th out of 88 PMSes for three year period, highlighting our superior performance over the long term periods (Table 7). Among the multicap universe (considering all AUM), we are consistently ranked in the Top Decile for the five year period for all 40 out of 40 observations reflecting well on the consistency of our performance.
Returns of Individual Portfolios
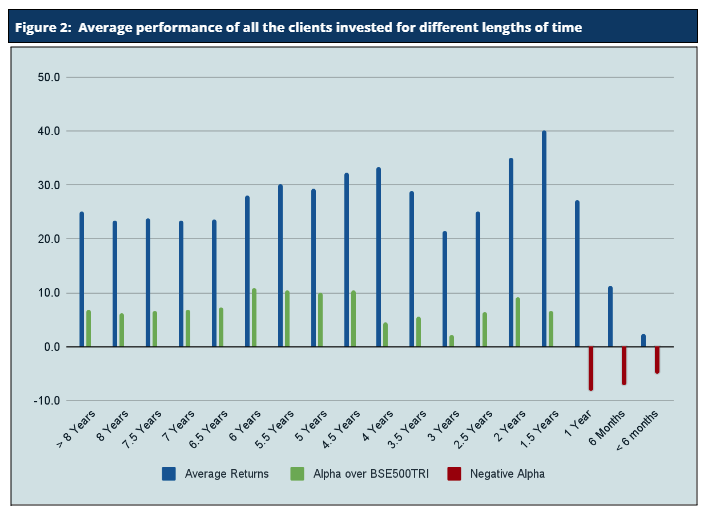
Because we don’t follow model portfolio strategy, the performance of individual clients is far more important than overall portfolio aggregate returns (Figure 2). For investors who are with us for 3 years and more, Sameeksha PMS has returned a very substantial alpha with an average annualized alpha of approx. 3.1% for the three year period ending 30th June, 2024. Similarly, for investors who are with us for 5 years or more, Sameeksha PMS has returned substantial alpha with an average annualized alpha of approx. 11.2% for the five year period ending 30th June, 2024. The Figure below shows the average annualized returns and alpha over different periods of time of all the clients as on 30th June, 2024.
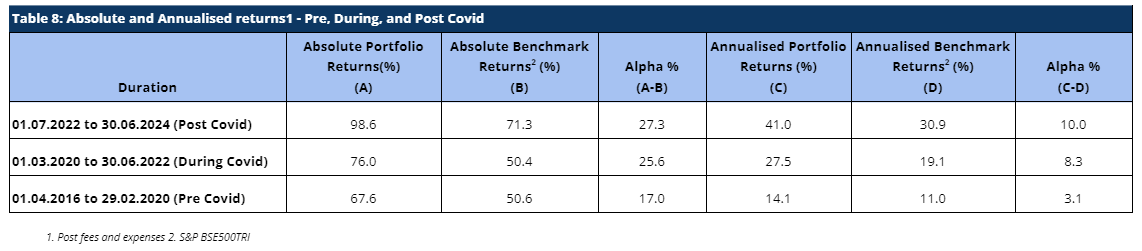
Performance Of PMS Over The Covid Timeline (Pre, During, And Post)
The Covid Pandemic induced significant volatility in the equity markets. Hence, it is useful to look at the performance across three time slices : Pre Covid, During Covid and Post Covid. Sameeksha PMS has outperformed the benchmark across all of these three time periods with meaningful alpha (Table 8). This consistency of performance may be an important factor in comparing us with the other funds.
Aggregate Portfolio Performance on a financial year and calendar year basis
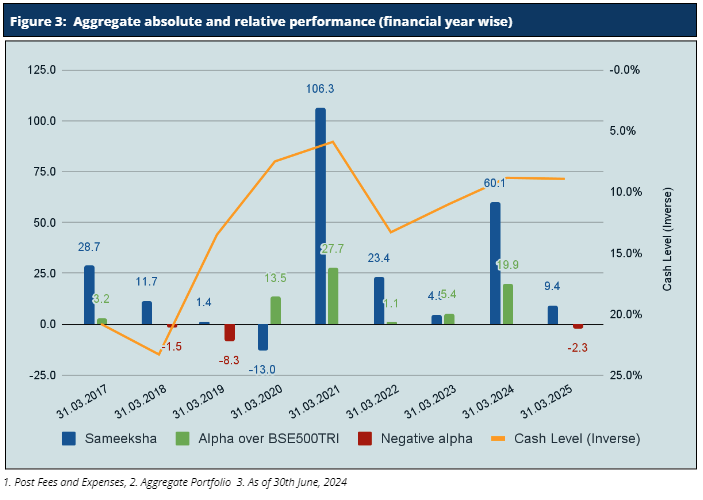
For the month of June, Sameeksha PMS has underperformed the benchmark BSE 500 TRI by generating 6.2% returns against the benchmark BSE500TRI returns of 7.1%. For Financial Year 2024-25, we have underperformed BSE500 TRI by 2.3%. Looking at our performance over the financial years (Figure 3), we have outperformed our benchmark in six out of nine financial years (including the current incomplete financial year). Key however is that the sum of outperformance of 70.8% in those six years far exceeds the sum of underperformance of 12.0% in the remaining three years. Furthermore, if we are able to outperform in this financial year, it will become a streak of six consecutive years of generating alpha.
For the calendar year 2024, we have underperformed the benchmark BSE500 TRI by 4.0%. Looking at our performance over calendar years (Figure 4), we have outperformed the benchmark in five out of nine calendar years and the sum of outperformance of 81.8% in five years far exceeds the sum of underperformance of 20.5% in the remaining four years.
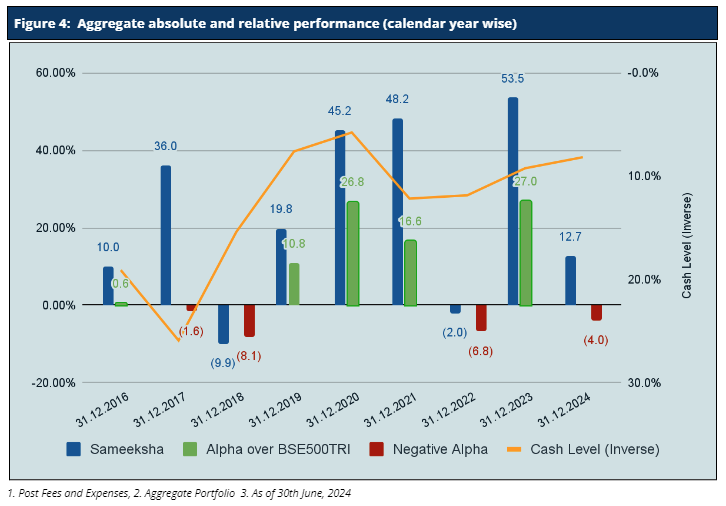
It is important to note that we delivered this alpha despite maintaining an average cash level of 13% across the nine financial years.
Cumulative Performance versus the benchmark
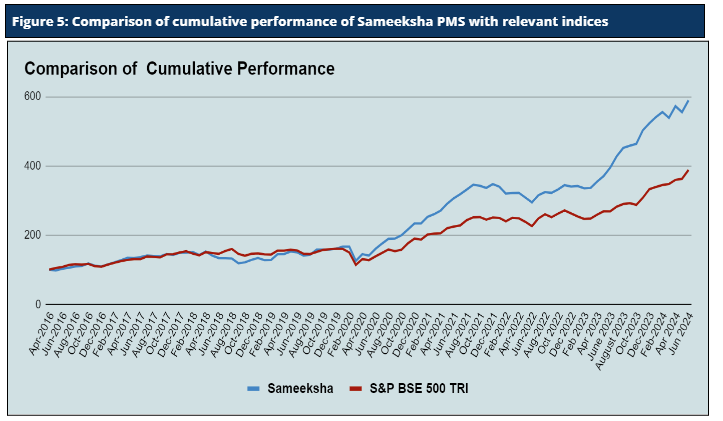
Sameeksha PMS’s outperformance over its benchmark has continued to widen positively over the years. An investment of Rs. 100 with us since inception (April 2016) would have grown to Rs. 589 , far outpacing what one would have earned by investing in a fund that achieved benchmark returns (Figure 5).
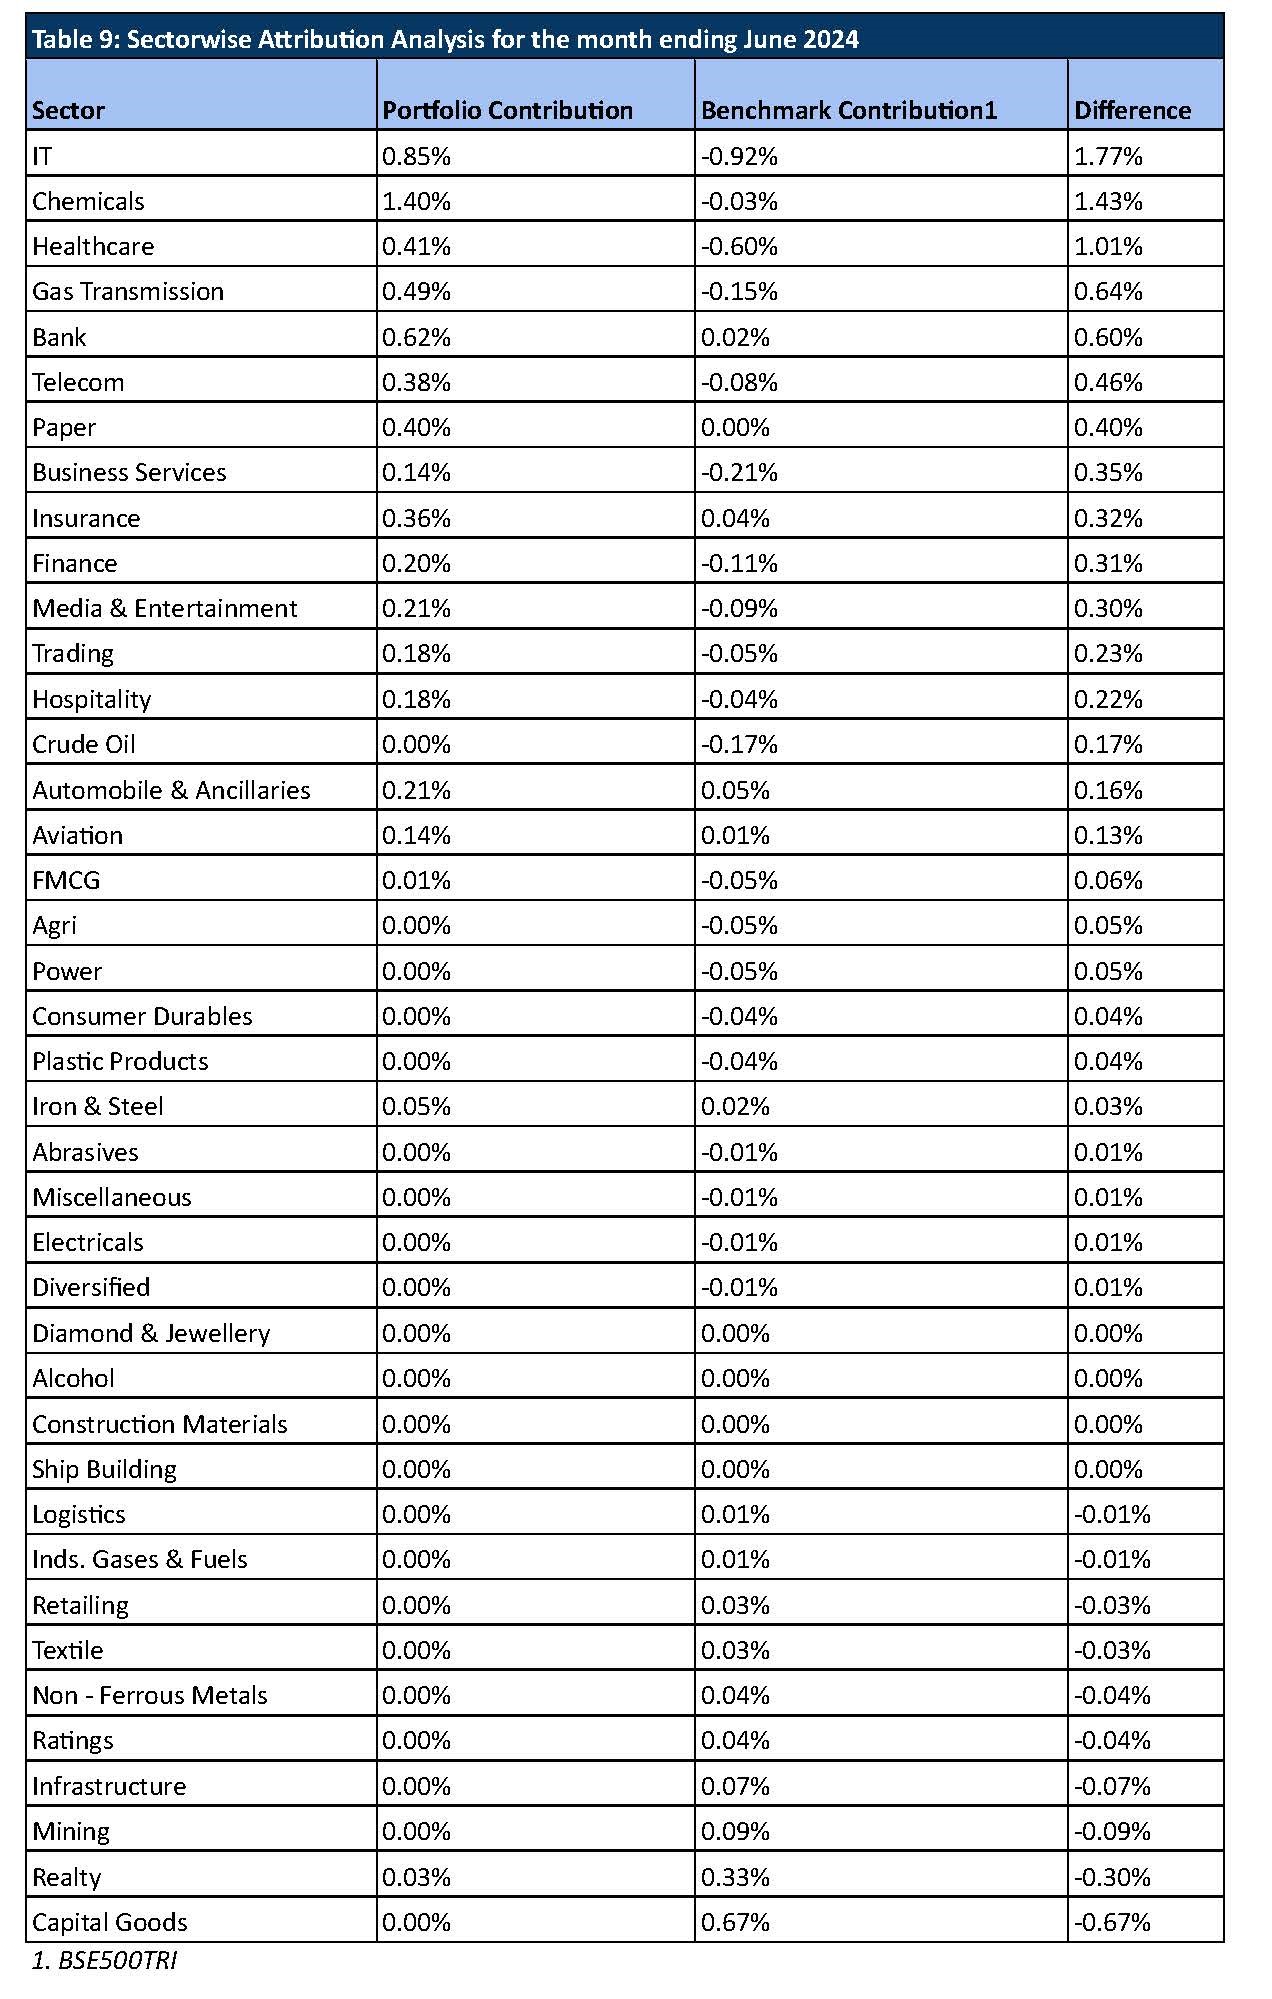
Analyzing the sector performance during the month
During the month, sectors that showed growth in the indices include Capital Goods and Realty sectors. For Sameeksha PMS, IT, Chemicals and Healthcare sectors was a major outperformer compared to the benchmark. However, what hurt us is the lack of exposure towards the Capital Goods and Realty sector where we missed out on participating in the upturn. Below is the attribution analysis for the month of June 2024 (Table 9).
AIF Performance and other details
Aggregate Fund Returns over various time periods
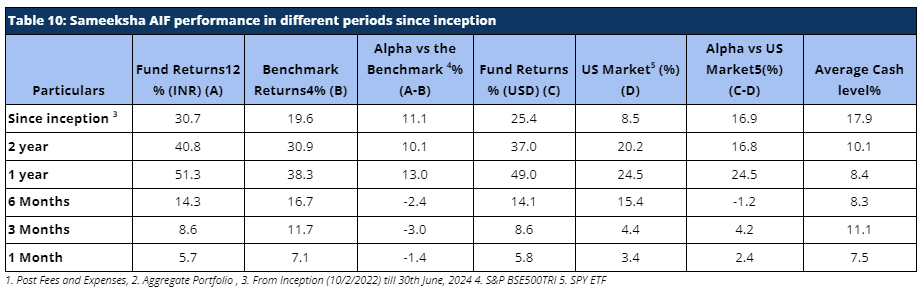
Since inception, we have maintained relatively higher levels of cash (18.3% on average over the entire period from inception) from time to time over the duration of managing the fund. Notwithstanding the same, from inception, over two years and over one year, we have generated returns of 30.7%, 40.8% and 51.3% in INR terms and 25.3%, 36.9% and 48.7% in USD terms beating the benchmark BSE500 TRI returns and ETF tracking S&P 500 index, respectively after fees before taxes. (Table 10).
Aggregate Fund Performance on a financial year and calendar year basis
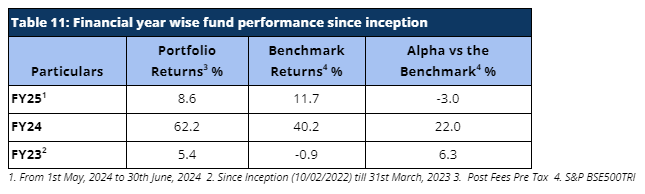
For the month of June, Sameeksha AIF has underperformed the benchmark BSE 500 TRI by generating 5.7% returns against the benchmark BSE500TRI returns of 7.05%. Looking at our performance over the financial years (Table 11), we have outperformed our benchmark in FY 2023 and FY 2024 and we will continue to outperform in the current FY 2025. Though for the financial year 2025 till date, we have positioned ourselves by underperforming the benchmark BSE500 TRI by 3.0%.
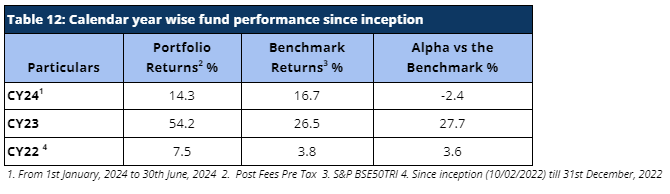
For the calendar year 2024, we have underperformed the benchmark BSE 500 TRI by 2.4%. Despite being a new fund, we were still able to produce alpha for calendar years 2022 and 2023 and outperformed the benchmark BSE500 TRI by 27.7% AND 3.6% respectively. (Table 12)
Risk Adjusted Ratios
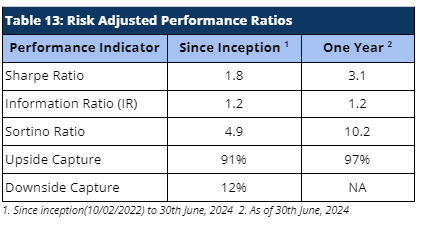
When compared on a risk adjusted basis, our AIF has shown an even stronger performance. The Information Ratio (IR) measures the excess return of a portfolio over a benchmark per unit of active risk. A higher Information Ratio (IR) suggests better risk-adjusted performance. The Sortino ratio measures the risk-adjusted return of an investment, focusing only on the downside risk. A higher Sortino ratio indicates better risk-adjusted returns, particularly with respect to downside risk.
Moreover, Upside Capture measures how well a fund performs as compared to a benchmark when the benchmark has positive returns. A higher upside capture ratio (> 100%) indicates that the fund captures more of the benchmark’s positive movements. Whereas, Downside Capture measures how well a fund performs compared to a benchmark when the benchmark has negative returns. A lower downside capture ratio (< 100%) indicates that the fund preserves capital better during market downturns.
Furthermore, other risk-adjusted returns – Sharpe ratio is also significantly higher (Table 13).
Performance within the AIF Universe
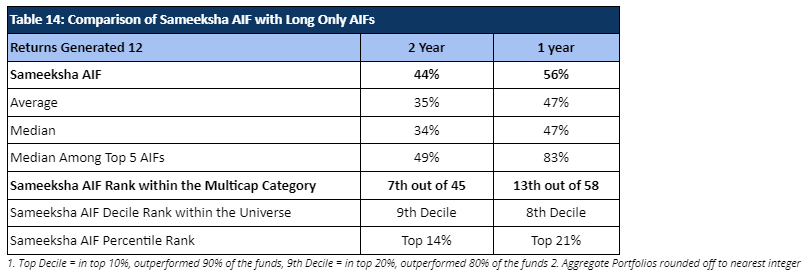
We present our rankings among Long Only Category III AIFs. For the period ending 30th June, 2024 , we are ranked 7th out of 45 AIFs for the two year period, or 9th Decile and 13th out of 58 AIFs for the one year period (Table 14), or 8th Decile. Because there is a lot of divergence in the way funds report their returns (post exp & tax; post exp, pre tax; gross returns; and post exp & tax pre perf. fees & tax) , we are doing comparison on a gross return basis to cover the entire applicable universe of funds.
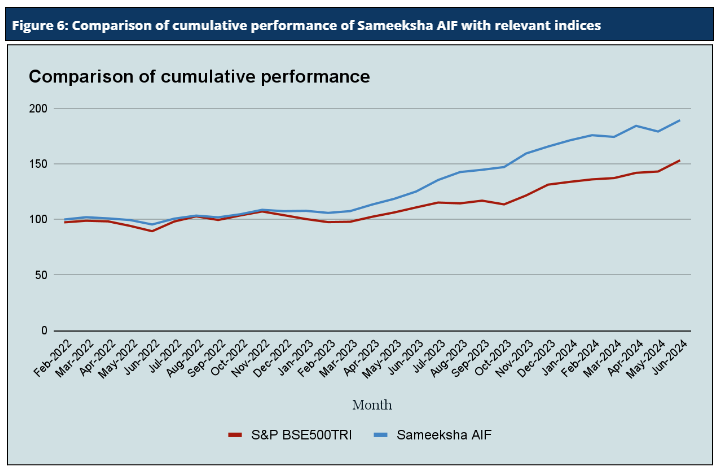
Cumulative Performance versus the benchmark
Sameeksha AIF’s outperformance over its benchmark has continued to widen positively since inception. An investment of Rs. 100 with us since inception (Feb 10,2022) would have grown to Rs. 189, far outpacing what one would have earned by investing in a fund that achieved benchmark returns (Figure 6).
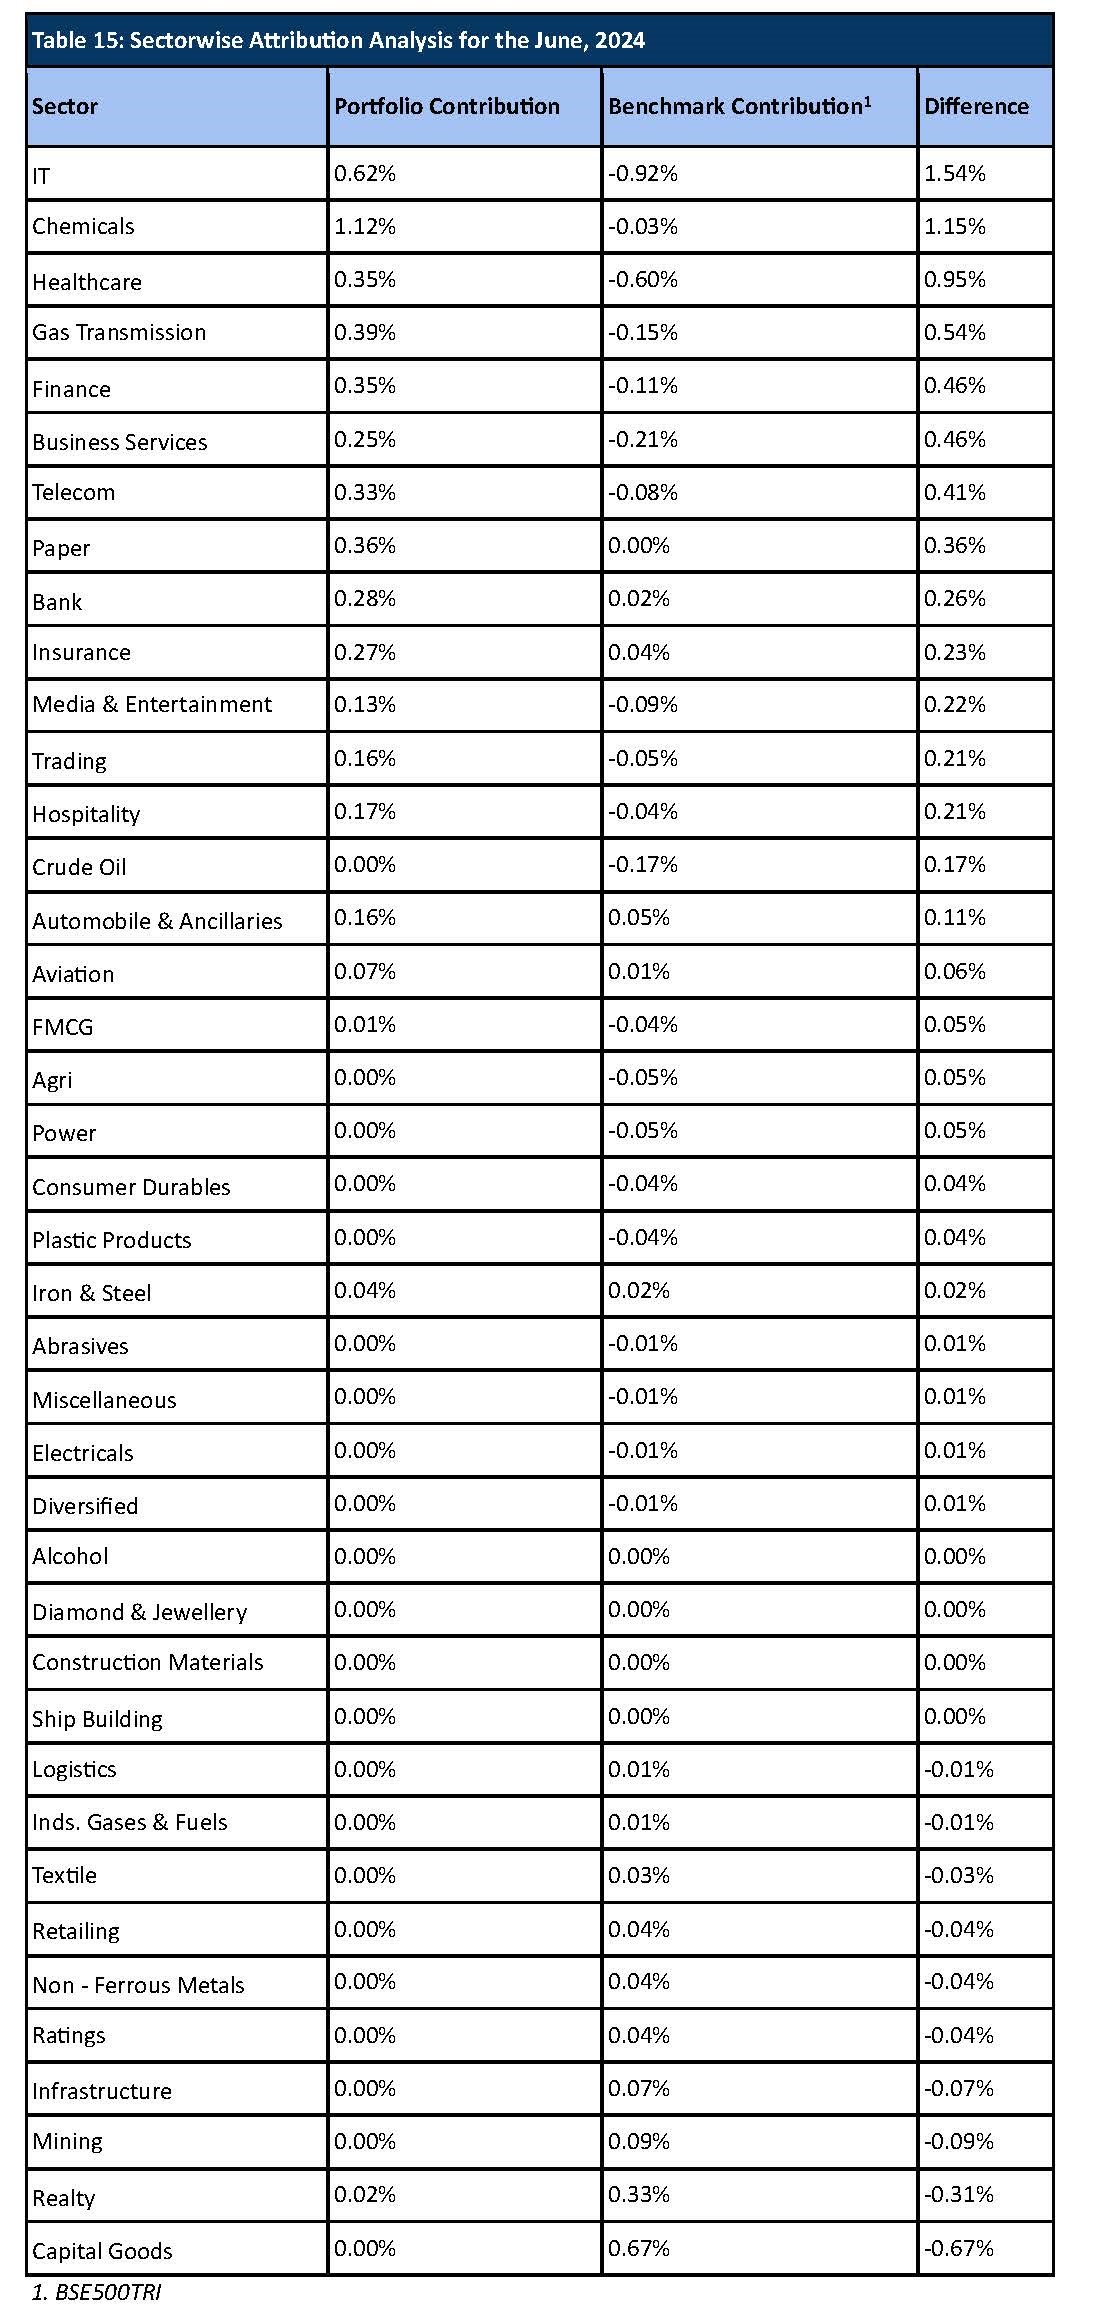
Analyzing the sector performance during the month
During the month, sectors that showed growth in the indices include Mining, Capital Goods and, Realty. For Sameeksha AIF, IT, Healthcare, Gas Transmission and Chemicals sectors were major outperformers compared to the benchmark. However, what hurt us is the lack of exposure towards the Capital Goods and Realty sectors where we missed out on participating in the upturn. Below is the attribution analysis for the month of June 2024 (Table 15).
Disclaimer – The information contained in this update is provided by our fund accounting platform and is not audited. This document is for informational purposes only and is not intended for solicitation to residents of the United States or any other jurisdiction which would subject Sameeksha Capital or its affiliates to any registration requirement within such jurisdiction or country. It does not constitute an offer to buy or sell securities or financial instruments. Recipients are advised to conduct their own research and seek professional advice before making any investment decisions.