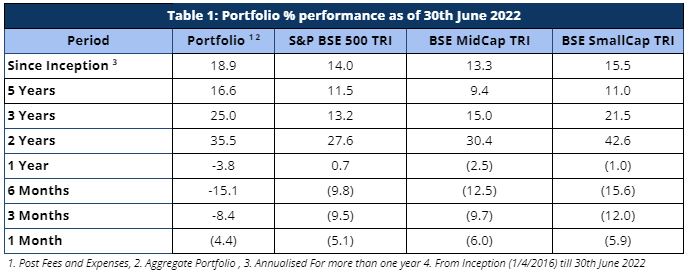
Broader markets remained volatile and mostly bearish throughout the month of June 2022 with a weak performance by benchmark BSE500 TRI that returned -5.08% whereas BSE Midcap TRI (-6%) and BSE SmallCap TRI (-5.9%) suffered more. Notwithstanding ~48% exposure to small and midcap in the fund versus ~21% in the benchmark, Sameeksha PMS has marginally outperformed the benchmark BSE500 TRI, though negative returns are nothing to write home about.
Notwithstanding weak performance over the last one year, we continue to rank among the best for the long term performance. For the five year period as well, we are ranked 3rd out of 62 multicap PMSes. For the three year period ending June 2022, we are ranked 8th out of 104 multicap PMSes reporting to PMS Bazaar.
As defined by our strategy, we have maintained relatively higher levels of cash (13.1% on average over the entire period from inception) from time to time over the duration of managing the portfolio. Notwithstanding the same, from inception as well as over five and three years respectively, we have generated returns of 18.9%, 16.6% and 25.0% beating the benchmark BSE500 TRI returns of 14.0%, 11.5% and 13.2% respectively.
Portfolio Returns
Broader markets had a down month in June 2022 with a return of -5.08%. We had a down month as well, however we were able to choke out small alpha for the month with absolute returns of -4.44%, an alpha of 0.64% over our benchmark BSE500 TRI. While we managed to beat the benchmark BSE 500 TRI for this month, we have underperformed the index in the last one year. Throwing light on our average performance, we have discussed our performance for the last financial year in our annual investor letter, including what did and did not work well for us, and our outlook on the Indian market.
Notwithstanding weak performance over the last one year, we have outperformed our benchmark index across all the other relevant key periods as can be observed in Table 1.
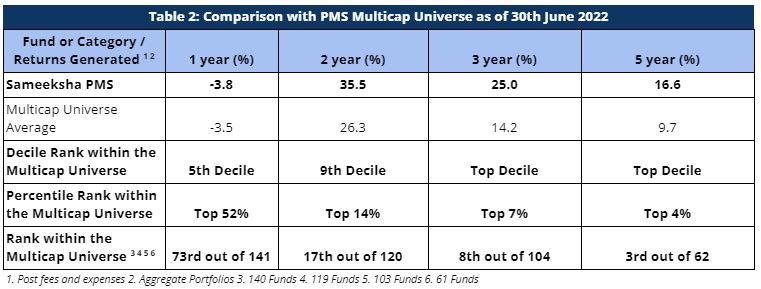
Performance within the PMS Universe
We continue to maintain our top rankings both within the multicap PMS universe as well as the entire PMS universe for key periods of three and five years. The multicap PMS universe rankings are more relevant to us since we follow multicap strategy.
For the three year period, we are ranked 8th out of 104 PMSes. Further, we are ranked 3rd out of 62 funds for the five year period comparison within the Multicap universe – highlighting our superior performance over the long term (Table 2).
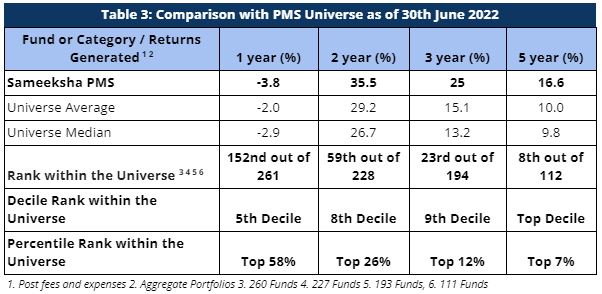
When compared with the entire PMS universe, we have maintained top rankings for longer key periods. We are ranked 23rd out of 194 PMSes for the three year period and 8th out of 112 PMSes for the five year period (Table 3).
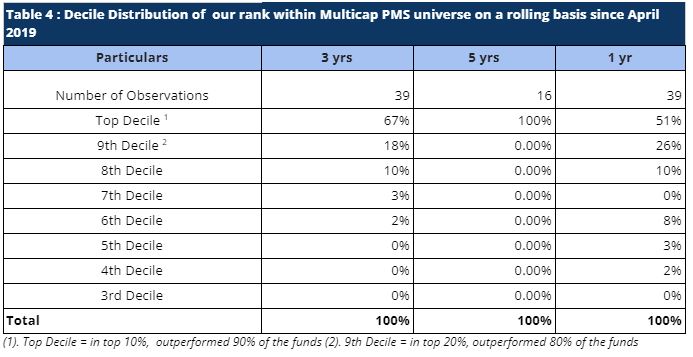
Rolling Returns and Rankings
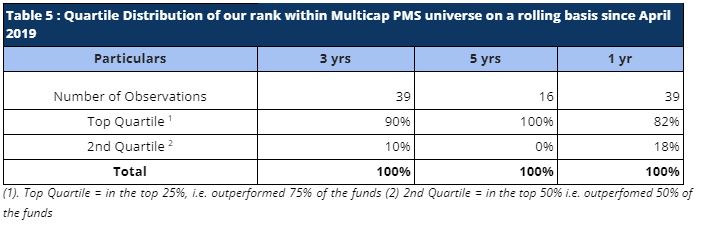
Rolling returns are a more useful indicator of consistency in performance versus single period returns. For the rolling three year periods applicable for our entire operating history, we have been ranked among the multicap universe in the top decile 67% of the time (26 out of 39 observations) and in top Quartile 90% of the time (35 out of 39 observations). For the remaining 10% observations, we were ranked in the second quartile (Tables 4 and 5). Also, for the three year period, we have remained in top decile every single month on a consecutive basis for almost two years since July 2020. Similarly, for the rolling five year periods applicable for our entire operating history, we have been ranked among the multicap universe in the Top Decile 100% of the time (16 out of 16 observations).
Performance Of Individual Portfolios
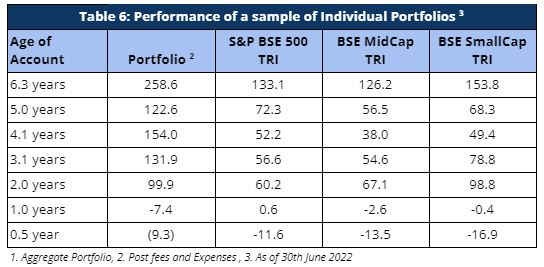
Portfolio returns for clients, except for investors starting with us over the last one year have seen remarkably strong alpha (Table 6). Performance of portfolios of clients who joined us in the last one year is a matter of concern that we hope to be able to address over time. We have discussed in detail about our average performance in the last one year in our annual investor letter.
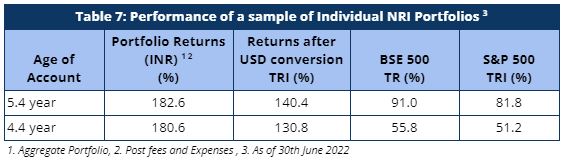
Our NRI clients have seen strong returns even after factoring in rupee depreciation against US dollars. The portfolio returns are significantly higher than both BSE 500 TRI and S&P 500 TRI, generating strong alpha over both these indices (Table 7).
Cumulative Performance versus the benchmark
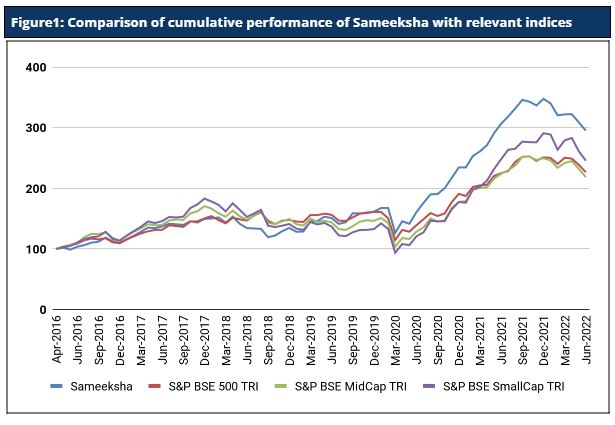
Sameeksha’s outperformance over its benchmark has continued to widen positively over the years. Even after factoring in the underperformance and the volatile market in the last one year, an investment of Rs. 100 with us since inception (April 2016) would have grown to Rs. 295, far outpacing what one would have earned by investing in a fund that achieved benchmark returns (Figure 1).
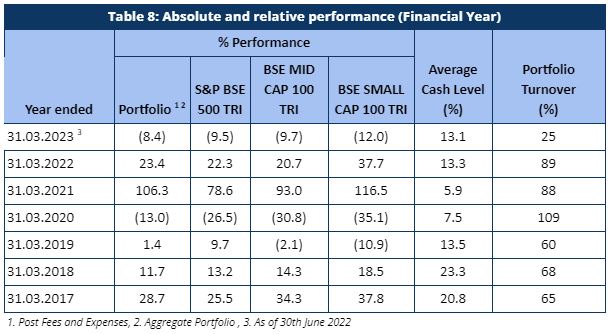
Fund Performance on a Financial Year and Calendar Year basis
For the first 3 months of the current financial year ending March 2023 (April 2022 to June 2022), Sameeksha PMS marginally outperformed the benchmark BSE 500 TRI by generating -8.4% returns against the benchmark -9.5% returns (Table 8).
Looking at our performance over the financial years, we have outperformed our benchmark in five out of six financial years (including the current incomplete year). Key however is that the sum of outperformance in those five years far exceeds the sum of underperformance in the remaining two years.
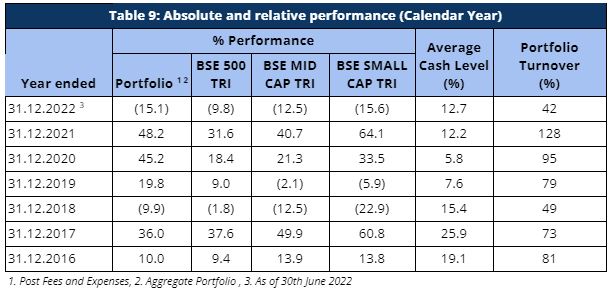
The performance pattern on a calendar year basis has been quite similar as well (Table 9). Although, for the current calendar year 2022, we are underperforming the benchmark, for the recently completed calendar year ending 2021, we have generated a return of 48.2% with an alpha of 16.6% over our benchmark BSE 500 TRI.
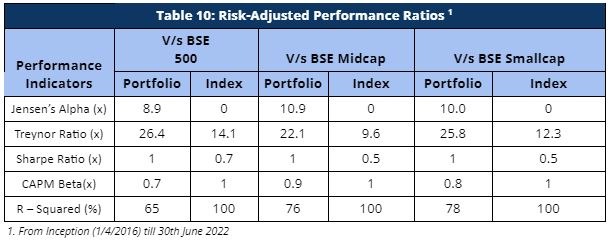
Risk Adjusted Ratios
When compared on a risk-adjusted basis (Table 10), our PMS shows even stronger performance with a risk-adjusted alpha generation of 8.9% over the broad market benchmark since its inception. While our portfolio beta has been materially lower than our benchmark, our returns have been higher than the benchmark since inception, implying superior strong risk adjusted returns.
Furthermore, other risk-adjusted returns – Sharpe ratio and Treynor ratio, are also significantly higher than the benchmark indices (Table 10). It is worth noting that we offer superior risk adjusted returns not only compared to the broad BSE 500 index heavily weighted towards large cap but also the small cap and mid cap benchmarks as demonstrated by our Sharpe ratio, Alpha, Treynor ratio and Beta.
Disclaimer : The information contained in this update is based on data provided by our fund accounting platform and is not audited