The first month of the calendar year 2023 produced sharp negative returns for the market, with much of the drop occurring post the report on Adani group published by a US based outfit. Unabated offloading of shares by foreign institutional investors (FII) at the fag end of January 2023 kept the market on edge. As a result, the broader indices BSE500 TRI, BSE Midcap TRI and BSE smallcap plunged -3.34%, -2.63%, -2.48% respectively in January. We managed to have a positive month, generating returns of 0.4% (net of all fees and expenses).
Notwithstanding persistent inflation and continuing war, there are enough reasons to be optimistic about India’s economic outlook in 2023. In particular, we expect that healthy domestic drivers will likely help the country post reasonably strong growth this year. Furthermore, high goods and services tax (GST) and direct tax collections have provided the government ammunition to spend and cushion the impact of the impending global slowdown and keep the economy buoyant. The Indian government’s budget for FY 23-24 indicates strong focus on infrastructure spending and curtailing growth in spending that can be inflationary. Consumer demand among the affluent class remains strong as is evident from the robust growth in the retail industry. Also, recent labor market data suggests a strong rise in labor force participation and job creation in certain sectors. However, job growth has to sustainably improve to translate into durable demand growth.
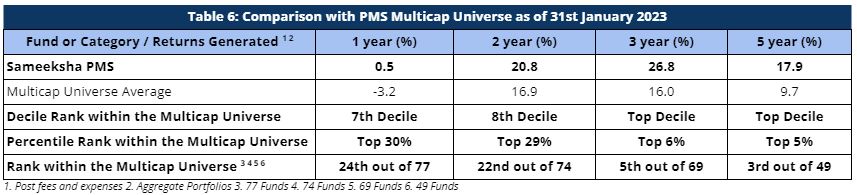
For the period ending 31st January 2023, among the multicap PMS universe with Asset Under Management (AUM) of INR 100 crores and more tracked by PMS Bazaar, we ranked 3rd out of 49 multicap PMSes for the five year period ending January 2023. For the three year period ending January 2023, we are ranked 5th out of 69 multicap PMSes reporting to PMS Bazaar. Further, among the multicap PMS universe with AUM of INR 500 crores and more, we ranked 1st out of 26 multicap PMSes and 33 multicap PMSes for both five year period and three year period ending January 2023, respectively. Among the multicap universe (considering all AUM), we are ranked in the Top Decile for the five year period for all 23 out of 23 observations reflecting well on the consistency of our performance.
Moreover, in collaboration with India’s top ranked business school – IIM Ahmedabad, PMS AIF World has awarded us top 2 positions for performance for both five years as well as three years. This is done as a part of their Annual Smart Money Manager Awards 2023. At Sameeksha we strive for excellence in serving our customers while adhering to our core values of integrity, honesty and hard work. These awards are recognition of our efforts in that regard. While we have been writing every month about the consistency in delivering top decile performance on absolute as well as risk adjusted basis, we welcome the endorsement of the same from a very credible independent source doing objective and transparent analysis. It is heartening to see that an increasing importance is given to risk adjusted returns, not just pure returns by independent evaluators. For more details, please refer to this link.
Three important things must always be kept in mind when looking at performance data. First, for funds such as ours that do not follow model portfolio strategy, the performance of Individual clients for different duration is important to look at. Second, some PMSes may be charging fees outside the PMS and hence after fees, performance data may not be comparable to ours. Third, it is important to look at not only portfolio returns but also risk adjusted ratios. We provide data to address all three points later in this note.
Returns of Individual Portfolios
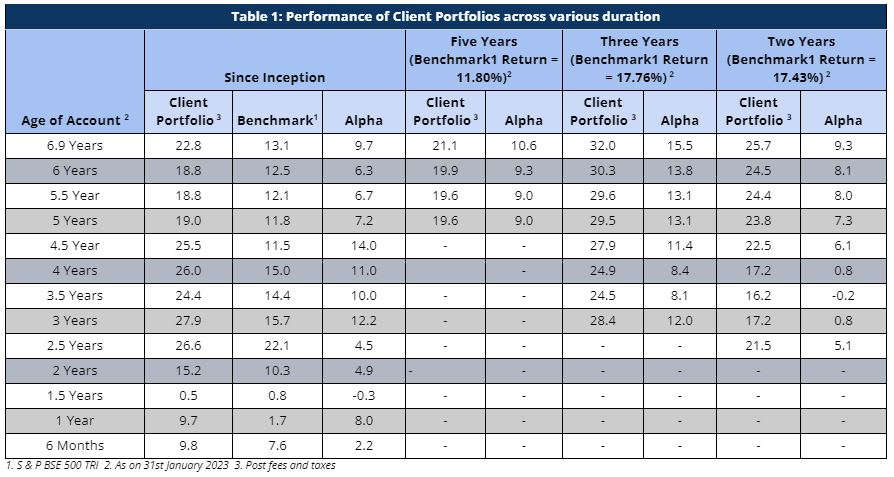
As stated earlier, because we don’t follow model portfolio strategy, the performance of individual clients is far more important than overall portfolio aggregate returns. For investors who are with us for 3 years and more, Sameeksha PMS has returned a very substantial alpha (outperformance over the benchmark) of anywhere between 6% and 20% with a median of 11% for the three year period ending 31st January 2023. Similarly, for investors who are with us for 5 years and more, we have returned a very substantial alpha of anywhere between 6% and 11% with a median alpha of 9% for the five year period ending 31st January 2023
Portfolio returns for clients, except for investors starting with us between the period of one year to 18 months ago, have been remarkably strong (Table 1).
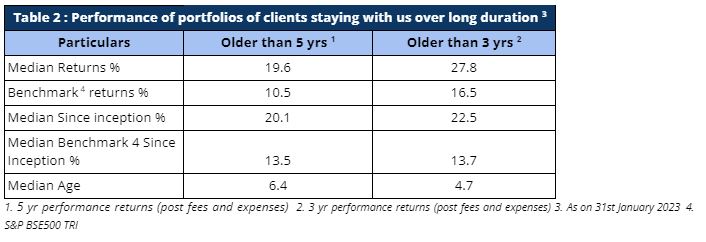
Long term investors, mainly investor accounts older than 5 years and 3 years, have carved out strong alpha, thereby proving Sameeksha PMS to be a valuable partner for their investments (Table 2).
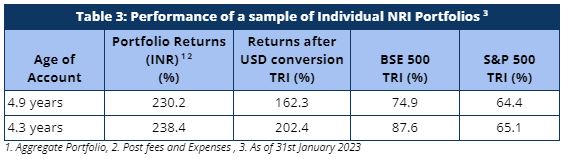
Our NRI clients have also seen strong returns even after factoring in rupee depreciation against US dollars. The portfolio returns are significantly higher than both BSE 500 TRI and S&P 500 TRI, generating strong alpha over both these indices (Table 3)
Aggregate Portfolio Returns
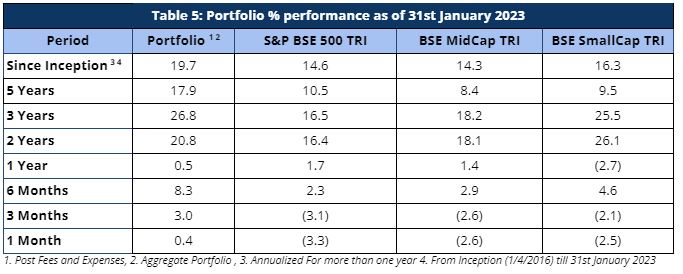
It is important to note that we have maintained relatively higher levels of cash (14% on average over the entire period from inception) from time to time over the duration of managing the portfolio. Notwithstanding the same, from inception as well as over five and three years respectively, we have generated returns of 19.7%, 17.9% and 26.8% beating the benchmark BSE500 TRI returns of 14.6%, 10.5% and 16.5% respectively after fees and expenses. Before deducting fees and expenses, we have generated returns of 20.9%, 19.1% and 28.6% for the period from inception (~6.9 years), five years and three years respectively.
For this month, the broader markets ended negative at -3.34%. BSE Midcap TRI and BSE Smallcap TRI returned -2.63% and -2.48% respectively.
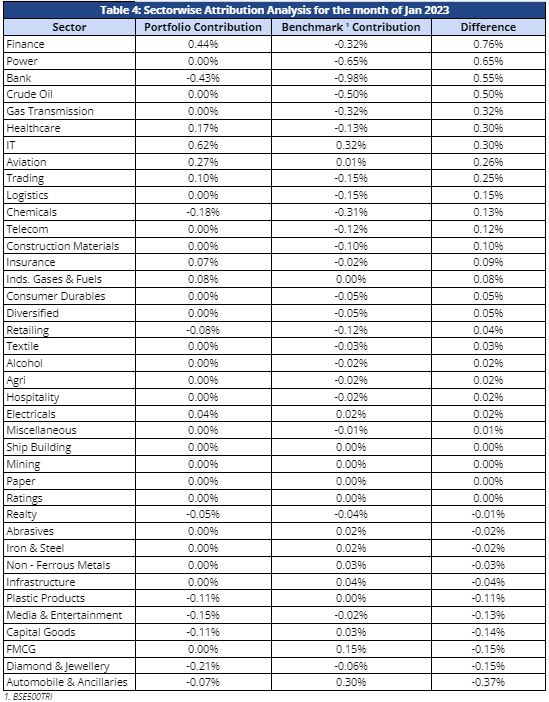
During the month, our lack of exposure towards sectors directly related to Crude Oil and Power benefited us. The Finance sector was an outperformer for us, whereas the benchmark contributed negatively. This was also the case with Banking, Healthcare, Aviation and IT sectors in which we delivered outperformance. However, what hurt us is the underperformance of the Media & Entertainment, Auto, and FMCG sectors where the benchmark contributed positively while our portfolio contributed negatively. Below is the attribution analysis for the month of January 2023 (Table 4).
For longer periods where the outperformance is much more meaningful, we have strongly outperformed our benchmark index across all the relevant key periods (Table 5).
Performance within the PMS Universe
We continue to maintain our top rankings both within the multicap PMS universe as well as the entire PMS universe for key periods of three and five years. The multicap PMS universe rankings are more relevant to us since we follow the multicap strategy.
In the interest of a fair comparison, we present our rankings among those multicap PMSes with AUM more than INR 100 crs. For the three year period, we are ranked 5th out of 69 PMSes. Further, we are ranked 3rd out of 49 PMSes for the five year period comparison within the multicap universe – highlighting our superior performance over the long term (Table 6).
Fund Performance on a Financial Year and Calendar Year basis
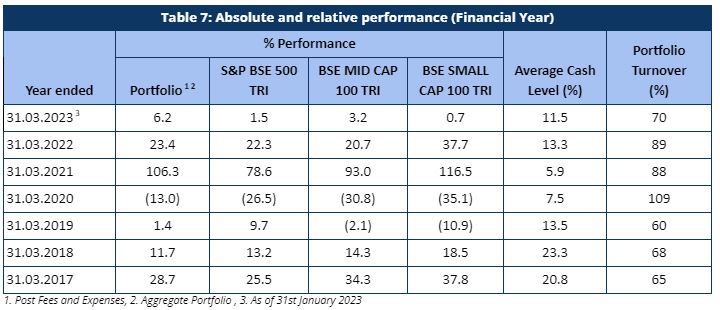
For the first 10 months of the current financial year ending March 2023 (April 2022 to January 2023), Sameeksha PMS has overperformed the benchmark BSE 500 TRI by generating 6.2% returns for the period against the benchmark 1.5% returns (Table 7).
Looking at our performance over the financial years, we have outperformed our benchmark in five out of seven financial years (including the current incomplete financial year). Key however is that the sum of outperformance of 50% in those five years far exceeds the sum of underperformance of 10% in the remaining two years.
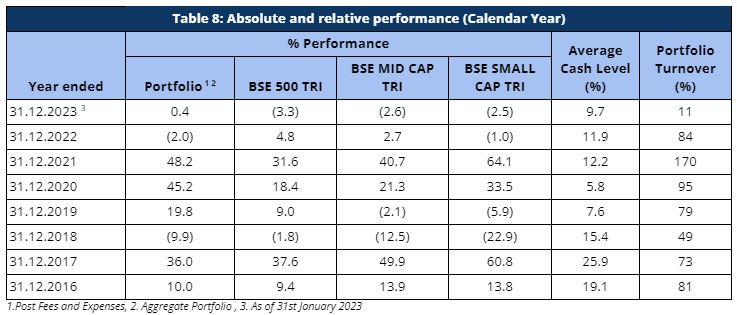
For the first month of the calendar year 2023, we have positioned ourselves well by outperforming the benchmark BSE500 TRI by 3.7%. However, for the completed calendar year 2022, we have underperformed the benchmark BSE500 TRI by 6.8% (Table 8). This can be mainly attributed to the onset of the Ukraine-Russia war at the start of the calendar year and the ensuing global economic crisis. Nonetheless, we have taken corrective actions since then and we hope to have a good calendar year 2023 with a positive start this month.
Rolling Returns and Rankings
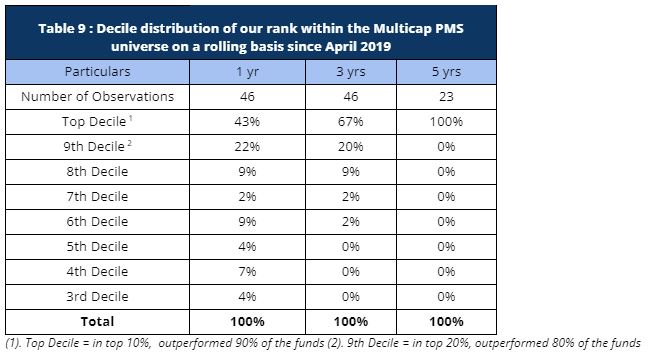
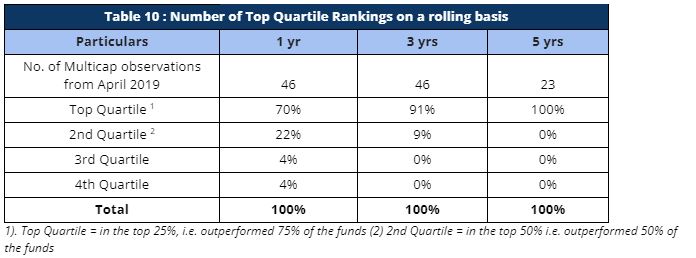
Rolling returns are a more useful indicator of consistency in performance versus single period returns. For the rolling three year periods applicable to our entire operating history, we have been ranked among the multicap universe in the Top Decile 67% of the time (31 out of 46 observations) and in the Top Quartile 91% of the time (42 out of 46 observations). For the remaining 9% observations, we were ranked in the Second Quartile (Tables 9 and 10). For the rolling five year periods applicable for our entire operating history, we have been ranked among the multicap universe in the Top Decile 100% of the time (23 out of 23 observations).
Cumulative Performance versus the benchmark
Sameeksha’s outperformance over its benchmark has continued to widen positively over the years. An investment of Rs. 100 with us since inception (April 2016) would have grown to Rs. 342, far outpacing what one would have earned by investing in a fund that achieved benchmark returns (Figure 1).

Risk Adjusted Ratios
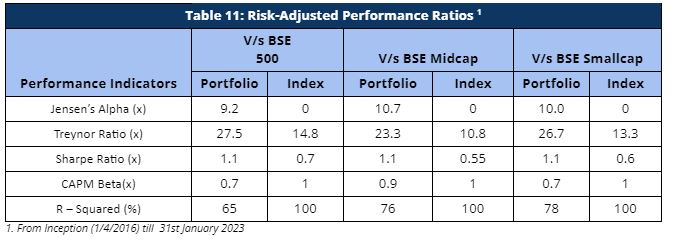
When compared on a risk-adjusted basis, our PMS shows even stronger performance with a risk-adjusted alpha generation of 9.2% over the broad market benchmark since its inception. While our portfolio beta has been materially lower than our benchmark, our returns have been higher than the benchmark since inception, implying superior strong risk adjusted returns.
Furthermore, other risk-adjusted returns – Sharpe ratio and Treynor ratio, are also significantly higher than the benchmark indices (Table 11). It is worth noting that we offer superior risk adjusted returns not only compared to the broad BSE 500 index heavily weighted towards large cap but also the small cap and mid cap benchmarks as demonstrated by our Sharpe ratio, Alpha, Treynor ratio and Beta.
Disclaimer : The information contained in this update is provided by our fund accounting platform and is not audited