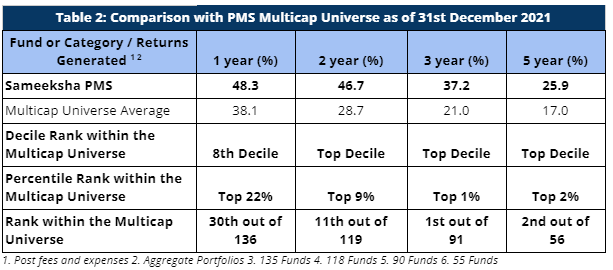
We continue to rank among the best for the long term performance. For the three year period ending December 2021, we are ranked 1st out of 91 multicap PMSes reporting to PMS Bazaar. For the five year period as well, we are ranked 2nd out of 56 multicap PMSes.
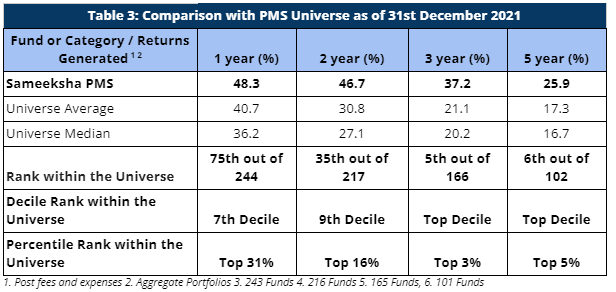
Though a strong rally in small and mid cap stocks over the last 21 months have greatly aided performance of the small and mid cap focussed PMSes (which form a substantial fraction of the PMS universe), we still rank among the best across the entire PMS universe tracked by PMS Bazaar. We are ranked 5th out of 156 PMSes for the three year period and 6th out of 102 PMSes for the five year period.
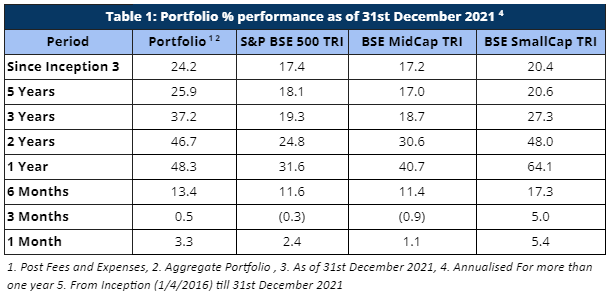
As defined by our strategy, we have maintained relatively higher levels of cash (14.3% on average over the entire period from inception) from time to time over the duration of managing the portfolio. Notwithstanding that, from inception as well as over five and three years respectively, we have generated returns of 24.2%, 25.9% and 37.2% versus the benchmark BSE500 TRI returns of 17.4%, 18.1% and 19.3%. Most importantly, clients investing with us across extended time periods have enjoyed meaningful alpha irrespective of the time of their entry.
Portfolio Returns
Despite going through a healthy correction earlier in the month, broader markets ended on a strong note in December 2021 with small-caps rallying significantly (Table 1) for the month. We had another healthy month both on an absolute (up 3.3%) and relative basis despite maintaining cash levels in the high teens, with an alpha generation of 0.9% over our benchmark BSE500 TR’s returns of 2.4% . As can be observed in Table 1, we have strongly outperformed our benchmark index across all the relevant key periods. With small caps forming only a small part of our portfolio, we have underperformed the small-cap index over the last year.
Performance within the PMS Universe
We continue to maintain our top rankings both within the multicap PMS universe as well as the entire PMS universe. The multicap PMS universe rankings are more relevant to us since we follow multicap strategy.
For the three year period, we are ranked number 1 out of 91 PMSes. In the same vein, we are ranked 2nd out of 56 funds for the five year period comparison within the Multicap universe – highlighting our superior performance over the long term.
Strong performance in mid and small-cap stocks for most part of the year has enabled PMSes focussed on those categories to deliver strong one-year performance. However, over longer periods of three and five years, we have retained our top decile position when compared with the entire PMS universe (Table 3). We are ranked 6th out of 102 funds based on five-year data and 5th out of 166 funds for three-year data.
Comparison of Rolling Returns with other funds
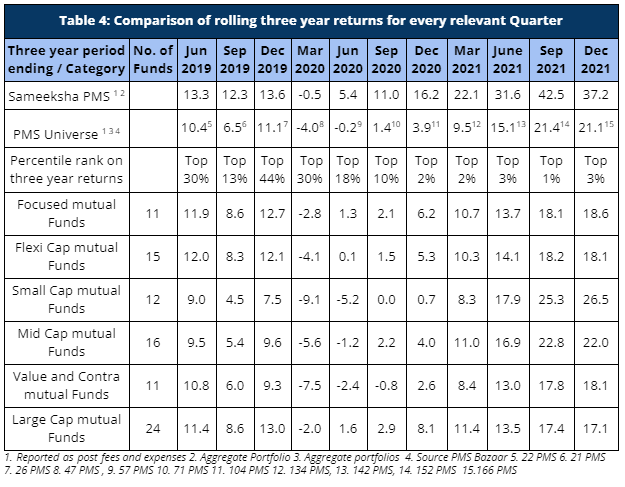
Rolling returns provide a much better comparison than a snapshot of one period. We continue to come out extremely well on this measure on a three-year basis when compared to the PMS universe as well as relevant categories of mutual funds – focused, flexi-cap, small-cap, mid-cap, value, and contra funds (Table 4). We have continued to maintain our top decile ranking across both our comparable universe of Multicap PMSes as well as across the entire PMS universe.
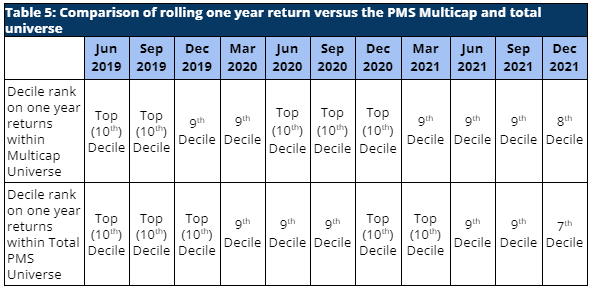
Similarly, our rolling one-year returns have been strong as well and we have maintained our rankings in the top two deciles across the PMS universe over most part of the last two years (Table 5).
Performance Of Individual Portfolios
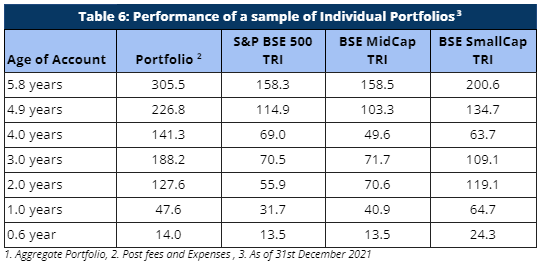
Irrespective of their investment timings, the portfolio returns of our clients continue to outpace the benchmarks by a significant margin (Table 6). Portfolio returns for clients who have been with us for longer periods have seen remarkably strong alpha. For a long term investor, Sameeksha PMS has proven to be a valuable partner for their investments.
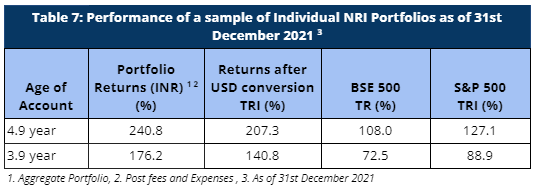
Similarly, our NRI clients have seen strong returns even after factoring in rupee depreciation against US dollars. The portfolio returns are significantly higher than both CNX 500 TRI and S&P 500 TRI, generating strong alpha over both these indices.
Cumulative Performance versus the benchmark
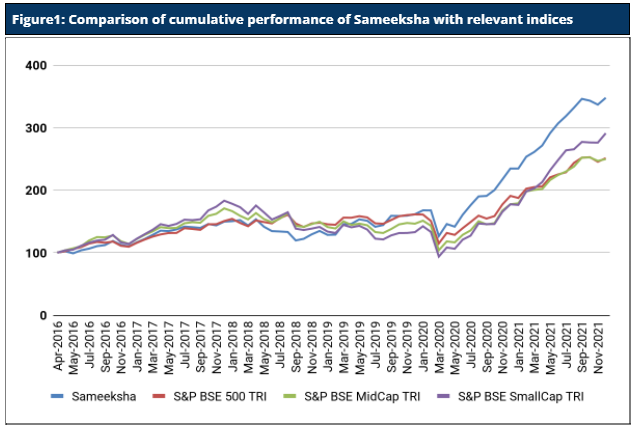
Sameeksha’s outperformance over its benchmark has continued to widen positively over the years. An investment of Rs. 100 with us since inception (April 2016) would have grown to Rs. 348, far outpacing what one would have earned by investing in a fund that achieved benchmark returns (Figure 1).
Fund Performance on a Financial Year basis
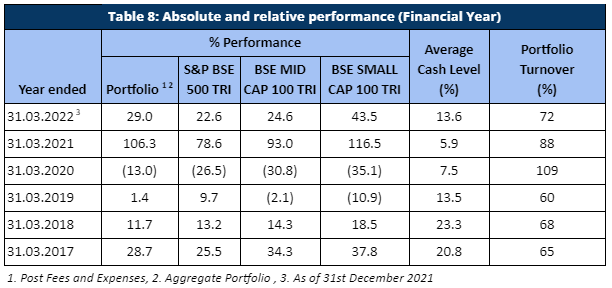
Sameeksha PMS generated a return of 29.0% in five months (April – December 2021) of the current financial year ending March 2022, outperforming its benchmark index BSE500 TRI – which returned 22.6% over the same period (Table 8). Discerning investors would notice that we have delivered this performance despite maintaining a meaningful percentage of our portfolio in cash from time to time and that is well reflected in our risk-adjusted-performance outcomes.
Looking at our performance over the financial years, it is evident that we have clearly out-performed our benchmark in four out of six financial years (including the current incomplete year). Key however is that the sum of outperformance in those four years far exceeds the sum of underperformance in the remaining two years. Also important is that after adjusting for cash exposure, we underperformed the benchmark only in one out of six years.
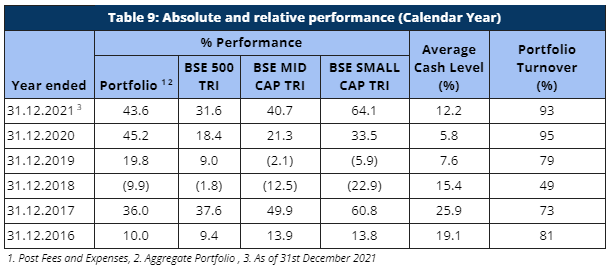
The performance pattern on a calendar year basis has been quite similar. (Table 9) For the just completed calendar year ending 2021, we have generated a return of 43.6% with an alpha of 12% over our benchmark BSE 500 TRI.
Underperformance against Small Cap in the last 12 months
We notice that while our performance over the last 12 months is materially superior relative to our benchmark, we are only among the top quartile within our multicap universe. We also acknowledge under performance relative to small cap index over the last one year (Figure 2).
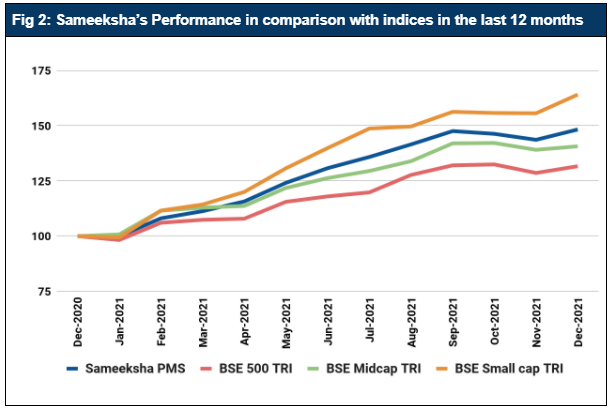
As a key risk management practice, we limit our exposure to small caps both in terms of position size as well as in terms of number of total positions in the portfolio. This approach has certainly caused us to under-perform the small cap index over the last one year. However, we are painfully aware of the havoc high exposure to small caps can cause when there is a correction in the overall market.
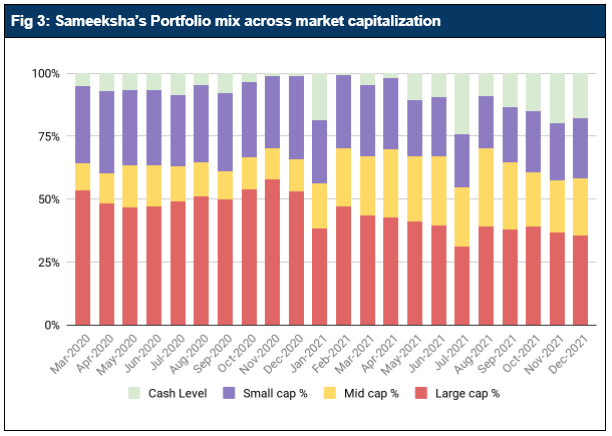
When comparing our portfolio mix across market capitalization since March 2020, our exposure to large cap has been considerably higher (40% to 50%) especially for the most part of 2020 (Figure 3). In addition, our cash levels increased in 2021 (average cash level of 12.2% for the year) owing to the prevailing market conditions.
Furthermore, during the last 20 months, the Small cap valuations remained far higher when compared on a historical basis. Valuation based on P/B was two SD (Standard Deviation) above median and the ratio of small cap to large cap valuation was almost three SD above median and within 10% of its highest value ever. On an absolute basis, we saw higher valuations for small cap only in the euphoric period of 2007.
As a result, our exposure to mid and small caps have been limited affecting our performance when compared to other mid and small cap PMSes which form a large part of the PMS universe.
We also analysed the sector contributions for CNX 500 in the last 12 months (Figure 4). The top contributors are IT and Financial Services sector with metals, power, consumer goods and automobiles being the key sectors.
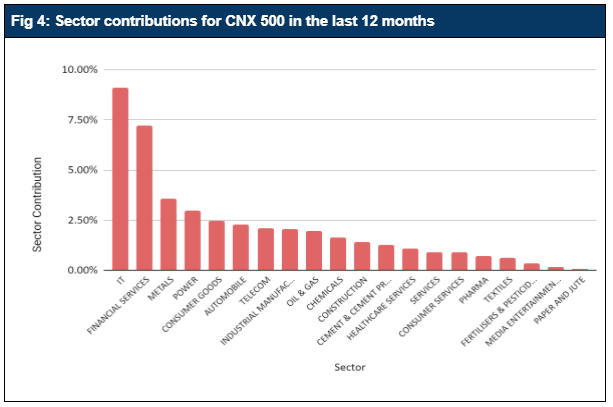
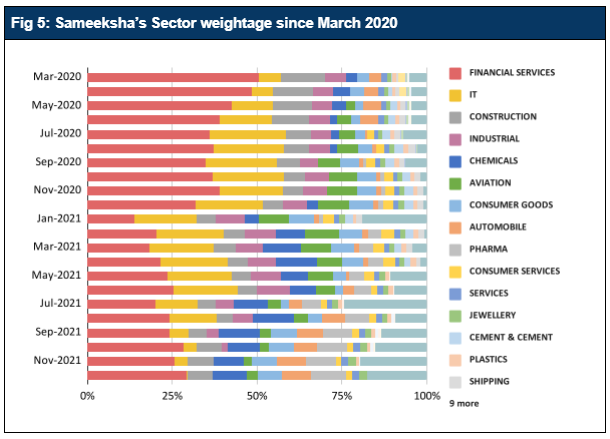
We are pleased to note our exposure to both Financial Services and IT sectors have been significant in the most part of the last two years (Figure 5). While the Metals and Power sectors have had a good rally, we did not participate in it – partly because we find the cyclical business of commodities difficult to enter at the right price and partly because as bottom up investors we did not find suitable ideas in these sectors which satisfied our stringent corporate governance criteria.
Overall, while we acknowledge our underperformance against mid and small caps, investors should note that our risk adjusted performance will show a far better picture considering our high cash levels as well as higher exposure to large caps.
Risk Adjusted Ratios
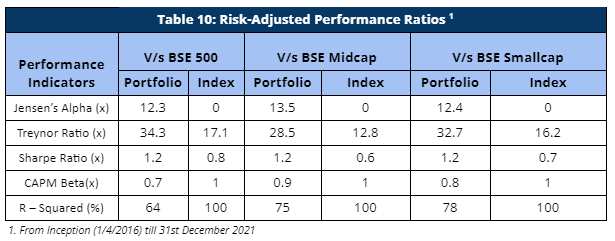
When compared on a risk-adjusted basis (Table 10), our PMS shows even stronger performance with a risk-adjusted alpha generation of 12.3% over the broad market benchmark since its inception.
Furthermore, other risk-adjusted returns – Sharpe ratio and Treynor ratio, are also significantly higher than the benchmark indices. It is worth noting that we offer superior risk adjusted returns not only compared to the broad BSE500 index heavily weighted towards large cap but also the small cap and mid cap benchmarks as demonstrated by our sharpe ratio, alpha, Treynor ratio and beta.
Please let us know if you have any questions.
Disclaimer : The information contained in this update is based on data provided by our fund accounting platform and is not audited.