* Period ending 28th February, 2025 ** Among multicap PMSes reporting to PMS Bazaar for five year period *** Five year Period
The Indian equity market has witnessed a sharp decline since the beginning of this calendar year, with the downward trend continuing through the end of February. In February, the benchmark S&P BSE 500 TRI dropped by 7.74%. Against that, Sameeksha PMS (Portfolio Management Service = Separately Managed Accounts) was down by 5% (net of all fees and expenses), indicating an outperformance of 2.74%; while having cash levels of 8.9% at start of the month and 12.1% at the end of the month. For the current financial year ending March 2025, our outperformance over our benchmark stood above 9% as of end of February 2025. Interestingly however, from having lagged the small cap indices for much of the current financial year, we have now started to meaningfully outperform the same. This improvement isn’t just in absolute terms but also in how we compared to other portfolios in the same space. Specifically, when compared to other multi-cap PMSes with an AUM above INR 100 crore, we’ve seen a noticeable rise in our ranking and are now in top five not just top decile. Additionally, when we benchmark our performance against the entire Multicap PMS universe, we rank in the top decile based on five-year returns.
Having said that, our portfolio has experienced an inevitable fall in value as well. However, we believe that falling inflation will put downward pressure on inflation and interest rates and with much anticipated relief in income tax, consumption may get a boost along with increase in government spending to revive the economic growth. We are also optimistic about crude oil remaining in a range and hence beneficial to India.
Since the market peak on September 26, 2024, Sameeksha has declined by approximately 10%. In comparison, the BSE 500 TRI is down about 18.7%, while the Nifty Small Cap 250 TRI Index has declined by 24.5% as of February 28, 2025. This relative outperformance despite having high exposure (~60%) to Small Cap underscores our disciplined investment approach and effective risk management amid market volatility. The same is reflected in our downside capture ratio, which stands at approximately 57%. We discuss our capture ratios in more detail later in this letter.
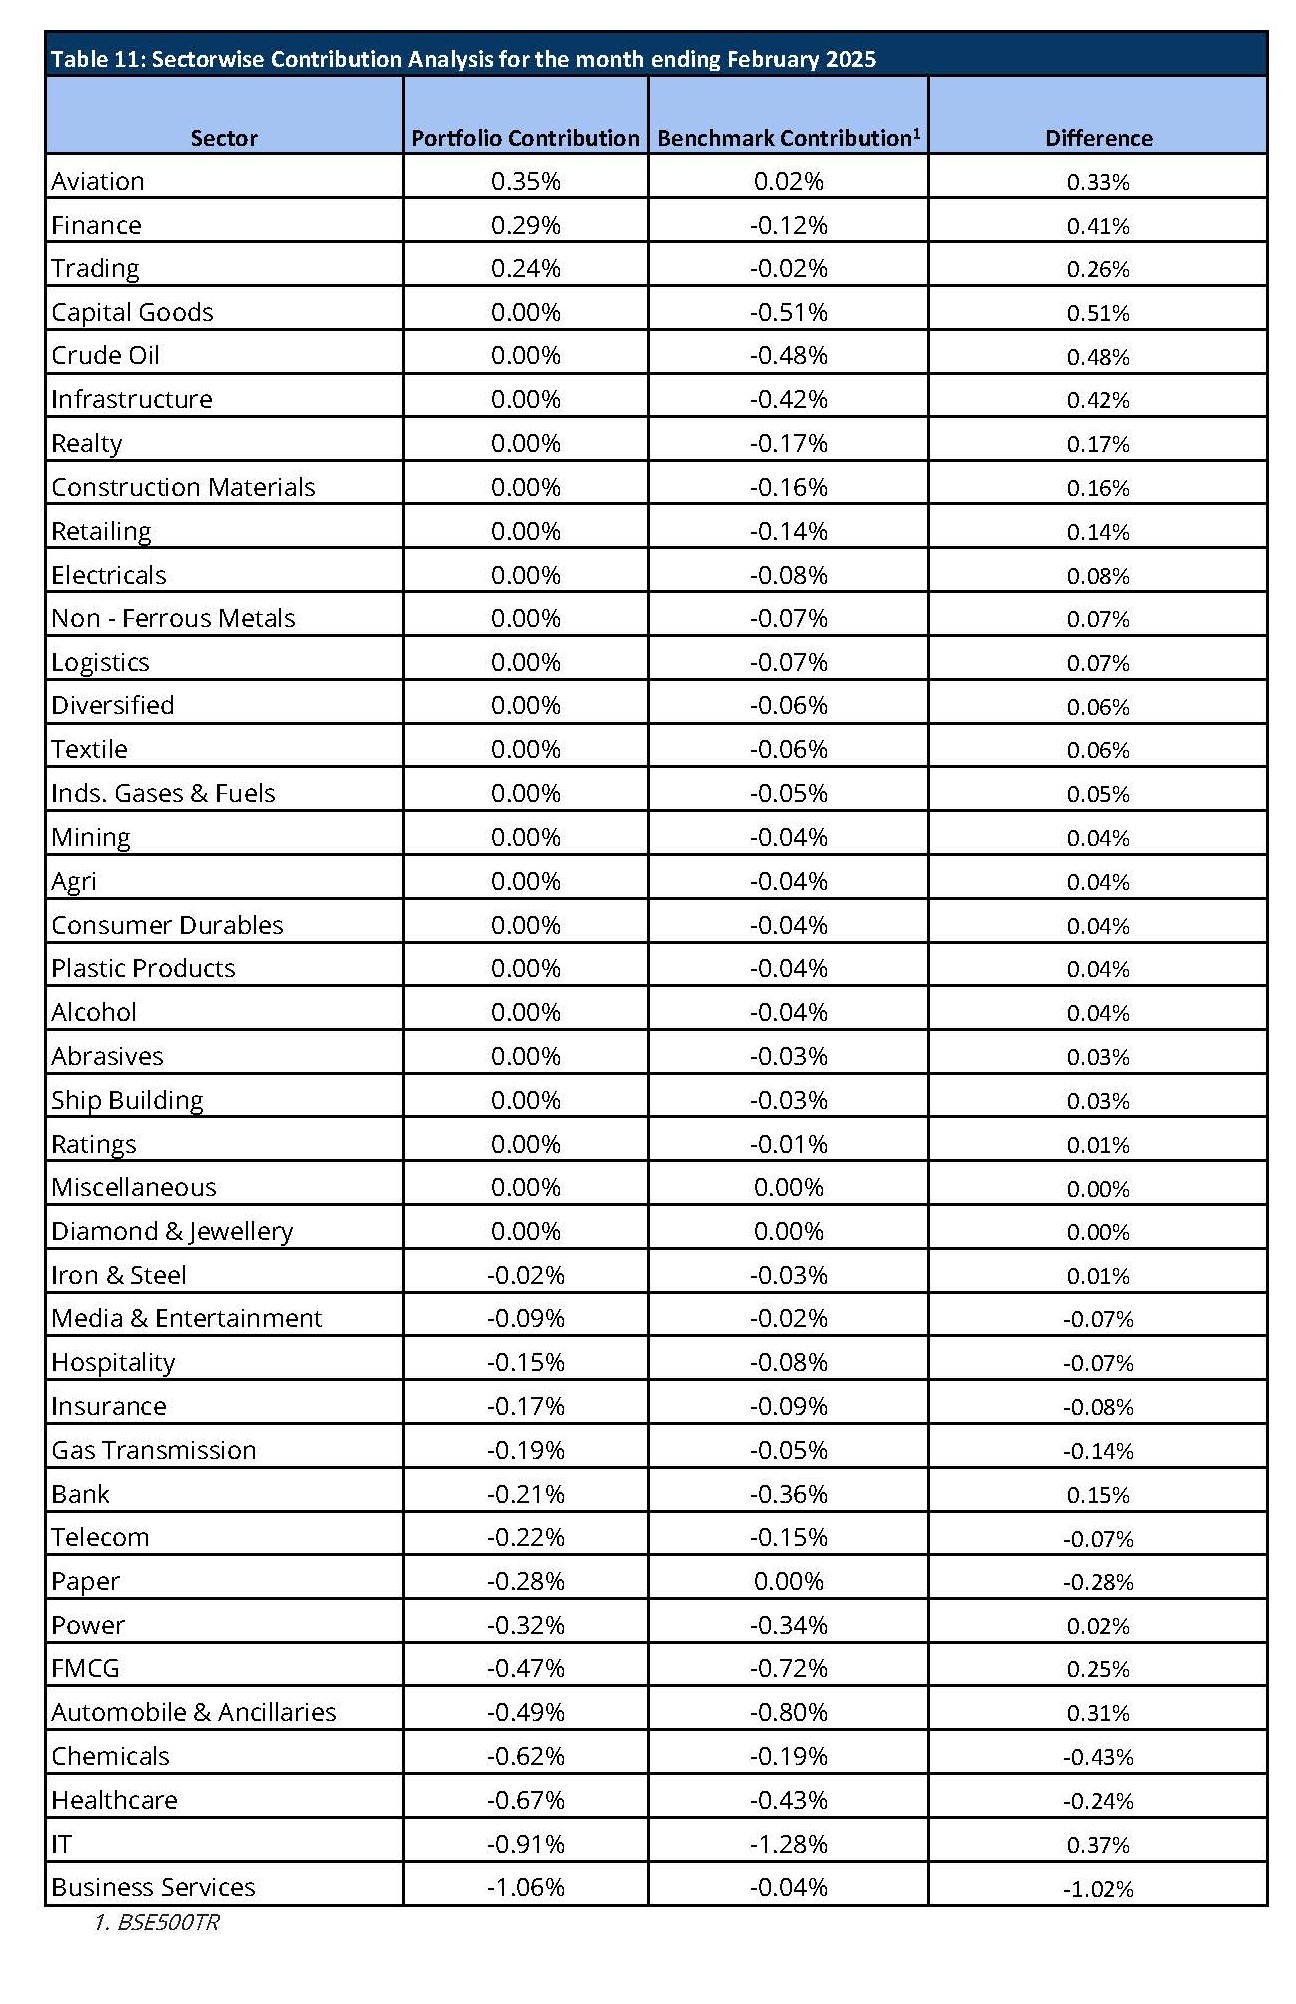
Sameeksha AIF (Alternative Investment Fund = “Hedge Fund”) was down by 4.4% (post fees and expenses), indicating an outperformance of 3.3% over the benchmark. Positive contributions came from the Finance, Aviation, Trading, with aviation leading the Contribution at 0.3%. However, this was partly offset by negative contributions from the Business Services, Healthcare and Chemicals sectors. We compare our performance with some of the highly recommended mutual funds. We have compared returns, Sharpe Ratio as well as upside and downside capture ratios.
We summarize key aspects of our performance as follows:
PMS Performance and other details
Three important things must always be kept in mind when looking at performance data. First, for funds such as ours that do not follow model portfolio strategy, the performance of individual clients for different duration is important to look at. Second, some PMSes may be charging fees outside the PMS and hence after fees, performance data may not be comparable to ours. Third, it is important to look at not only portfolio returns but also risk adjusted ratios. We provide data to address all three points later in this note.
Aggregate Portfolio Returns over various time periods
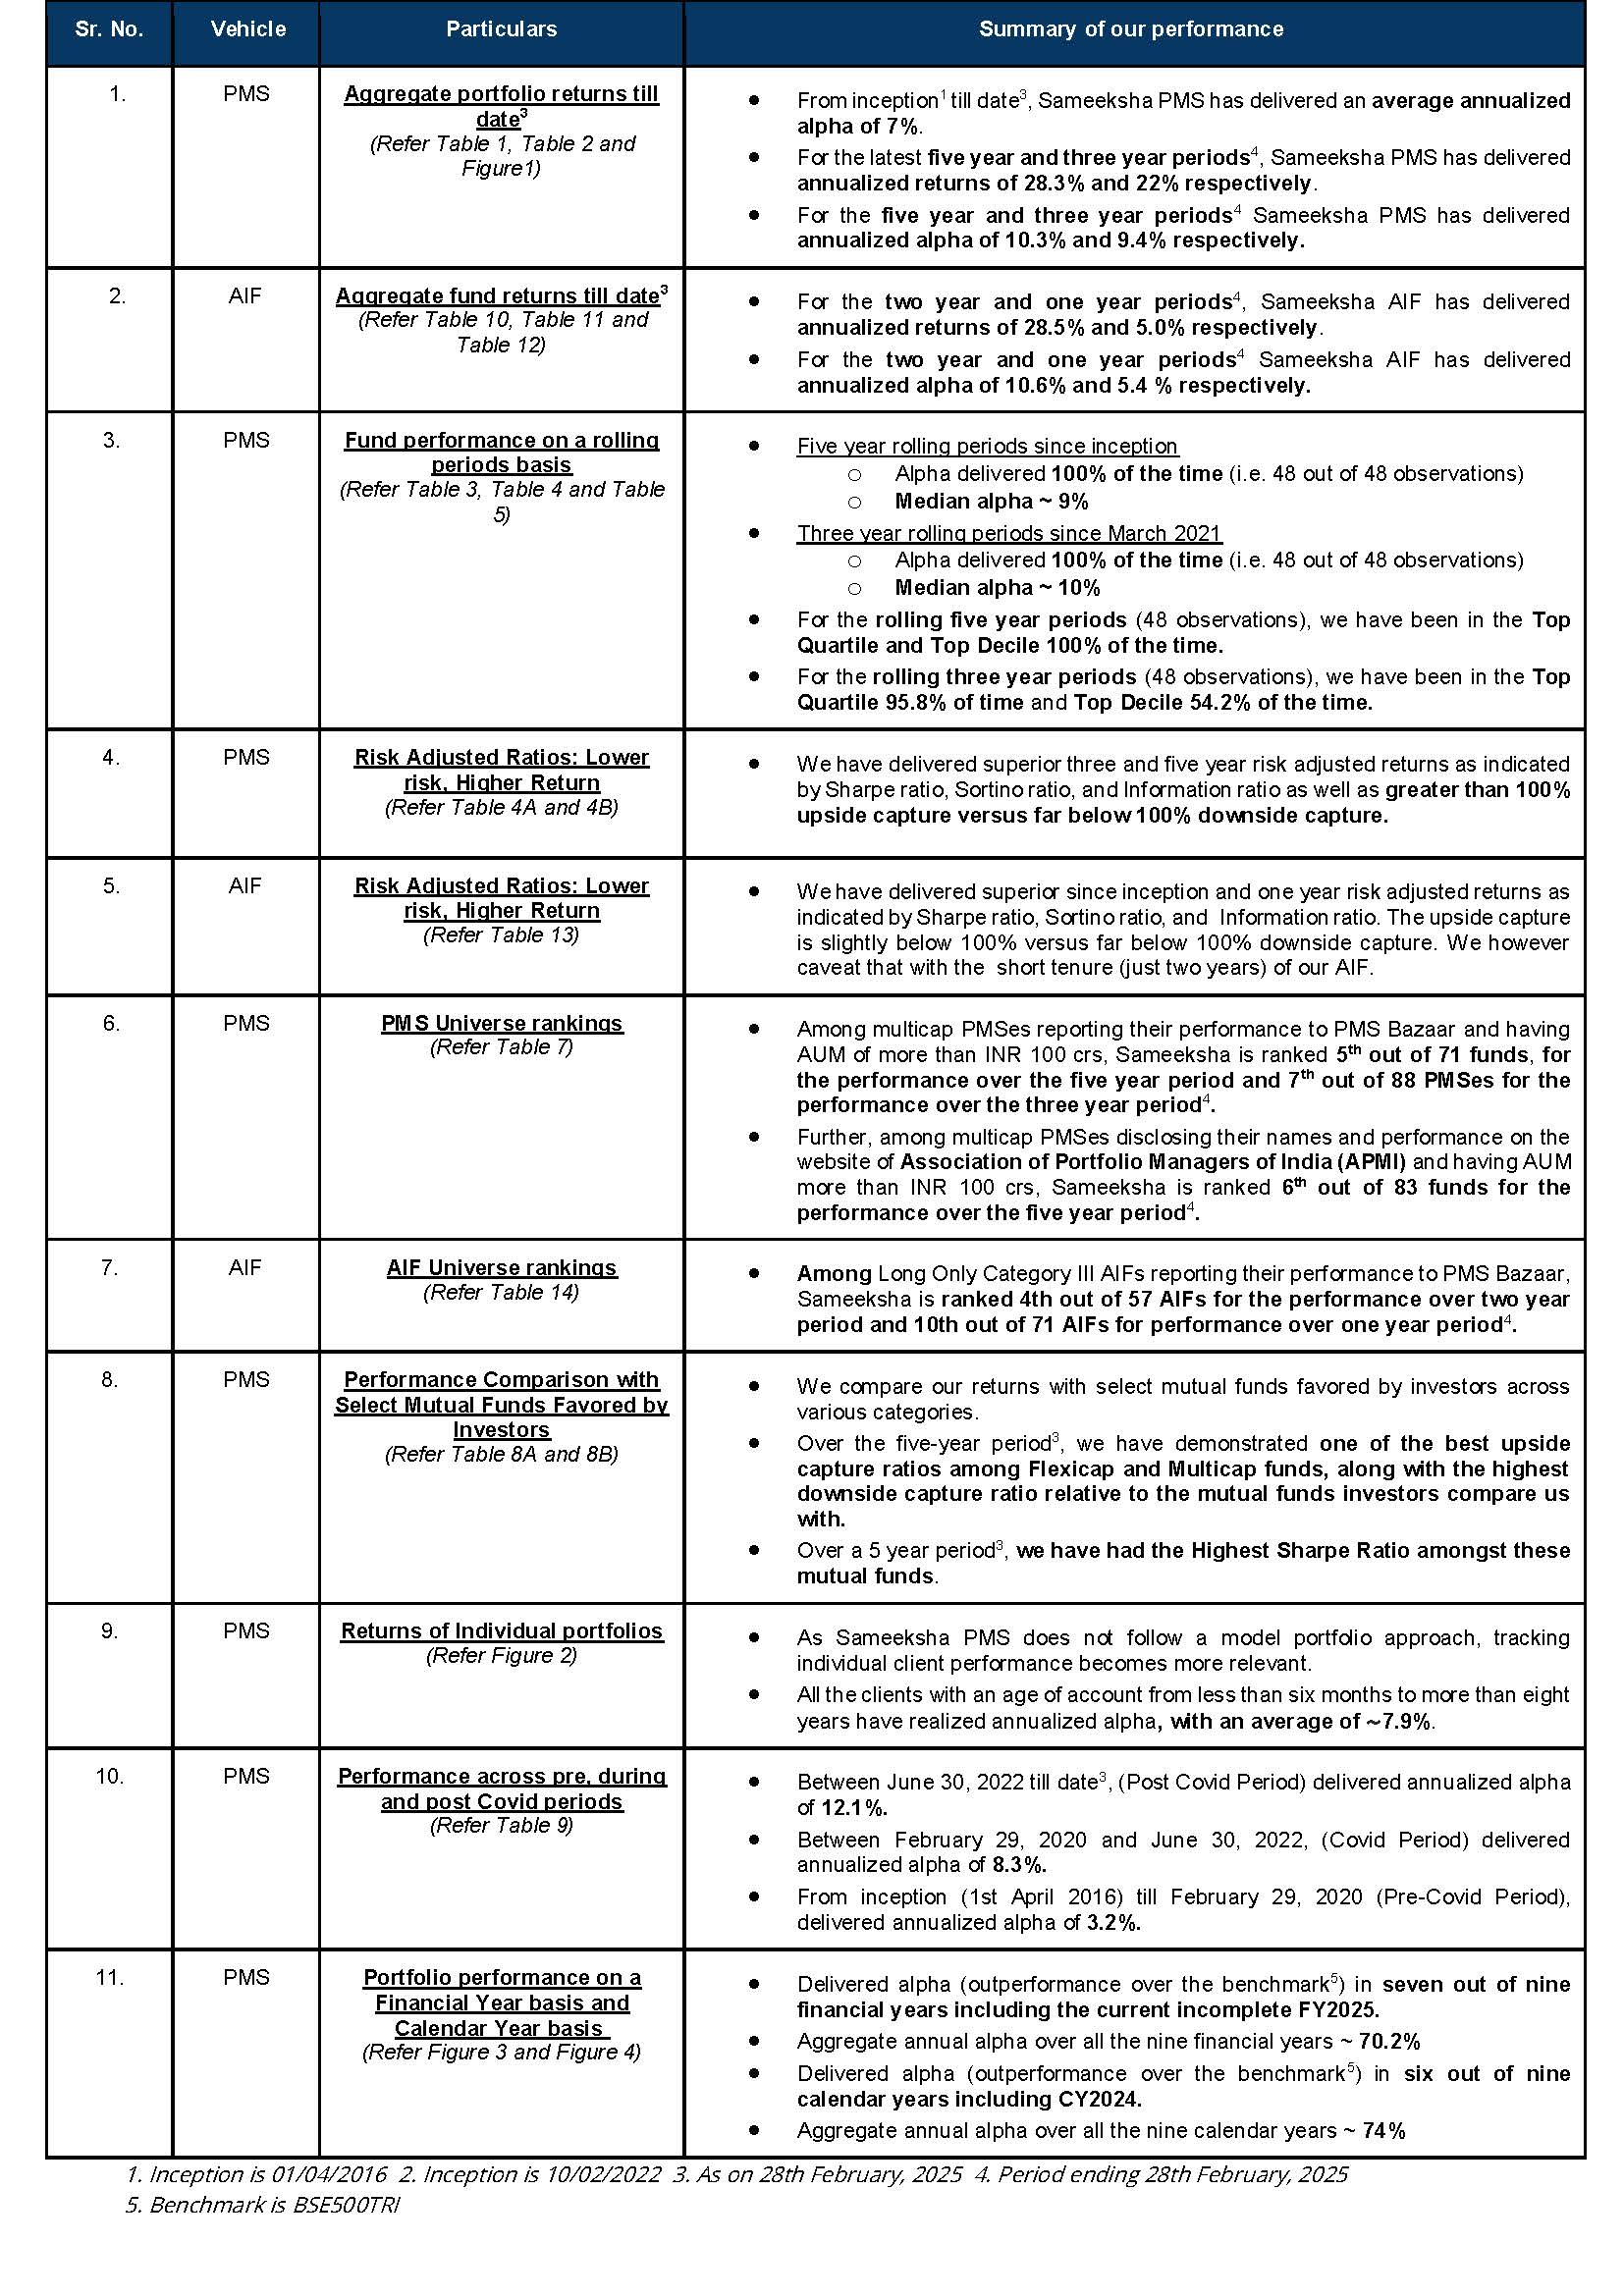
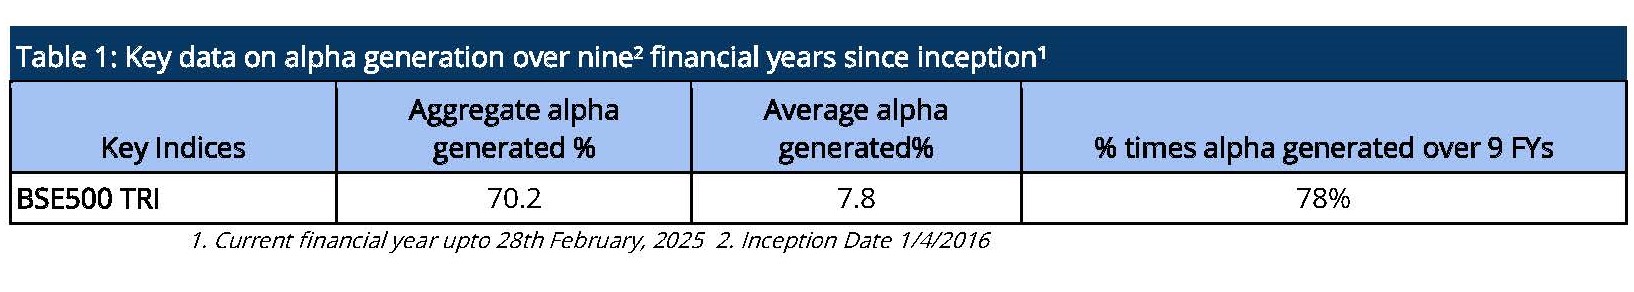
Sameeksha PMS has delivered a substantial aggregate annual alpha of 70.2% over BSE500 TRI over the nine financial years (including the current incomplete financial year) implying an average alpha of 7.8% since inception (Table 1).
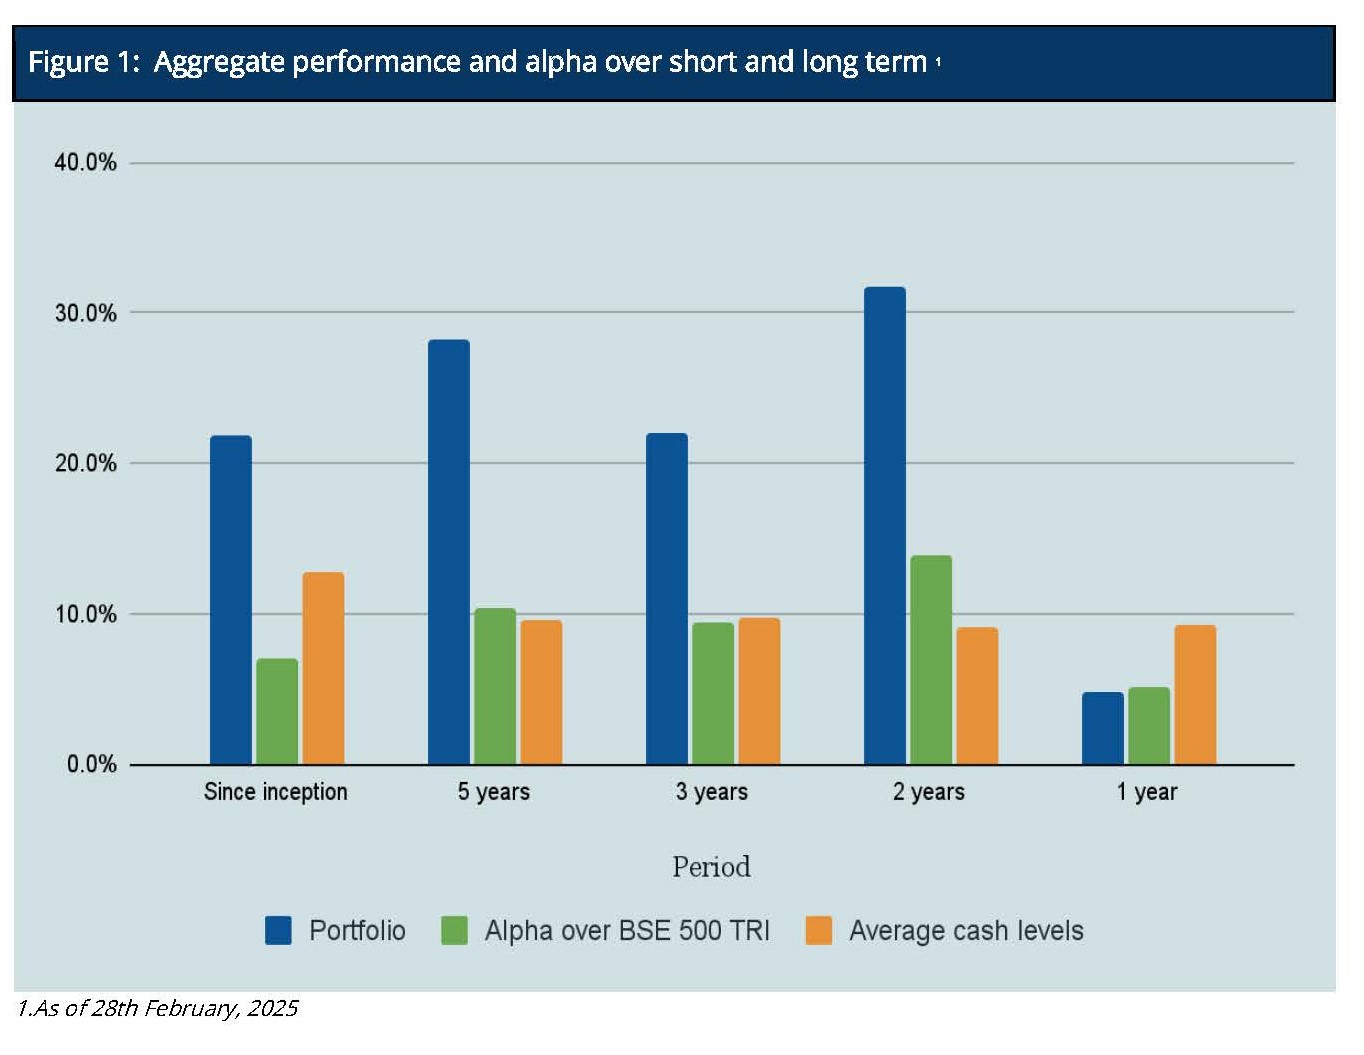
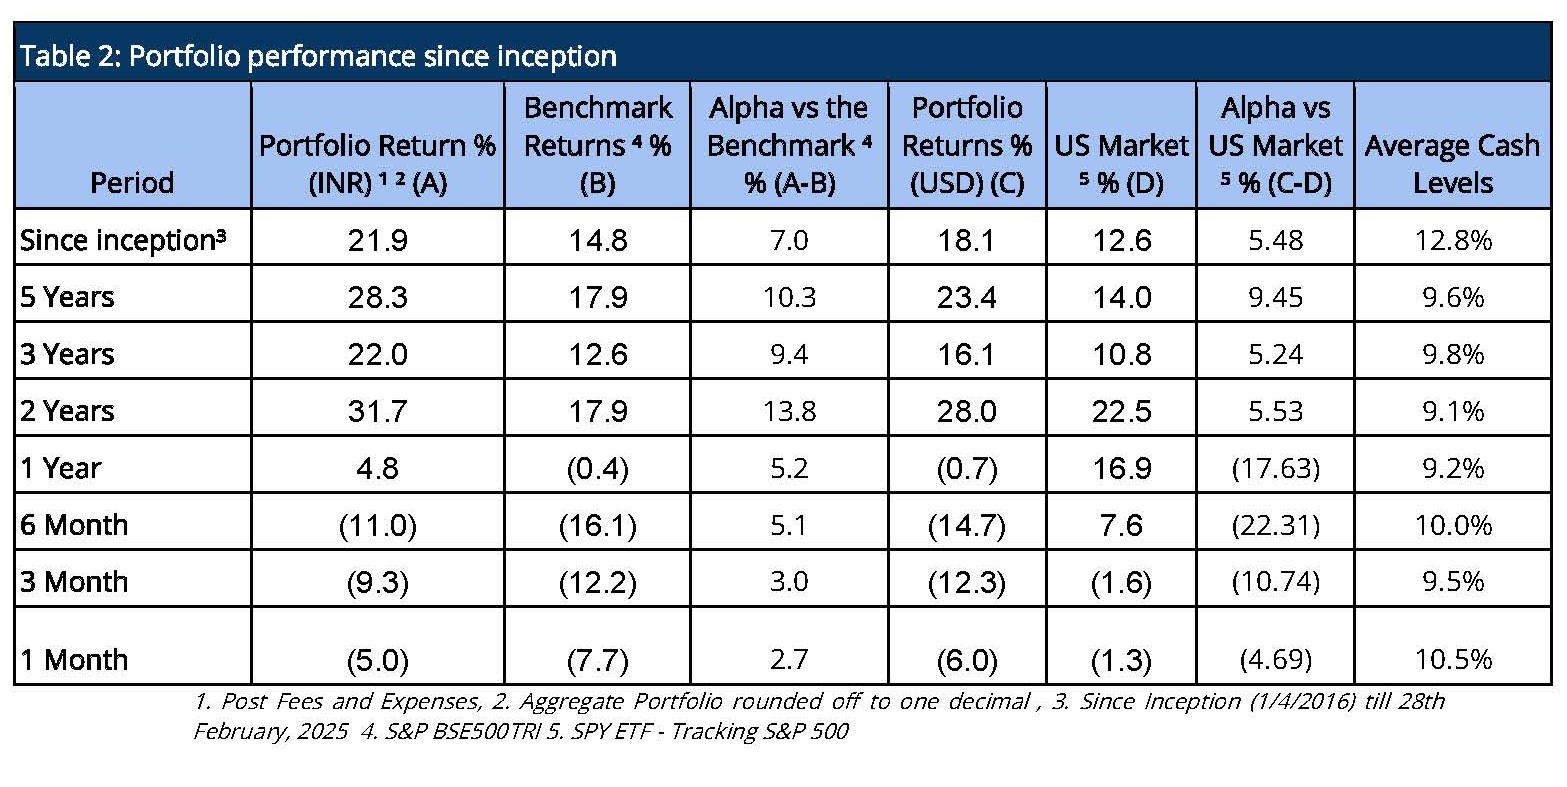
It is important to note that we have maintained relatively higher levels of cash (12.8% on average over the entire period since inception) from time to time over the duration of managing the portfolio. Notwithstanding the same, from inception, over five years and over three years respectively, we have generated returns of 21.9%, 28.3% and 22% in INR terms and 18.1%, 23.4% and 16.1% in USD terms thus generating substantial alpha over the Indian benchmark BSE500 TRI. Also, we have delivered strong returns relative to benchmark across various key time periods (Figure 1 and Table 2).
Aggregate Portfolio Performance and ranking on a rolling periods basis
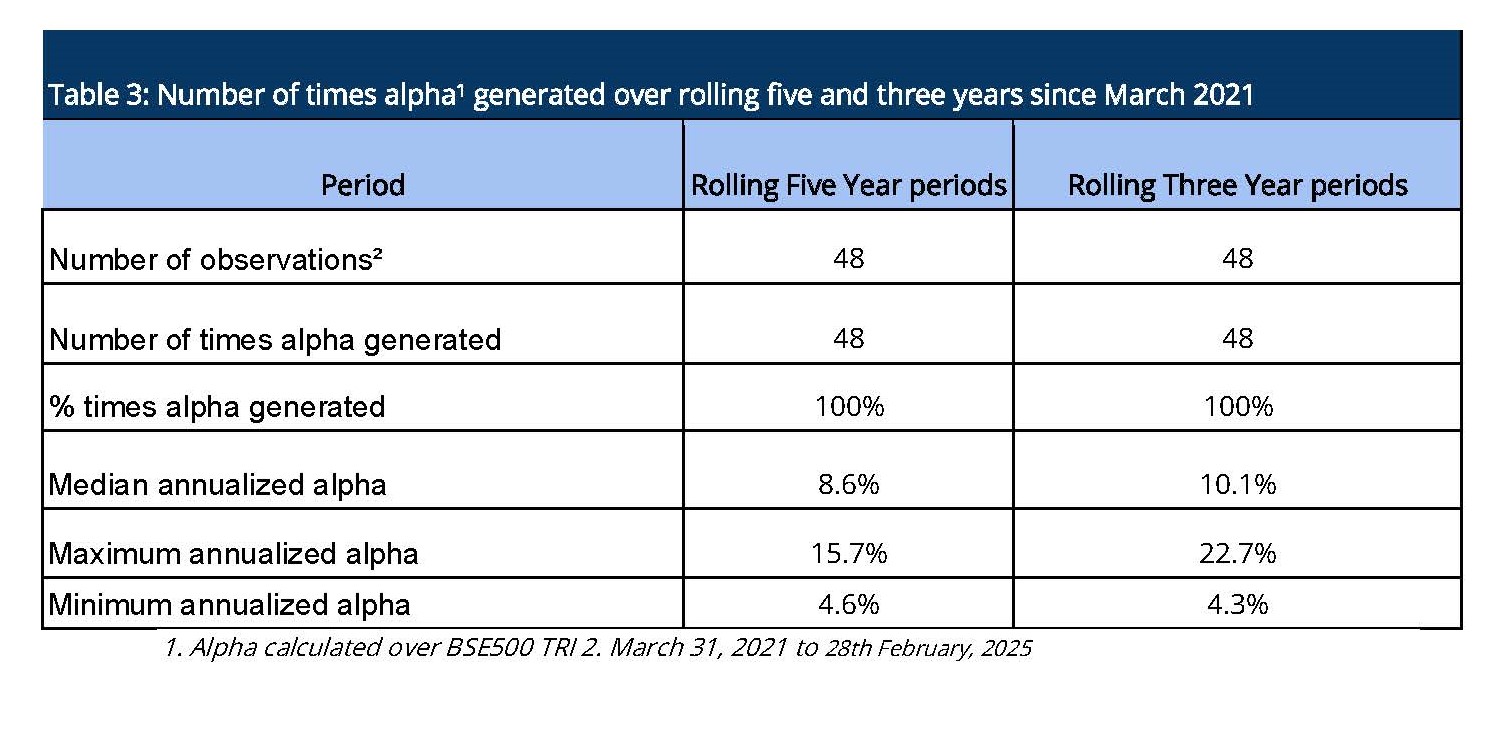
Rolling returns are a more useful indicator of consistency in performance versus single period returns. For the rolling five year periods applicable from March 2021 till date, Sameeksha PMS has delivered aggregate annualized alpha ranging from 5% to 16%, 100% of the time (48 out of 48 observations). For the rolling three year periods applicable from March 2021 till date, Sameeksha PMS has delivered aggregate annualized alpha 100% of the time (48 out of 48 observations) ranging from 4% to 23%.
Risk Adjusted Ratios: Not all returns are the same, Higher Returns at lower Risk
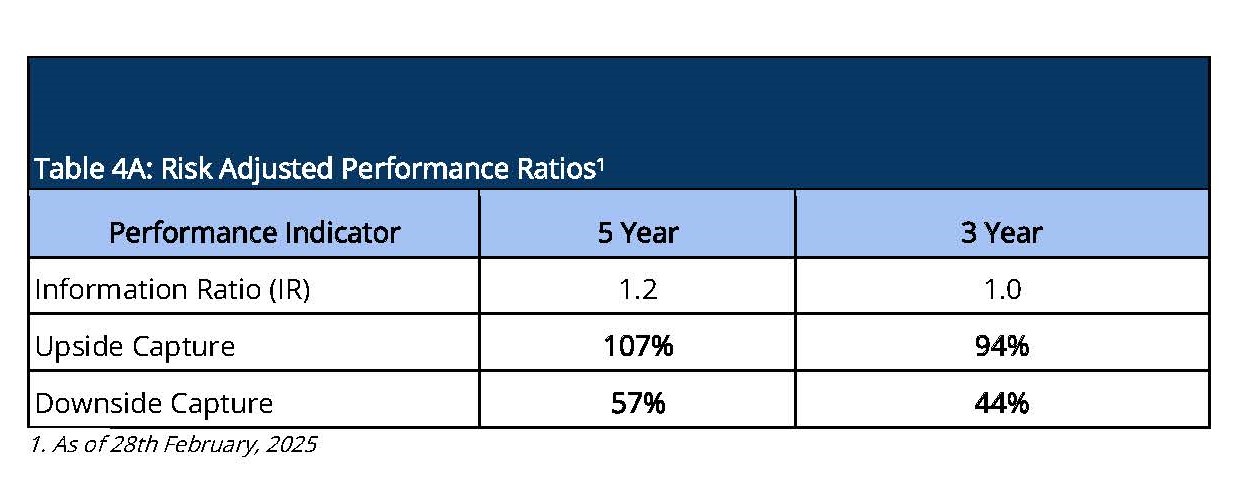
When compared on a risk adjusted basis, our PMS has shown an even stronger performance. The Information Ratio (IR) measures the excess return of a portfolio over a benchmark per unit of active risk. A higher Information Ratio suggests better risk-adjusted performance. The higher five year IR indicates better performance over the longer period in comparison to the IR in the 3 year period.
Moreover, Upside Capture measures how well a fund performs as compared to a benchmark when the benchmark has positive returns. A higher upside capture ratio (> 100%) indicates that the fund captures more of the benchmark’s positive movements. Whereas, Downside Capture measures how well a fund performs compared to a benchmark when the benchmark has negative returns. A lower downside capture ratio (< 100%) indicates that the fund preserves capital better during market downturns. (Table 4A).
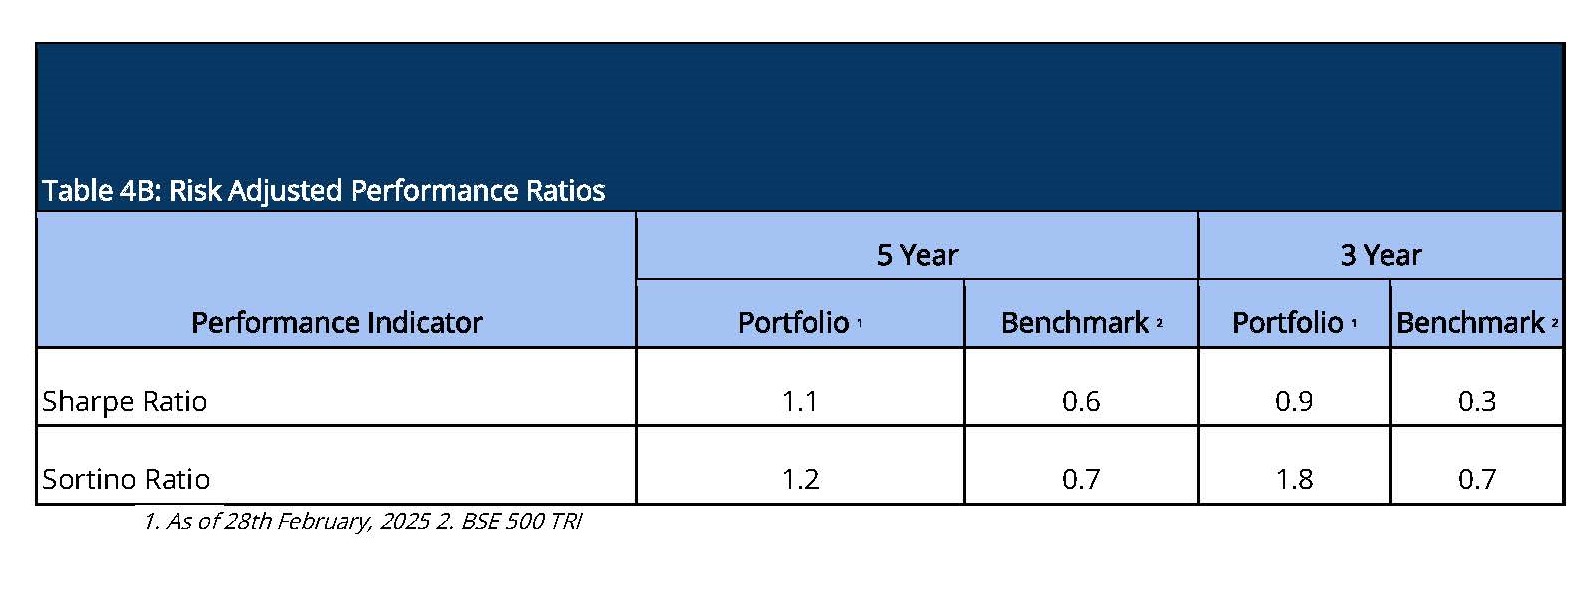
Furthermore, other risk-adjusted returns – Sharpe ratio is also significantly higher. The Sortino ratio measures the risk-adjusted return of an investment, focusing only on the downside risk. A higher Sortino ratio indicates better risk-adjusted returns, particularly with respect to downside risk. (Table 4B).
Performance within the PMS Universe
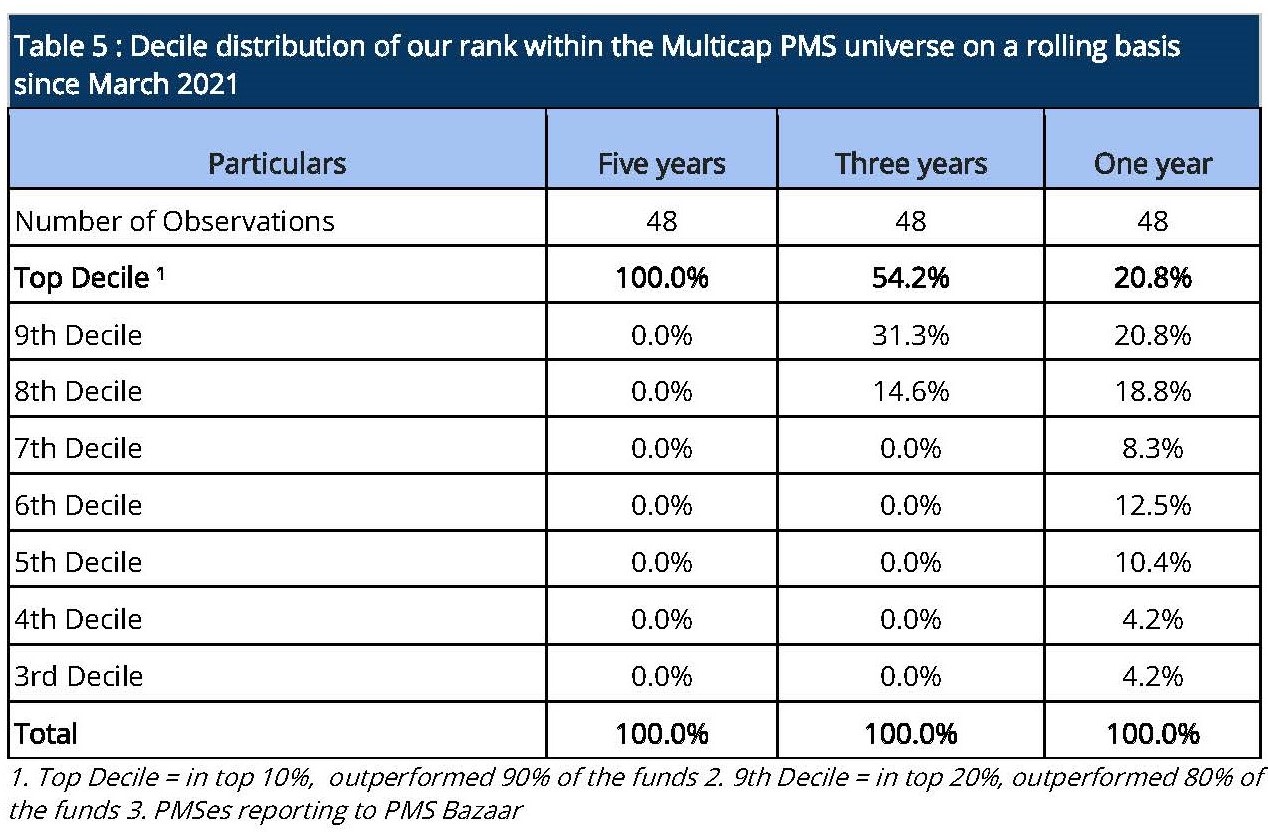
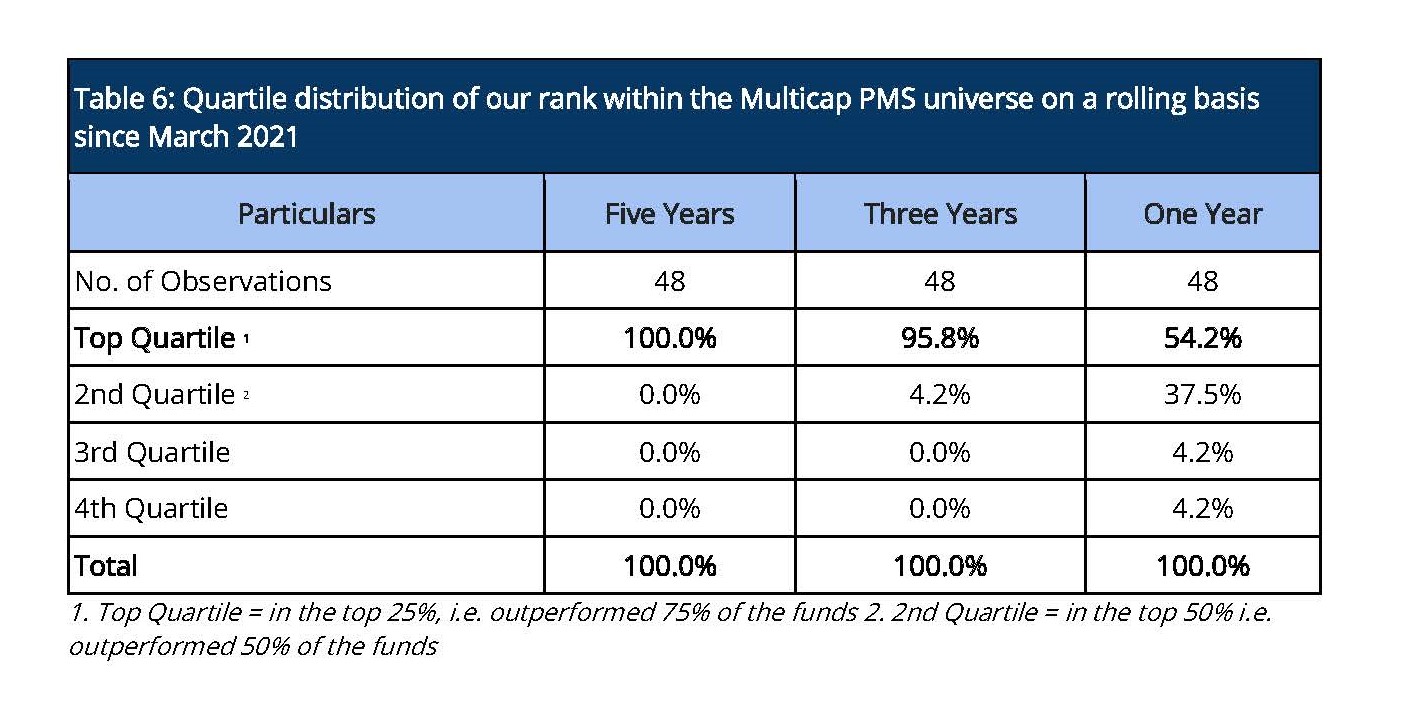
We continue to maintain our top rankings both within the multicap PMS universe as well as the entire PMS universe for key periods of three and five years. The multicap PMS universe rankings are more relevant to us since we follow the multicap strategy. For rolling three year periods applicable since March 2021, we have been ranked among the multicap universe in the Top Decile 54.2% of the time (26 out of 48 observations) and in the Top Quartile 95.8% of the time (46 out of 48 observations). For rolling five-year periods applicable to our entire operating history, we have been ranked among the multicap universe in the Top Quartile 100% and Top Decile 100% of the time (48 out of 48 observations). (Tables 5 and 6)
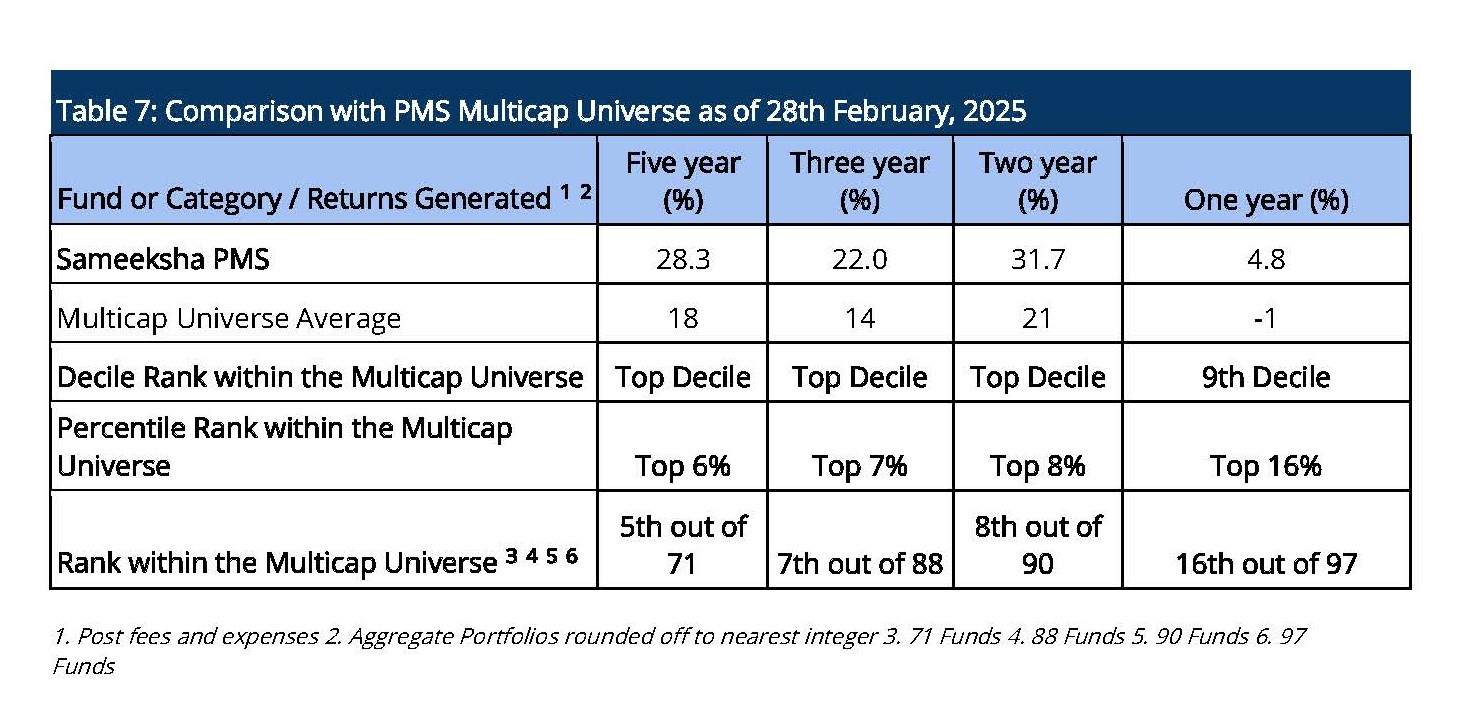
In the interest of a fair comparison, we present our rankings among those multicap PMSes with AUM more than INR 100 crs. Within this universe, we are 5th out of 71 PMSes for the five year period and 12th out of 95 PMSes for three year period, highlighting our superior performance over the long term periods (Table 7). Among the multicap universe with AUM more than INR 100 crs, we are consistently ranked in the Top Decile for the five year period for 48 out of 48 observations reflecting well on the consistency of our performance.
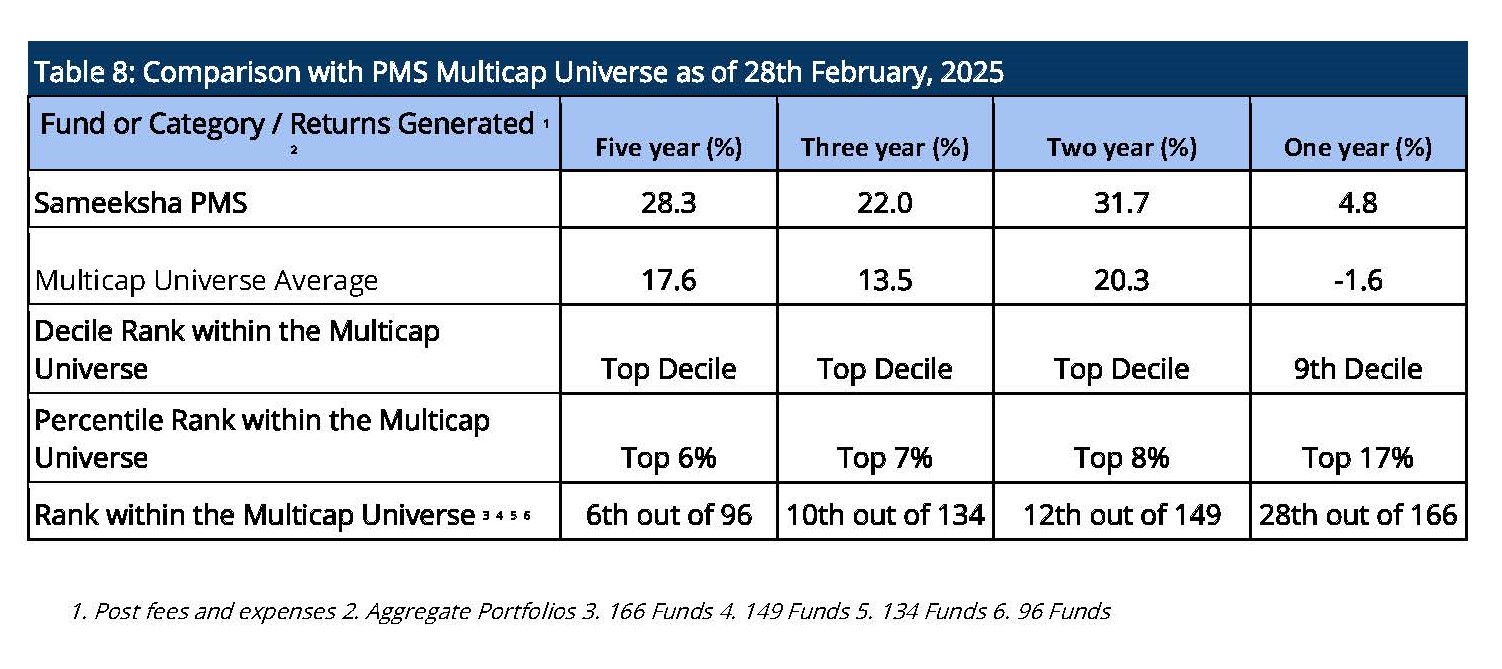
We also want to share our ranking among all Multicap PMSes, including those with AUM of all sizes. Within this universe, we are ranked 6th out of 96 PMSes for the five-year period and 10th out of 134 PMSes for the three-year period. This places us in the top decile on both the five-year and three-year basis.
Performance Comparison with Select Mutual Funds Favored by Investors
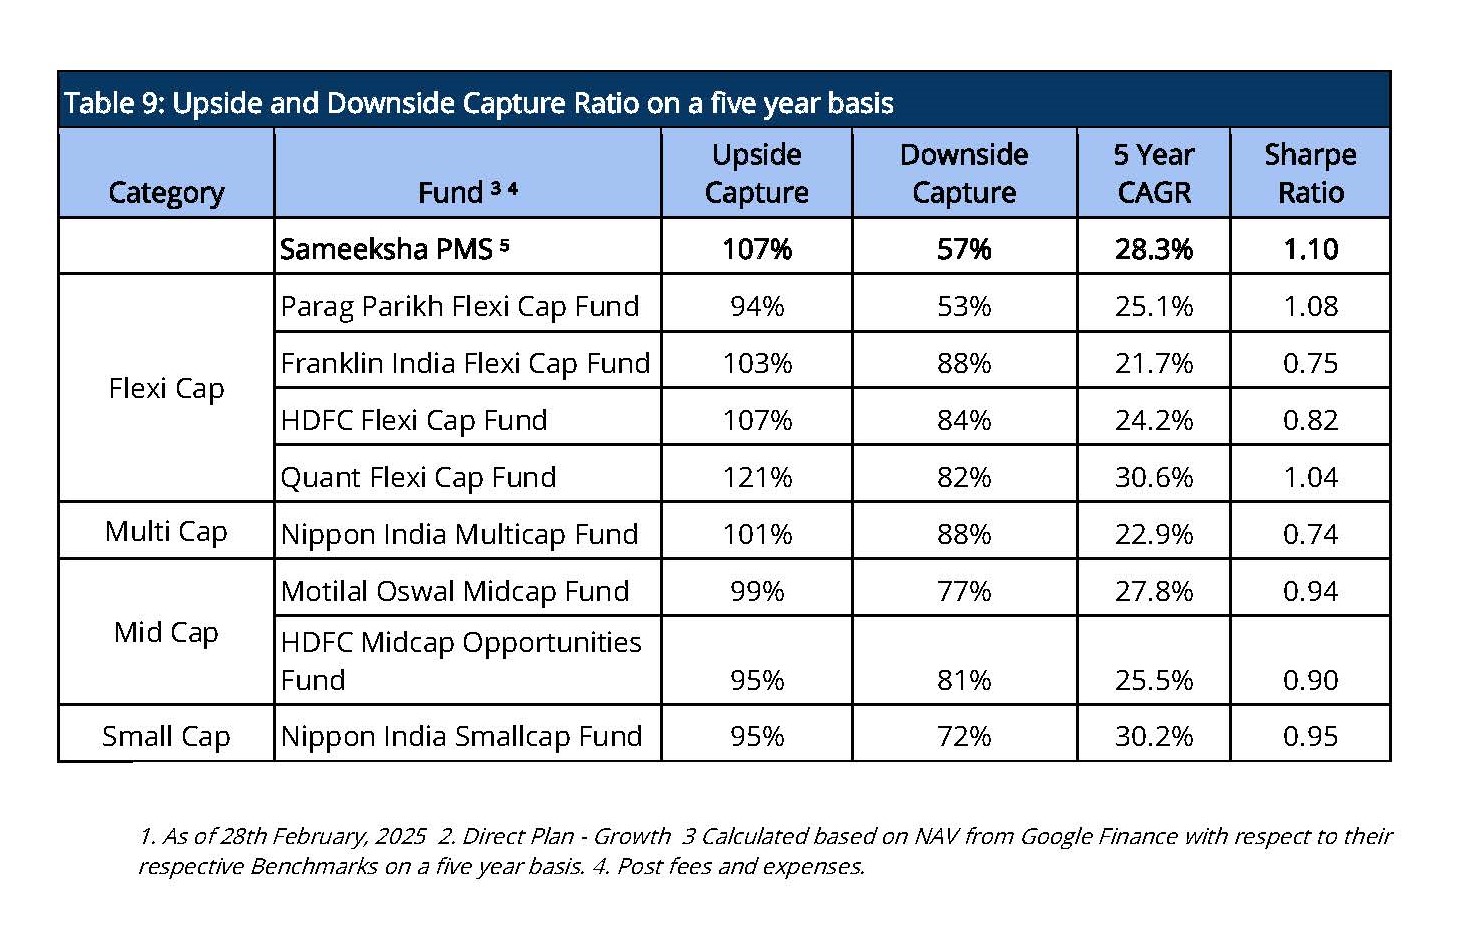
We compare our returns with a group of mutual funds favored by investors across various categories. This ensures that our performance assessment is both relevant and insightful, focusing on funds that align with investor preferences. We have achieved one of the lowest downside capture ratios compared to the mutual funds we analyze, reflecting our strong emphasis on risk management and minimizing losses during market downturns. Over a five-year period, we have delivered superior returns compared to these mutual funds, both in terms of CAGR as well as risk-adjusted returns, showcasing our ability to generate consistent and sustainable performance (Table 9).
Returns of Individual Portfolios
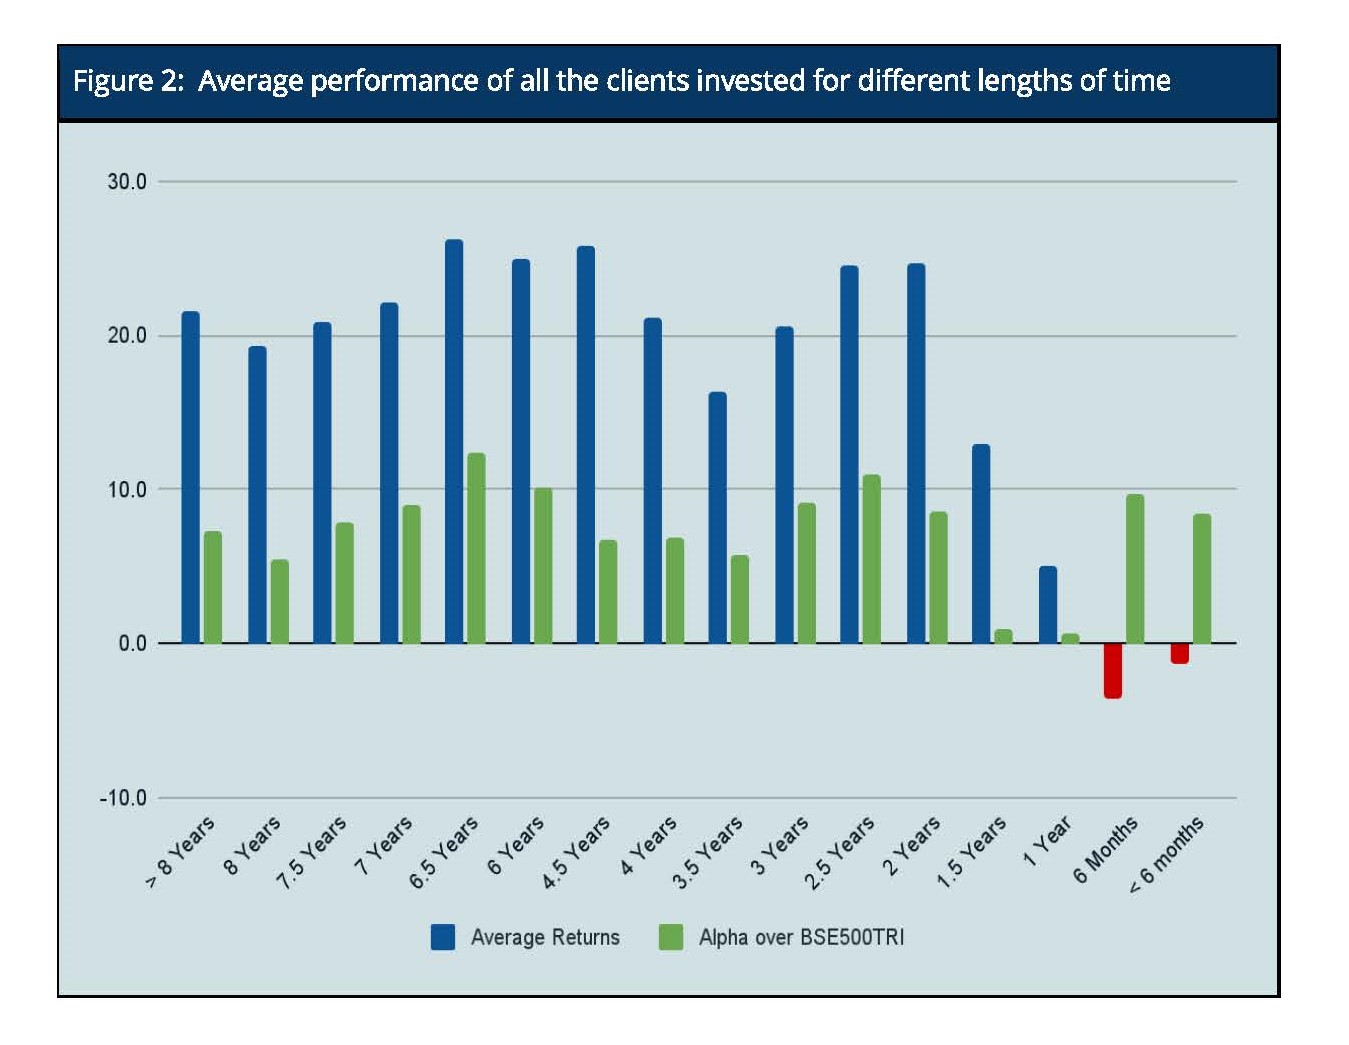
Because we don’t follow model portfolio strategy, the performance of individual clients is far more important than overall portfolio aggregate returns (Figure 2). For investors who are with us for 5 years and more, Sameeksha PMS has returned a very substantial alpha with an average annualized alpha of approx. 7.4% for the five year period ending 28th February, 2025. Similarly, for investors who are with us for 3 years or more, Sameeksha PMS has returned substantial alpha with an average annualized alpha of approx. 8.4% for the three year period ending 28th February, 2025. The Figure below shows the average annualized returns and alpha over different periods of time of all the clients as on 28th February, 2025.
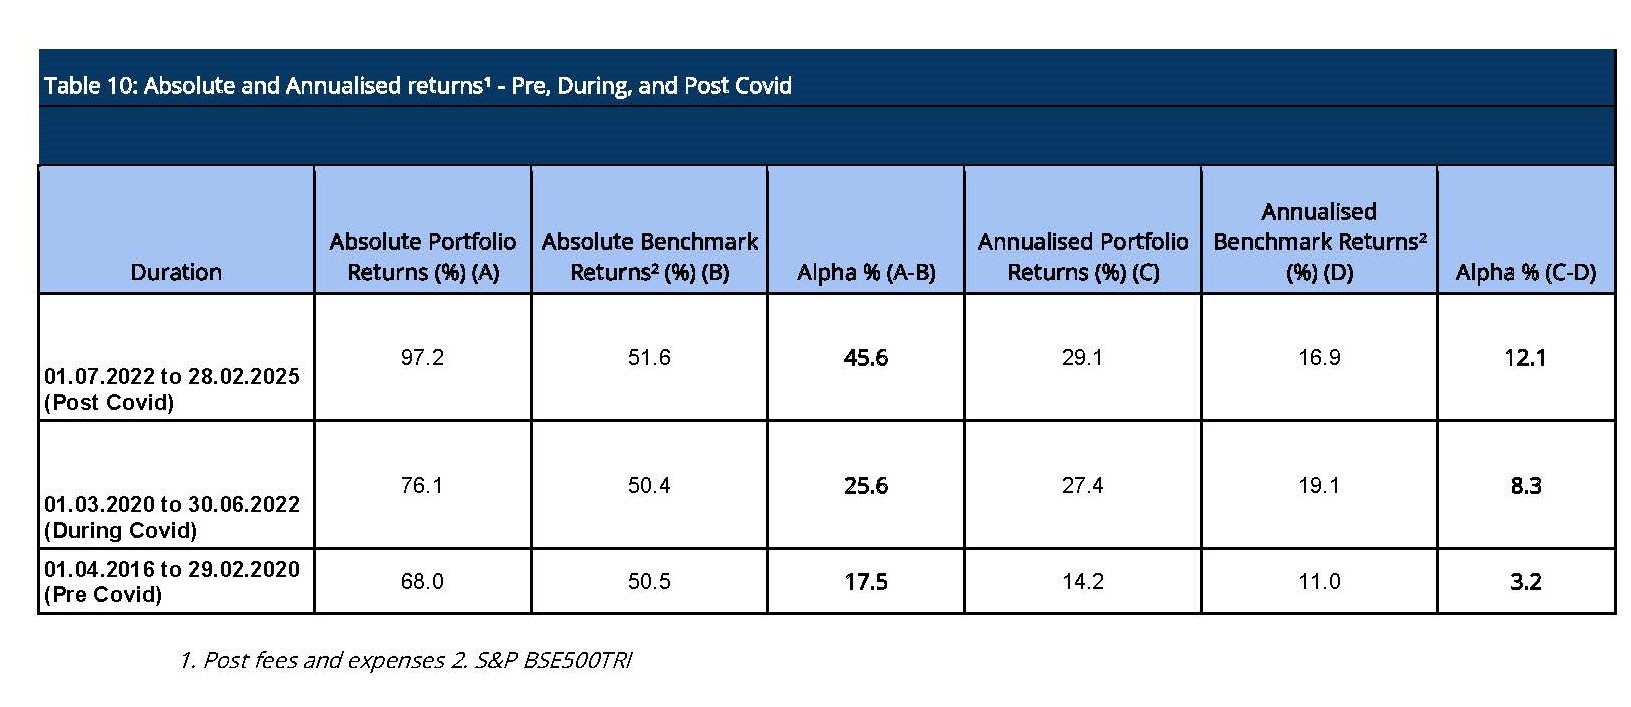
Performance Of PMS Over The Covid Timeline (Pre, During, And Post)
The Covid Pandemic induced significant volatility in the equity markets. Hence, it is useful to look at the performance across three time slices : Pre Covid, During Covid and Post Covid. Sameeksha PMS has outperformed the benchmark across all of these three time periods with meaningful alpha (Table 10). This consistency of performance may be an important factor in comparing us with the other funds.
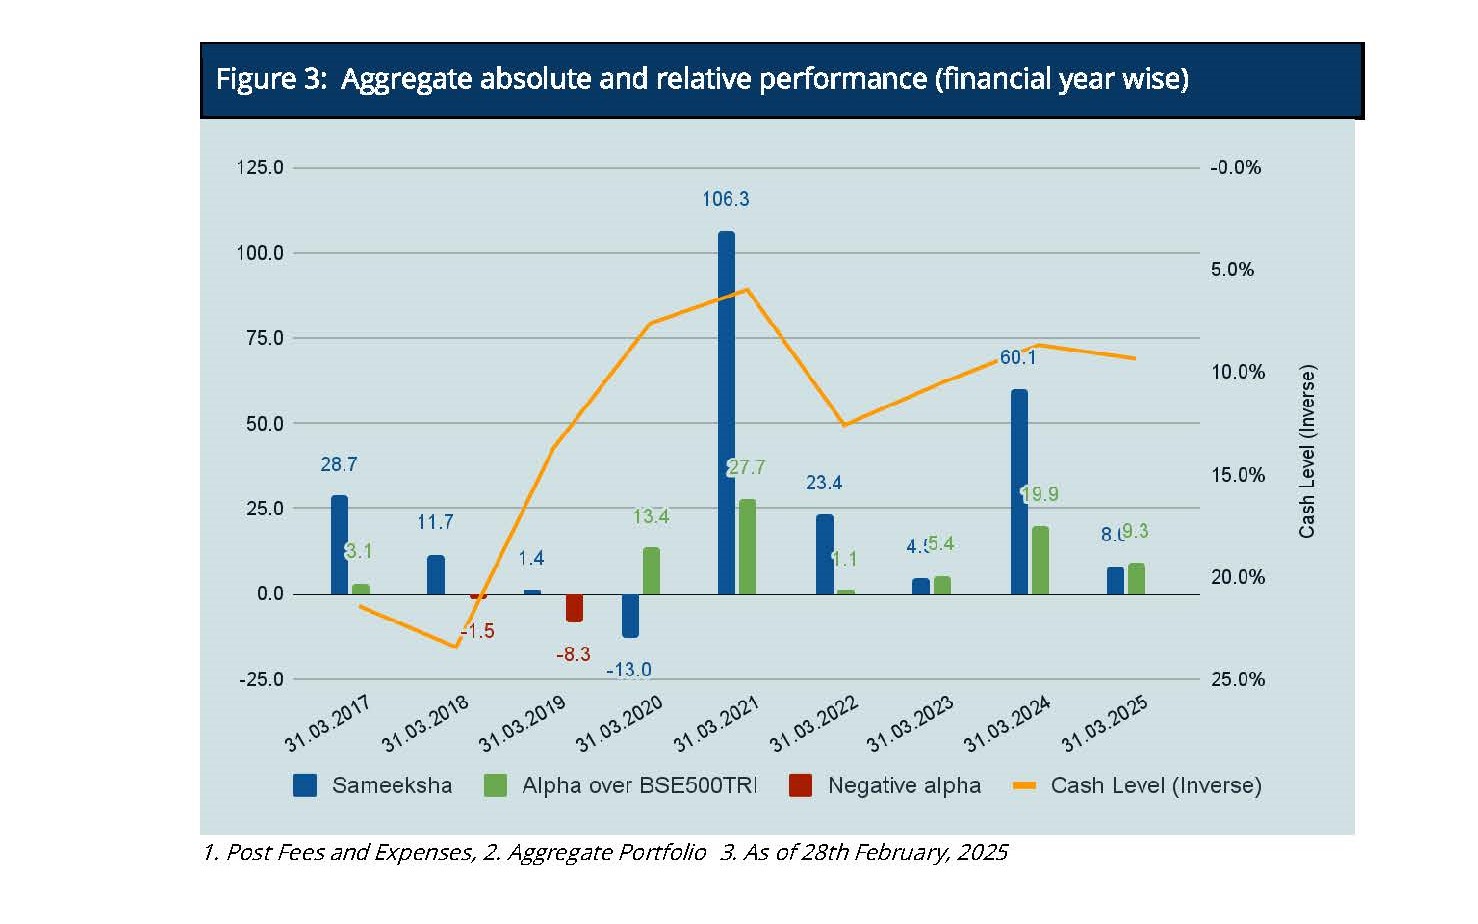
Aggregate Portfolio Performance on a financial year and calendar year basis
For the month of February, Sameeksha PMS has outperformed the benchmark BSE 500 TRI by 2.7%. For Financial Year 2024-25, we have outperformed BSE500 TRI by 9.3%. Looking at our performance over the financial years (Figure 3), we have outperformed our benchmark in seven out of nine financial years (including the current incomplete financial year). Key however is that the sum of outperformance of 80% in those seven years far exceeds the sum of underperformance of 9.8% in the remaining two years. Furthermore, if we are able to outperform in this financial year, it will become a streak of six consecutive years of generating alpha.
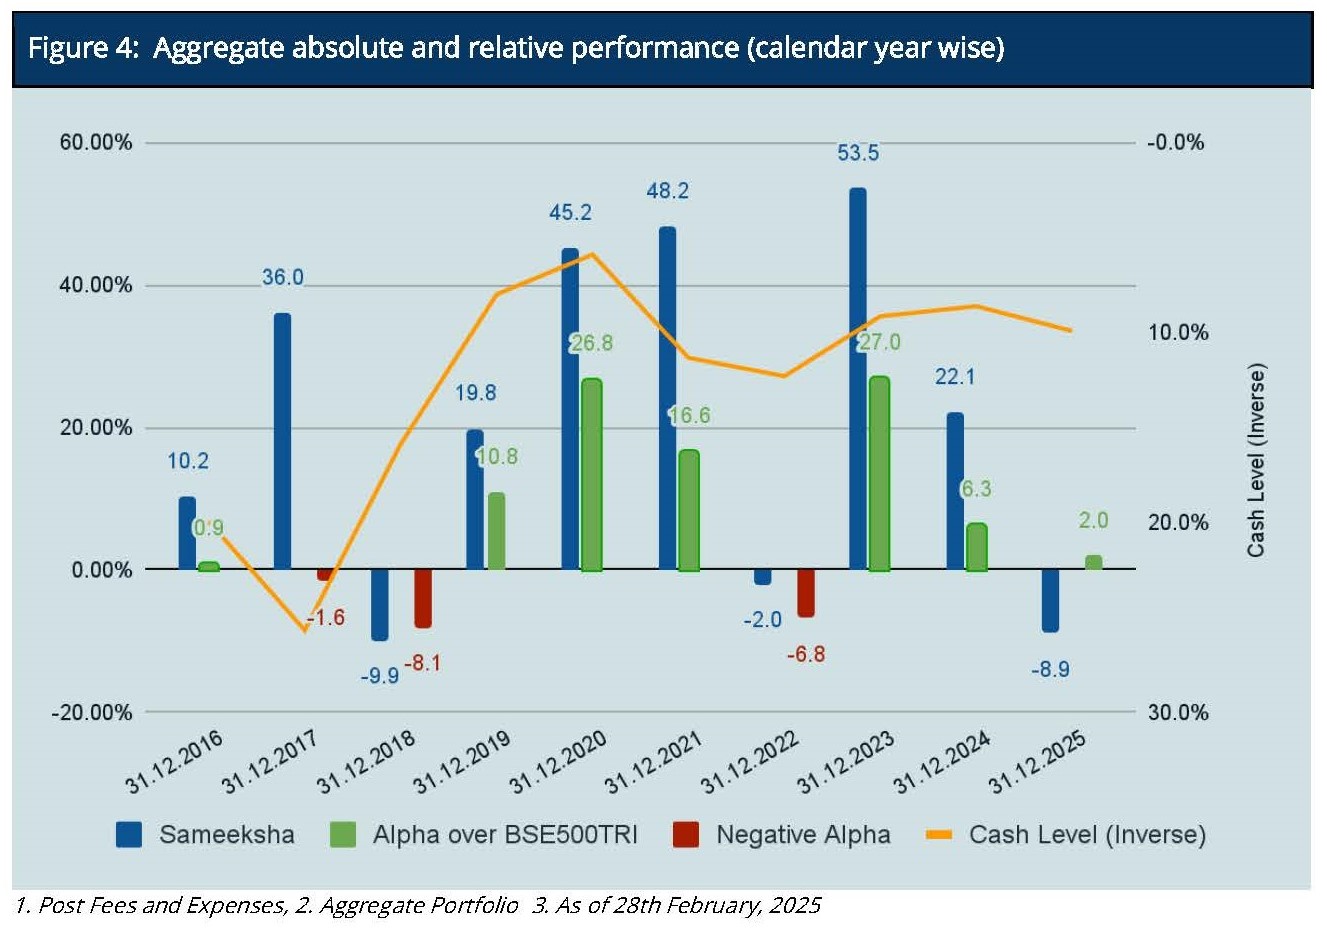
For the calendar year 2025, we have underperformed the benchmark BSE500 TRI by 0.7%. Looking at our performance over calendar years (Figure 4), we have outperformed the benchmark in six out of nine calendar years and the sum of outperformance of 90.5% in six years far exceeds the sum of underperformance of 16.5% in the remaining three years.
It is important to note that we delivered this alpha despite maintaining an average cash level of 12.8% across the nine financial years.
Cumulative Performance versus the benchmark
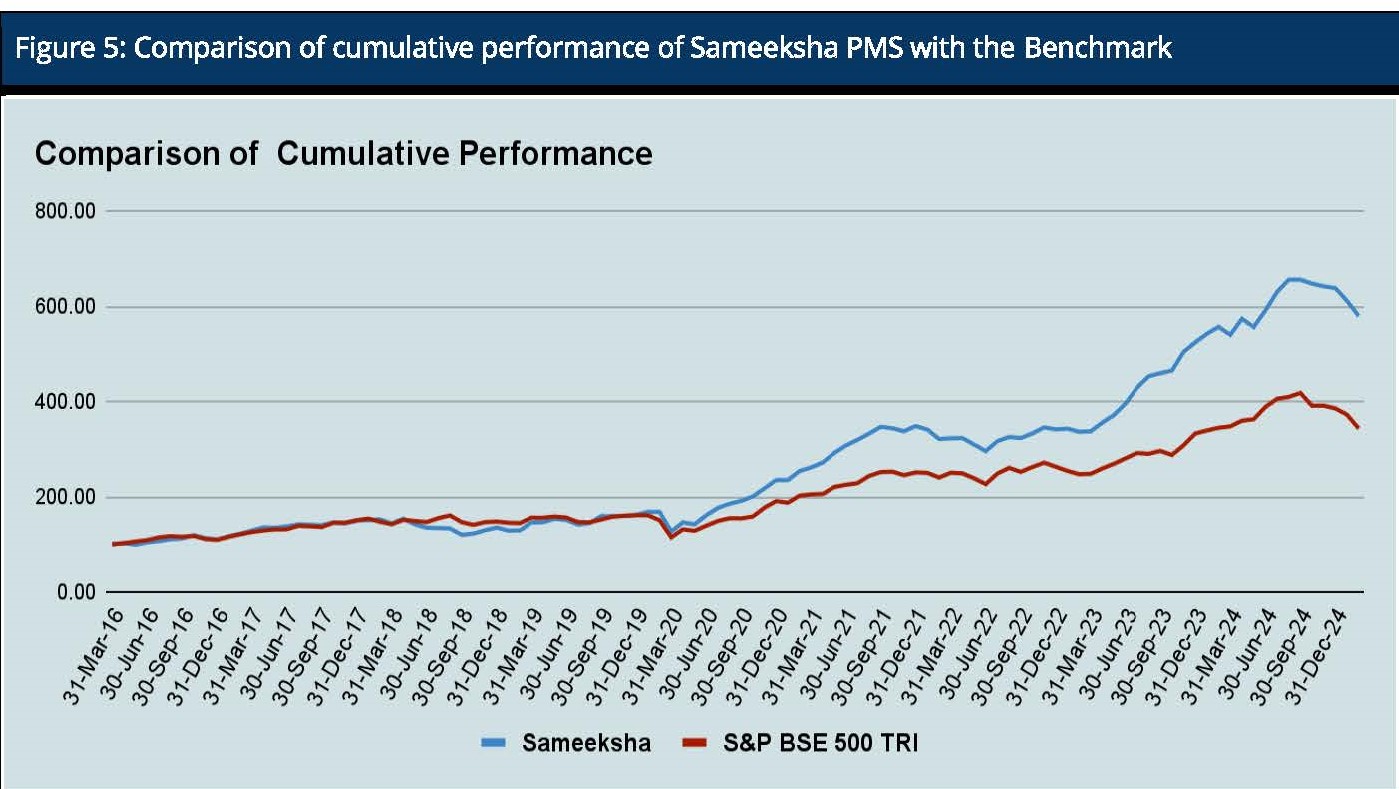
Sameeksha PMS’s outperformance over its benchmark has continued to widen positively over the years. An investment of Rs. 100 with us since inception (April 2016) would have grown to Rs. 579 , far outpacing what one would have earned by investing in a fund that achieved benchmark returns (Figure 5).
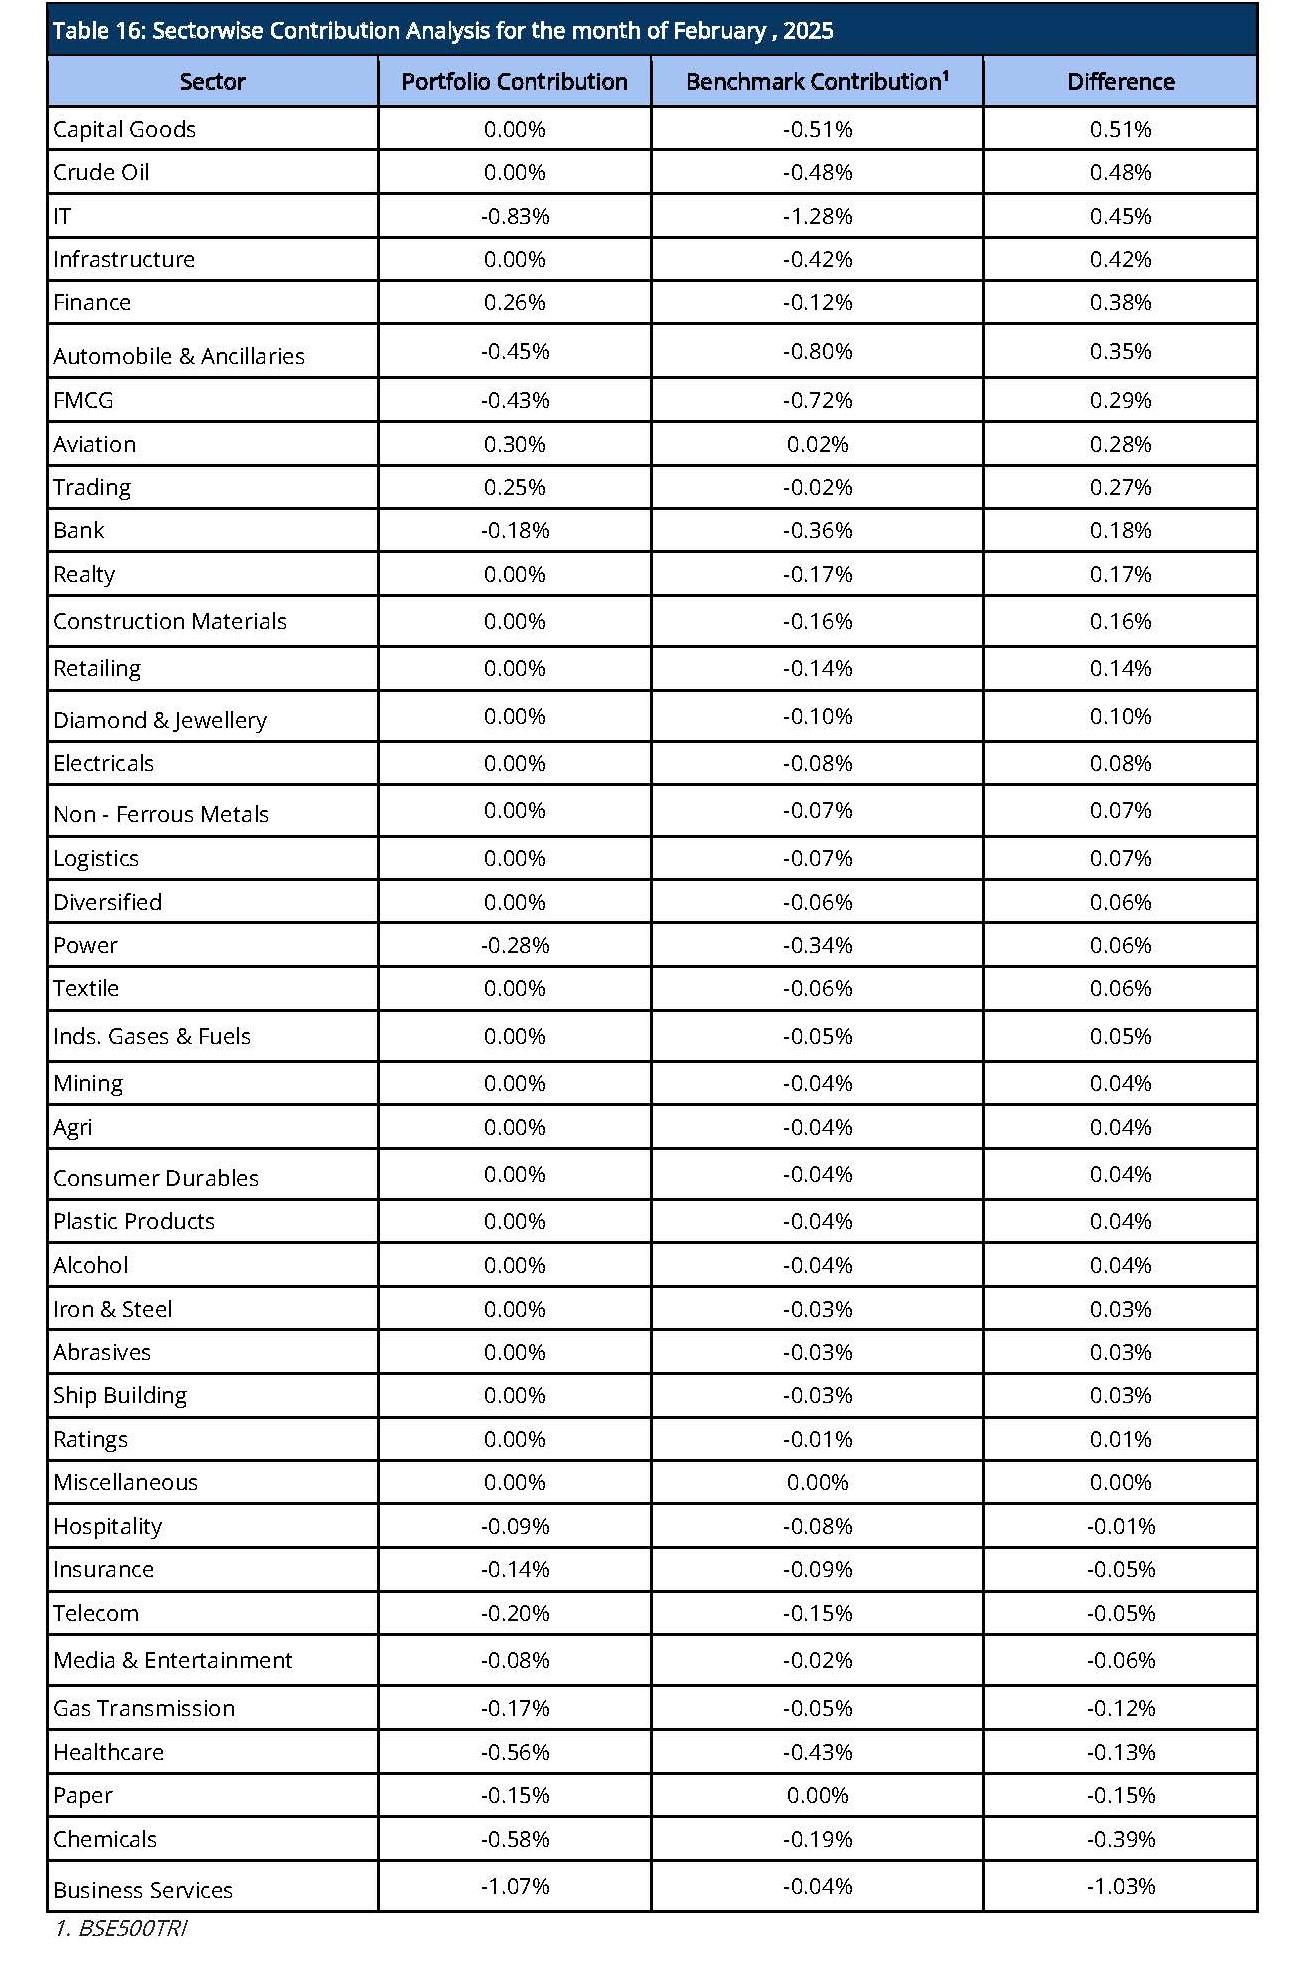
The contribution analysis of February 2025 reveals that the portfolio is performing well in sectors like Aviation, Finance and Trading, which are significantly outperforming their benchmark counterparts. These sectors have provided positive contributions to the portfolio, with Finance leading at a 0.4% difference. On the other hand, Healthcare, IT and Business Services are notable underperformers, contributing negatively to the portfolio, with Business Services underperforming by -1.07% relative to the benchmark.
Below is the contribution analysis for the month of February 2025 (Table 11).
AIF Performance and other details
Aggregate Fund Returns over various time periods
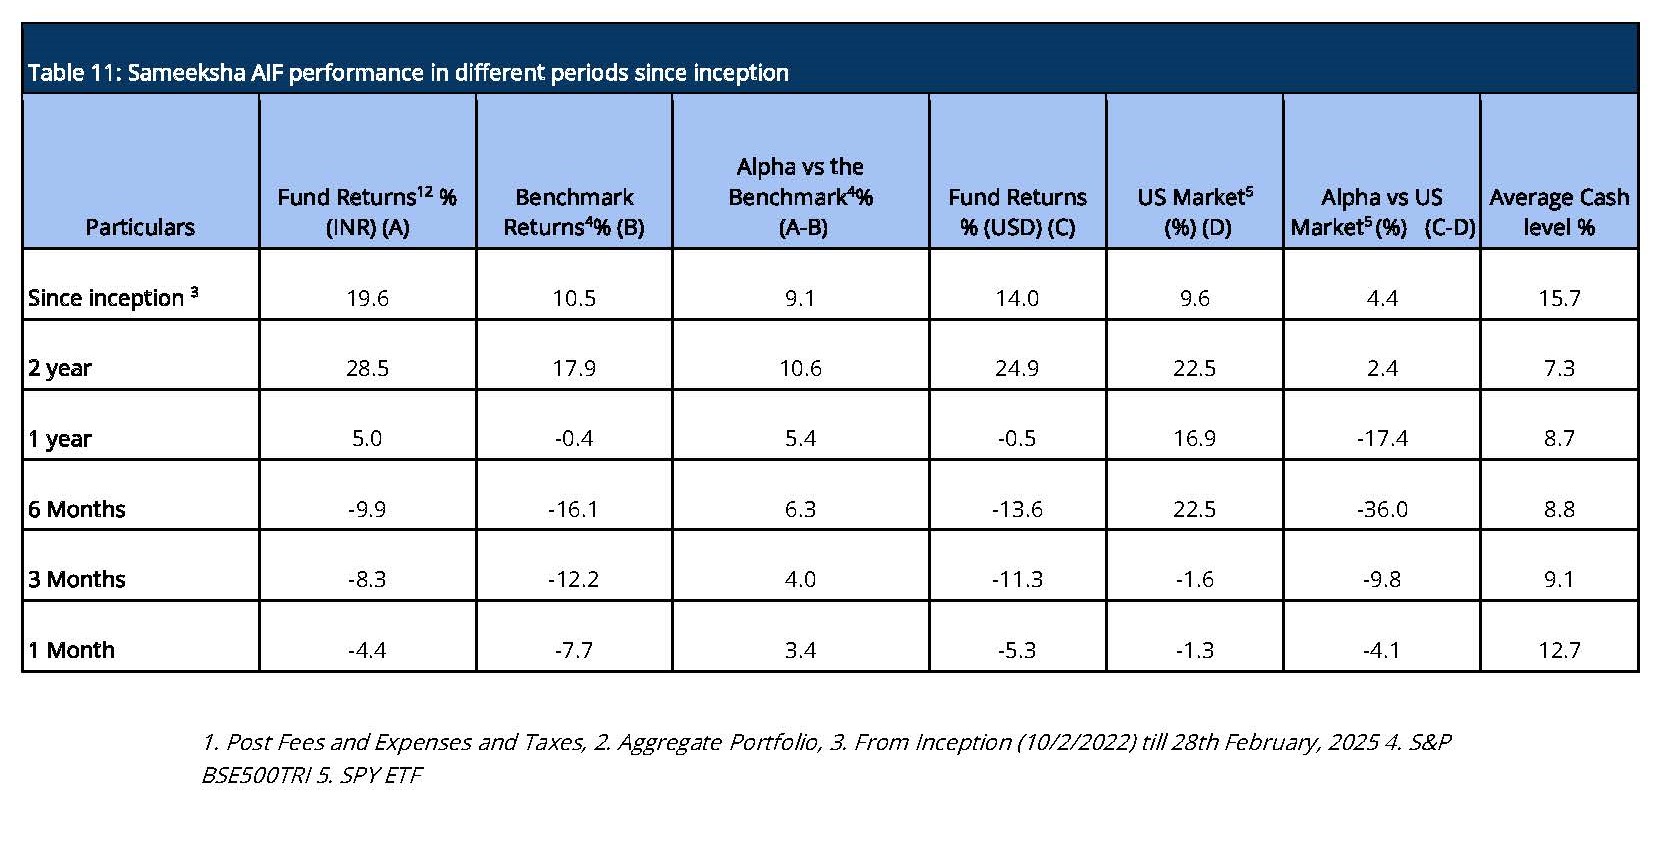
Since inception, we have maintained relatively higher levels of cash (16% on average over the entire period from inception) from time to time over the duration of managing the fund. Notwithstanding the same, from inception, over two years and over one year, we have generated returns of 19.6%, 28.5% and 5% in INR terms and 14%, 24.9% and (0.5)% in USD terms beating the benchmark BSE500 TRI returns and ETF tracking S&P 500 index, respectively after fees and taxes. (Table 11).
Aggregate Fund Performance on a financial year and calendar year basis
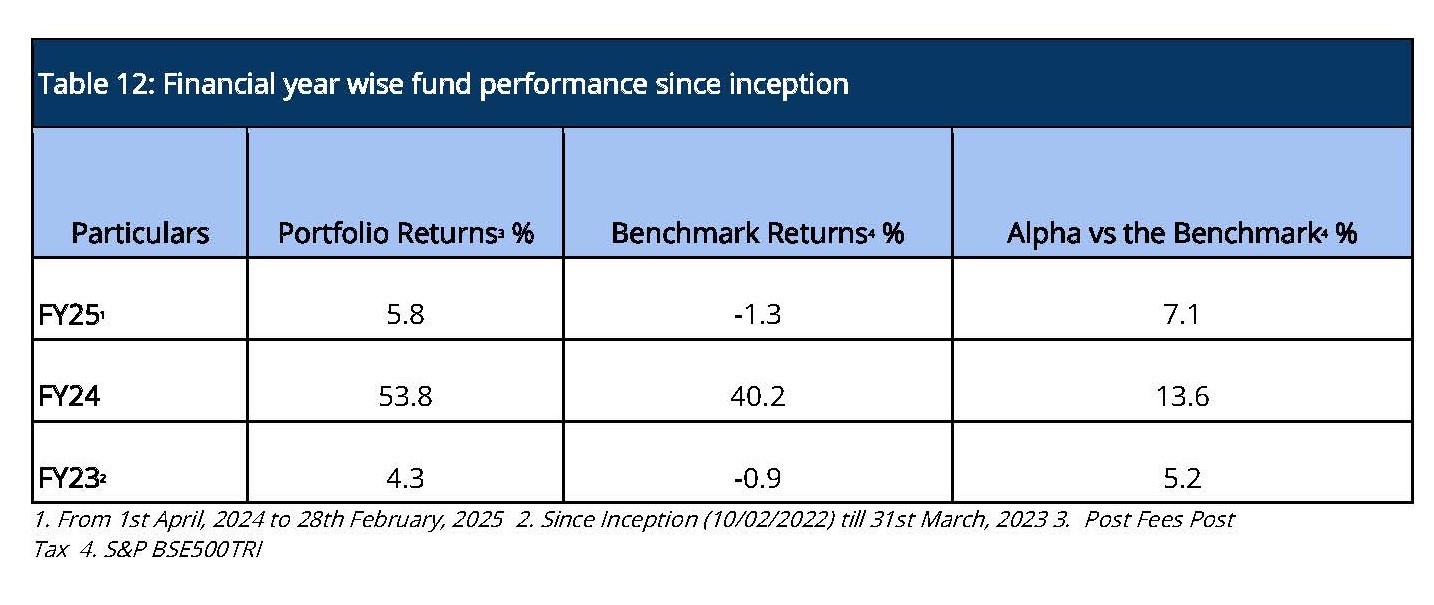
For the month of February, Sameeksha AIF has outperformed the benchmark BSE 500 TRI by generating -4.4% returns against the benchmark BSE500TRI returns of -7.7%. Looking at our performance over the financial years (Table 12), we have outperformed our benchmark in FY 2023 and FY 2024 and we continue to outperform in the current incomplete FY 2025. For the financial year 2025 till date, we have positioned ourselves by outperforming the benchmark BSE500 TRI by 7.1%.
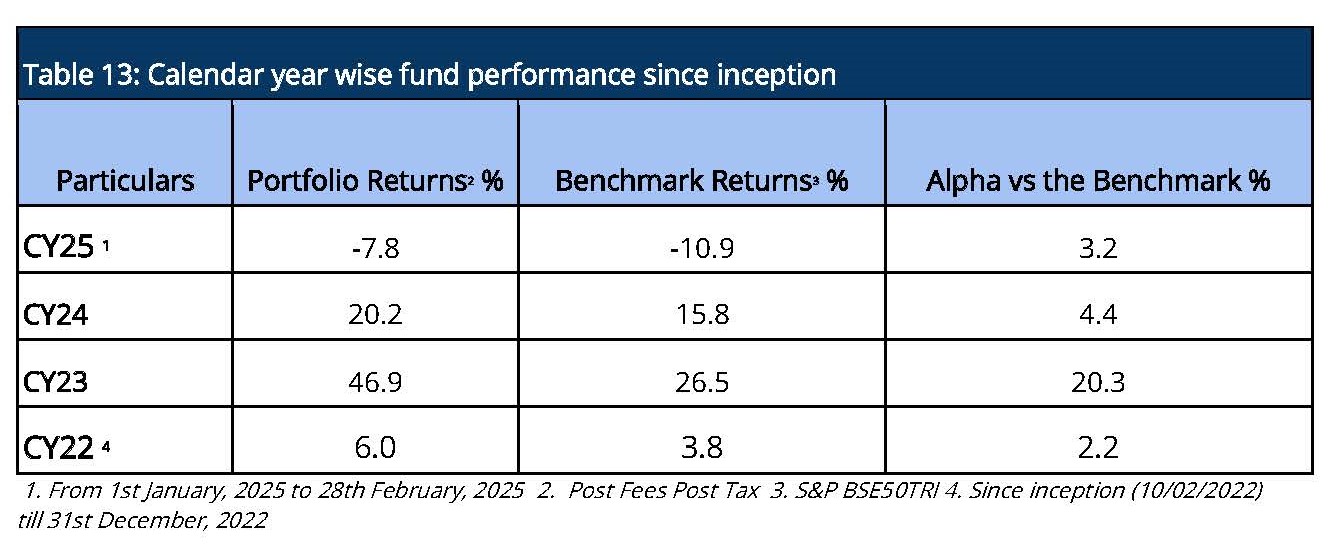
For the calendar year 2025, we have outperformed the benchmark BSE 500 TRI by 3.2%. Despite being a new fund, we were still able to produce alpha for calendar years 2022, 2023 and 2024 and outperformed the benchmark BSE500 TRI by 2.2%, 20.3% and 4.4% respectively. (Table 13)
Risk Adjusted Ratios
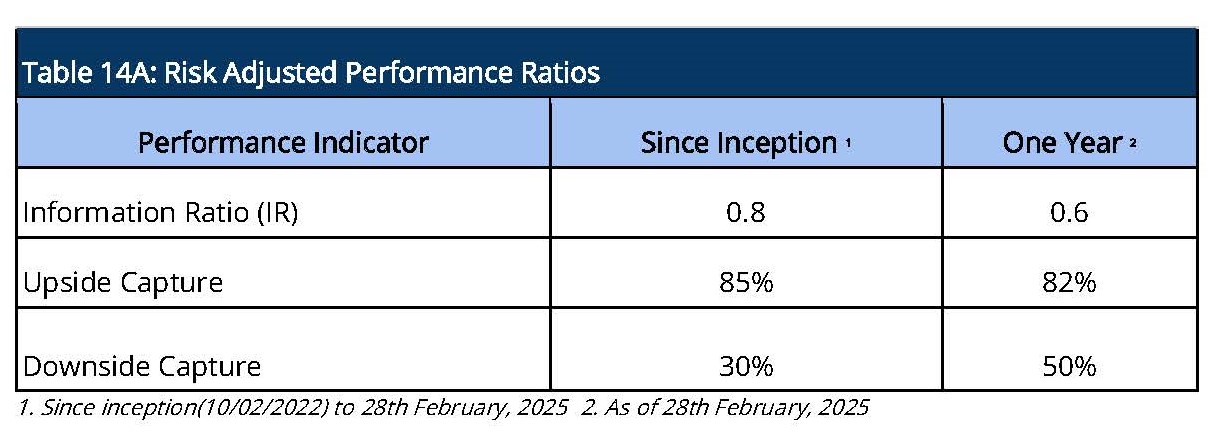
When compared on a risk adjusted basis, our AIF has shown an even stronger performance. The Information Ratio (IR) measures the excess return of a portfolio over a benchmark per unit of active risk. A higher Information Ratio (IR) suggests better risk-adjusted performance.
Moreover, Upside Capture measures how well a fund performs as compared to a benchmark when the benchmark has positive returns. A higher upside capture ratio (> 100%) indicates that the fund captures more of the benchmark’s positive movements. Whereas, Downside Capture measures how well a fund performs compared to a benchmark when the benchmark has negative returns. A lower downside capture ratio (< 100%) indicates that the fund preserves capital better during market downturns.(Table 14A)
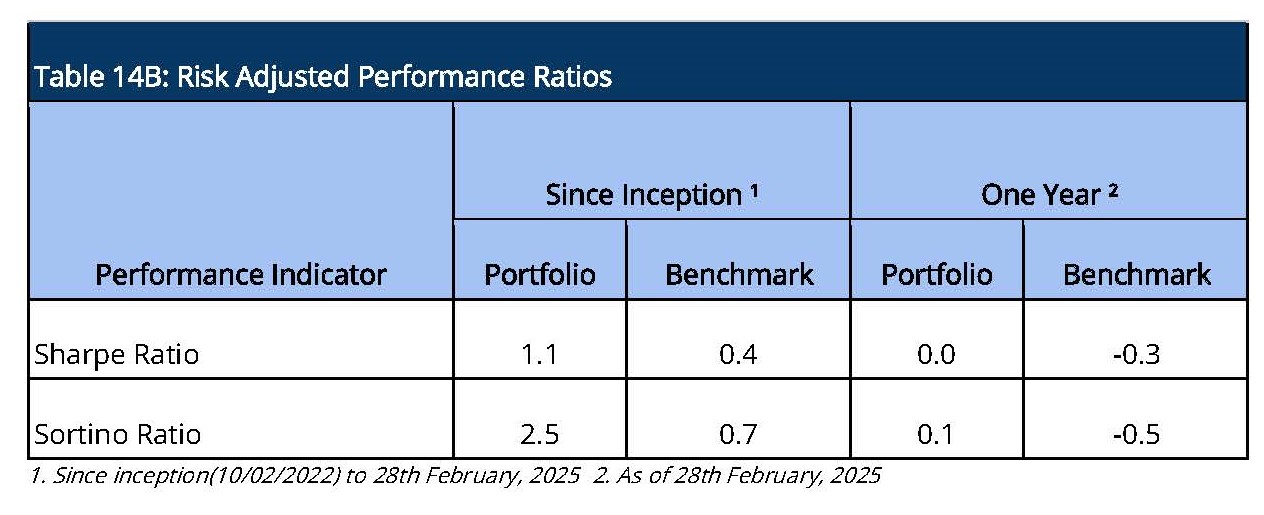
Furthermore, other risk-adjusted returns – Sharpe ratio is also significantly higher. The Sortino ratio measures the risk-adjusted return of an investment, focusing only on the downside risk. A higher Sortino ratio indicates better risk-adjusted returns, particularly with respect to downside risk.(Table 14B).
Performance within the AIF Universe
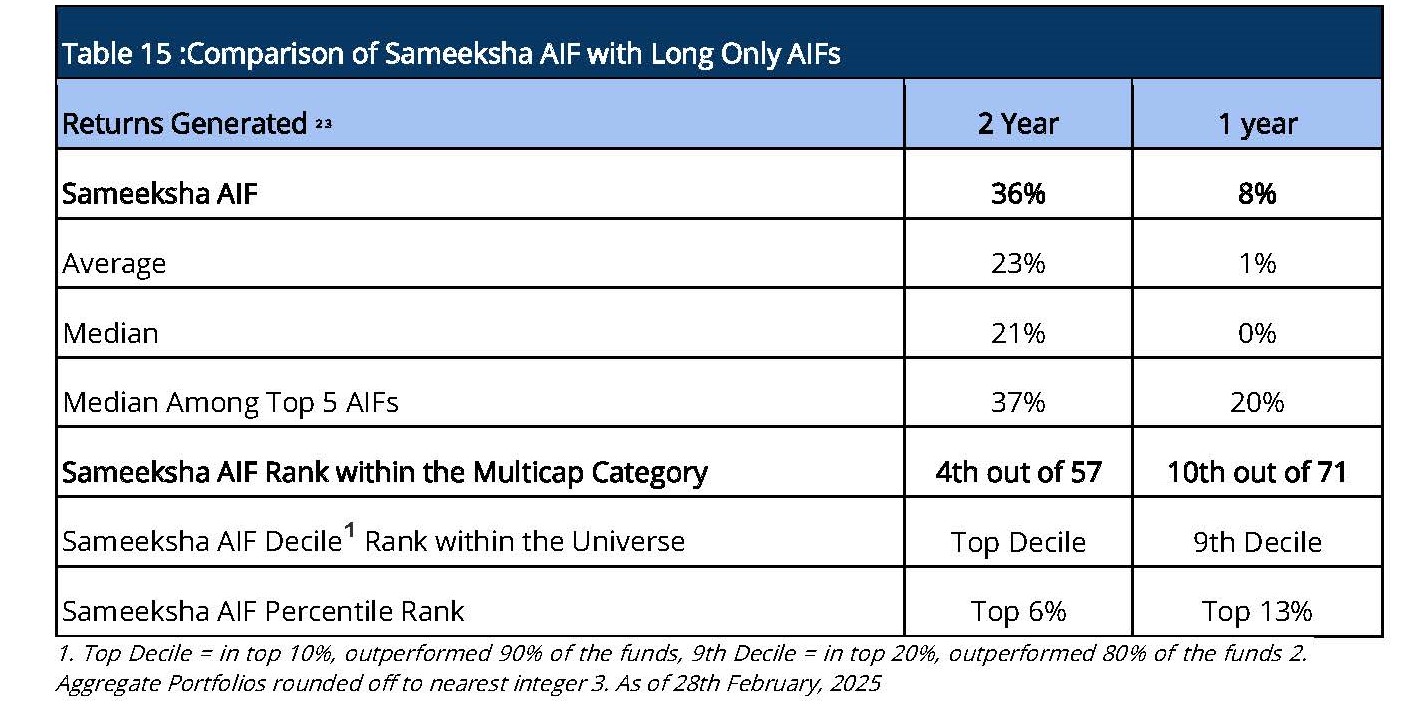
We present our rankings among Long Only Category III AIFs. For the period ending 28th February, 2025 , we are ranked 4th out of 57 AIFs for the two year period, or top Decile and 10th out of 71 AIFs for the one year period (Table 15), or 6th Decile. Because there is a lot of divergence in the way funds report their returns (post exp & tax; post exp, pre tax; gross returns; and post exp & tax pre perf. fees &) , we are doing comparison on a gross return basis to cover the entire applicable universe of funds.
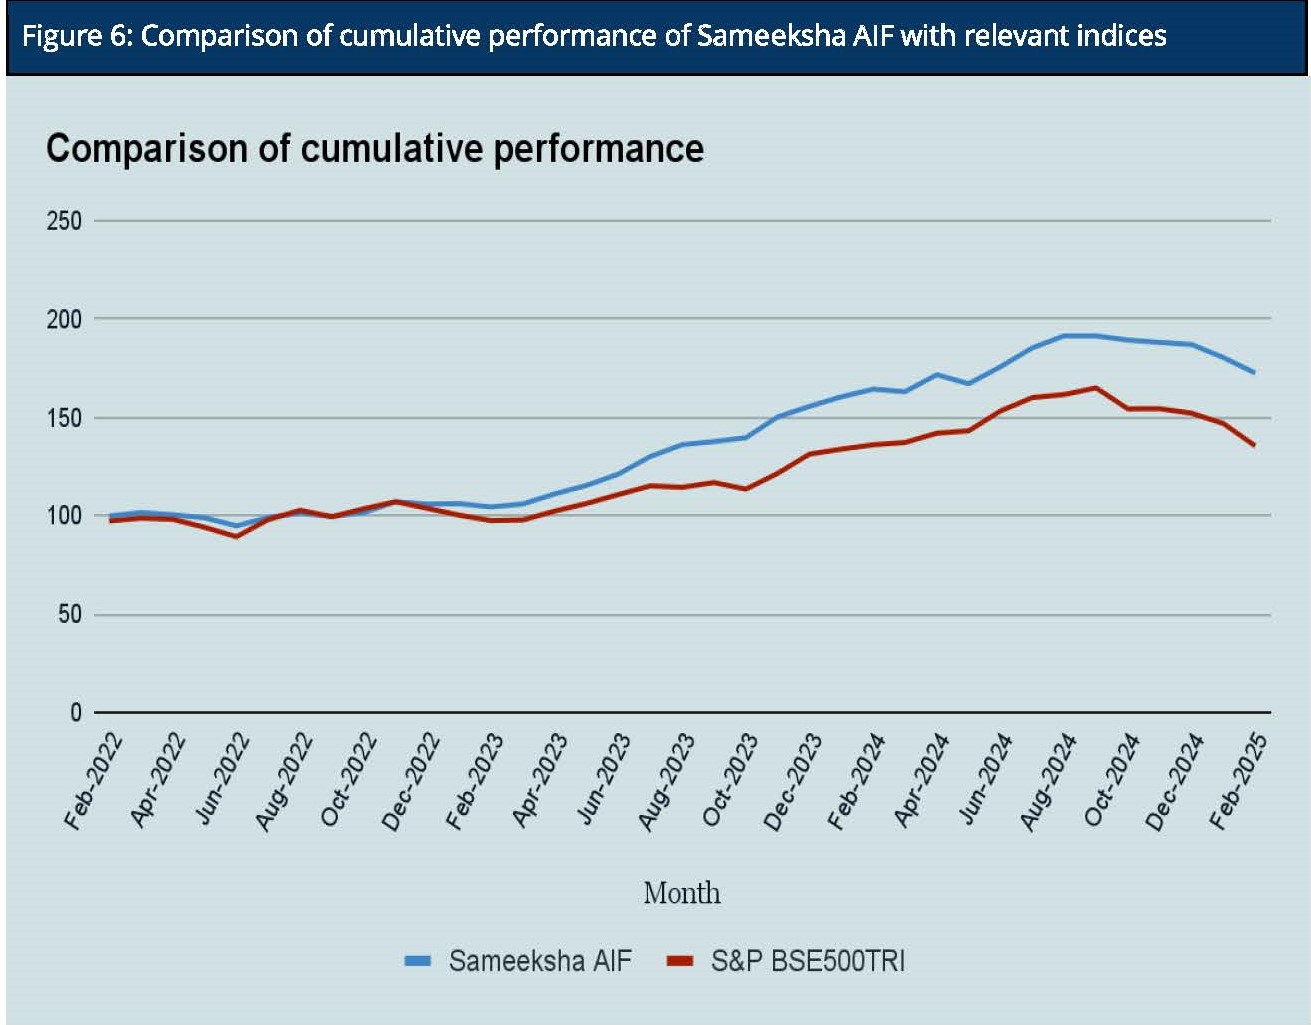
Cumulative Performance versus the benchmark
Sameeksha AIF’s outperformance over its benchmark has continued to widen positively since inception. An investment of Rs. 100 with us since inception (Feb 10,2022) would have grown to Rs. 173, far outpacing what one would have earned by investing in a fund that achieved benchmark returns (Figure 6).
Analyzing the sector performance during the month
Sameeksha AIF outperformed the benchmark in February 2025, driven by strong contributions from the Finance, Aviation, and Trading sectors. This reflects effective sectoral allocation and selection. On the downside, underperformance in Business Services, Healthcare, and Chemicals highlighted sector-specific challenges relative to the benchmark. However, the fund’s decision to avoid exposure to Capital Goods and Crude Oil proved beneficial, as these sectors negatively impacted the benchmark. Several other sectors had a neutral or negligible impact compared to the benchmark, indicating a balanced portfolio strategy. (Table 16).
Disclaimer – The information contained in this update is provided by our fund accounting platform and is not audited. This document is for informational purposes only and is not intended for solicitation to residents of the United States or any other jurisdiction which would subject Sameeksha Capital or its affiliates to any registration requirement within such jurisdiction or country. It does not constitute an offer to buy or sell securities or financial instruments. Recipients are advised to conduct their own research and seek professional advice before making any investment decisions.