We continue to rank among the best for the long term performance. For the three year period ending September 30th 2021, we are ranked 1st out of 79 multicap PMSes reporting to PMS Bazaar. For the five year period also ending 30th September 2021, we are ranked 3rd out of 53 multicap PMSes.
Though a strong rally in small and mid cap stocks over the last 18 months have greatly aided performance of the small and mid cap focussed PMSes (which form a substantial fraction of the PMS universe), we still rank among the best across the entire PMS universe tracked by PMS Bazaar. We are ranked second out of 153 PMSes for the three year period and fourth out of 98 PMSes for the five year period.
As defined by our strategy, we have maintained relatively higher levels of cash (14% on average over the entire period from inception) from time to time over the duration of managing the portfolio. Notwithstanding that, from inception (= five and half years) as well as over five and three years respectively, we have generated returns of 25.3%, 25.2% and 42.5% versus the benchmark CNX500 TRI returns of 18.1%, 16.5% and 19.5%. Most importantly, clients investing with us across extended time periods have enjoyed meaningful alpha irrespective of the time of their entry.
Portfolio Returns
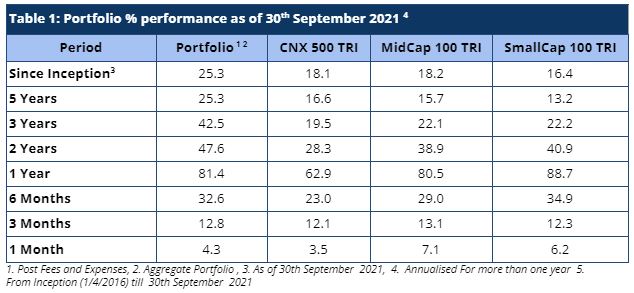
Broader markets remained upbeat in September 2021 with mid and small-caps rallying significantly (Table 1). We worked with a lower level of cash in September at around 8-9% versus August at high teens. As such, we choked out small alpha for the month with absolute returns of 4.3% versus 3.5% return for our benchmark CNX500 TRI. As can be observed in Table 1, we have strongly outperformed our benchmark index across all the relevant key periods – especially for longer periods where the outperformance is much more meaningful.
Performance within the PMS Universe
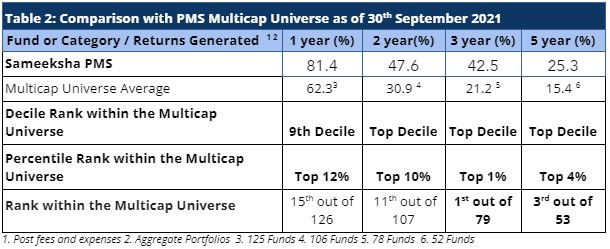
We continue to maintain our top rankings both within the multicap PMS universe as well as the entire PMS universe. The multicap PMS universe rankings are more relevant to us since we follow multicap strategy.
For the three year period, we are ranked number one out of seventy nine PMSes. In the same vein, we are ranked third out of fifty three funds for the five year period comparison within the Multicap universe – highlighting our superior performance over the long term. We notice that while our performance over the last 12-18 months is far ahead of the benchmarks and universe averages, we are not among the top 5% and that is likely due to our focus on not following BAAP (Buy At Any Price) philosophy increasingly popular in such an extended bull market.
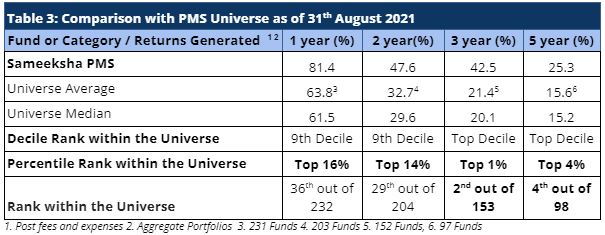
Strong performance in mid and small-cap stocks for most part of the year has enabled PMSes focussed on those categories to deliver strong one-year performance. However, over longer periods of three and five years, we have retained our top decile position and top 5% rank when compared with the entire PMS universe (Table 3). We are ranked 4th out of 98 funds based on five-year data and 2nd out of 153 funds for three-year data.
Comparison of Rolling Returns with other funds
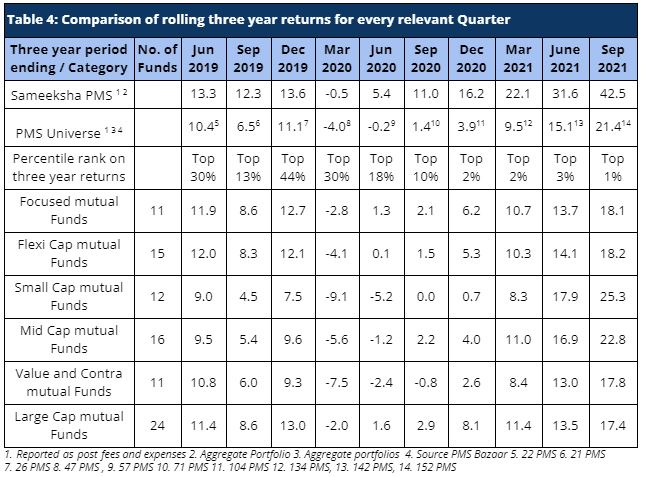
Rolling returns are a more useful indicator of consistency in performance versus single period returns. For a three year period ending September 2021, we have meaningfully outperformed all the major relevant mutual fund categories that we are comparable with and have maintained our top decile ranking across both our comparable universe of Multicap PMSes as well as across the entire PMS universe (Table 4). Furthermore, for the last four quarters, we have been consistently ranked among the top 3% and are in the top 1% for September 2021.
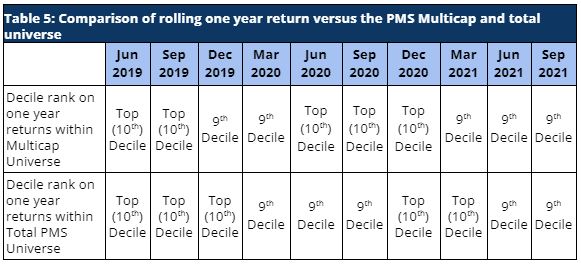
Similarly, our rolling one-year returns have been strong and we have maintained our rankings in the top two deciles across the PMS universe consistently over the last two years (Table 5).
Performance Of Individual Portfolios
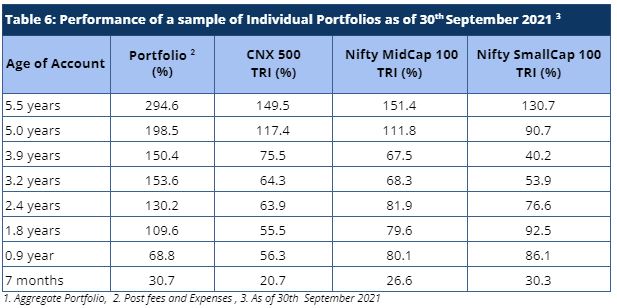
Irrespective of their investment timings, the portfolio returns of our clients continue to outpace the benchmarks by a significant margin (Table 6). Portfolio returns for clients who have been with us for longer periods have seen remarkably strong alpha. For a long term investor, Sameeksha PMS has proven to be a valuable partner for their investments.
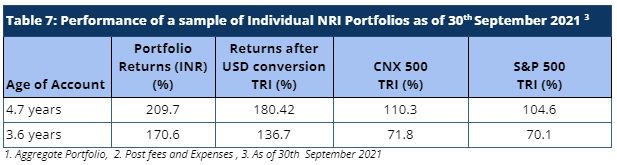
Similarly, our NRI clients have seen strong returns even after factoring rupee depreciation against US dollars. The portfolio returns are significantly higher than both CNX 500 TRI and S&P 500 TRI, generating strong alpha over both these indices.
Cumulative Performance versus the benchmark
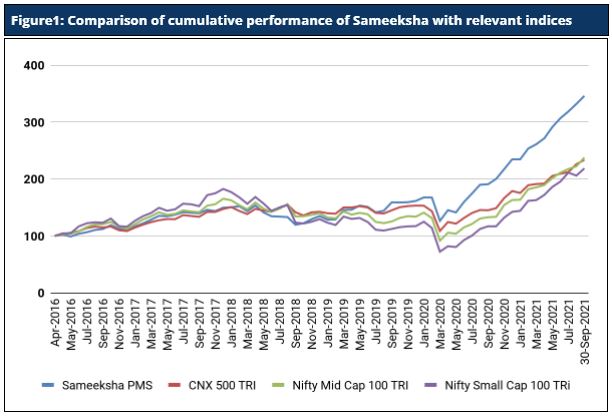
Sameeksha’s outperformance over its benchmark has continued to widen positively over the years. An investment of Rs. 100 with us since inception (April 2016) would have grown to Rs. 346, far outpacing what one would have earned by investing in a fund that achieved benchmark returns (Figure 1).
Fund Performance on a Financial Year basis
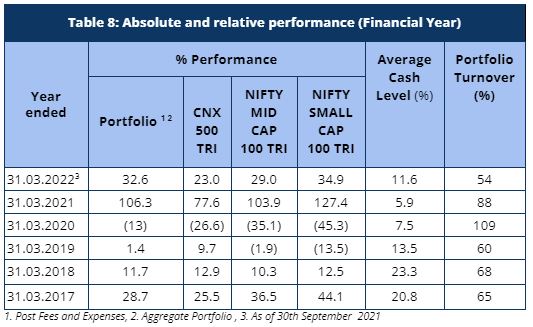
Sameeksha PMS generated a return of 32.6% in five months (April – September 2021) of the current financial year ending March 2022, outperforming its benchmark index CNX 500 TRI – which returned 23.0% over the same period (Table 8). Discerning investors would notice that we have delivered this performance despite maintaining a meaningful percentage of our portfolio in cash from time to time and that is well reflected in our risk-adjusted-performance outcomes.
When we compare the portfolio performance across financial years, we have clearly out-performed our benchmark almost all financial years except for one notable underperformance. However, our cumulative out-performance far exceeds the under-performance in that year.
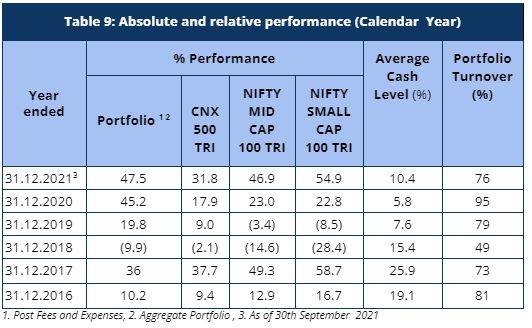
Similarly, when we compare our performance across calendar years, we have again outperformed the benchmark consistently (Table 9) despite maintaining such high cash levels.
Underperformance versus small cap over last one year
As such, as a key risk management practice, we limit our exposure to small caps both in terms of position size as well as in terms of number of total positions in the portfolio. This approach has certainly caused us to under-perform the small cap index over the last one year (Figure 2). However, we are painfully aware of the havoc high exposure to small caps can cause when there is a correction in the overall market. When measured from a sample period of 2006 to 2021, the Small cap valuations based on P/B is in the highest 5% of its historical values and are two SD (Standard Deviation) above median. The ratio of small cap to large cap valuation is almost three SD above median today and within 10% of its highest value ever. On an absolute basis, we saw higher valuations for small caps only in the euphoric period of 2007.
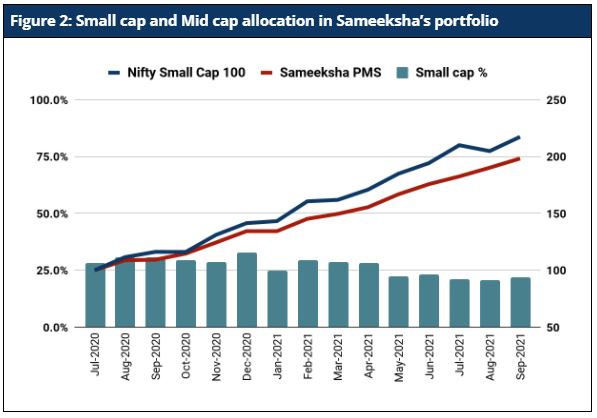
Having learned from our experience in 2018, we have chosen to limit our exposure to small caps as these stocks have continued to skyrocket. As can be seen in Figure 2, our small cap exposure today is close to the lowest over the last 15 months. Our current exposure (21.8%) is one SD lower than our median exposure (35.5%).
Risk Adjusted Ratios
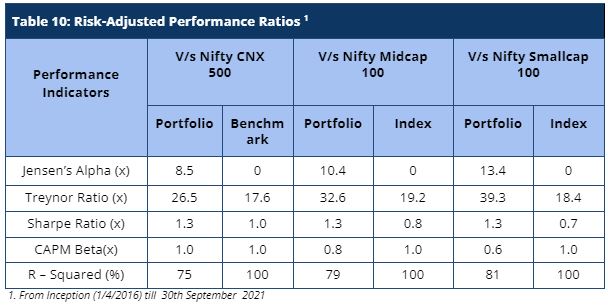
When compared on a risk-adjusted basis (Table 10), our PMS shows even stronger performance with a risk-adjusted alpha generation of 8.5% over the broad market benchmark since its inception.
Furthermore, other risk-adjusted returns – Sharpe ratio and Treynor ratio, are also significantly higher than the benchmark indices (Table 8). It is worth noting that we offer superior risk adjusted returns not only compared to the broad CNX500 index heavily weighted towards large cap but also the small cap and mid cap benchmarks as demonstrated by our sharpe ratio, alpha, Treynor ratio and beta.
Please let us know if you have any questions.
Disclaimer : The information contained in this update is based on data provided by our fund accounting platform and is not audited.