After two successive months of rise, the benchmark BSE500TRI ended at -3.22% with BSE MidcapTRI and BSE Smallcap TRI at -2.05% and -0.56%, respectively in September 2022. This month started with a positive sentiment. However, the FII outflows, weaker rupee, interest rate hikes and recession fears led to a fall by the end of the month. Though we also had a negative performance this month down 0.68%, we did carve out an outperformance of 2.5% versus our benchmark of BSE500TRI.
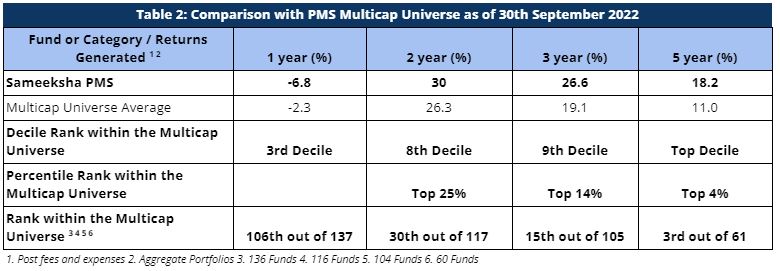
Among the multicap PMS universe tracked by PMS Bazaar, we are ranked 3rd out of 61 multicap PMSes for the five year period ending September 2022. For the three year period ending September 2022, we are ranked 15th out of 105 multicap PMSes reporting to PMS Bazaar. We point out that our performance is net of all the fees. There is a possibility that for some funds, fees may be collected directly from clients and hence not factored into performance. As such, on net basis our performance may not be exactly comparable.
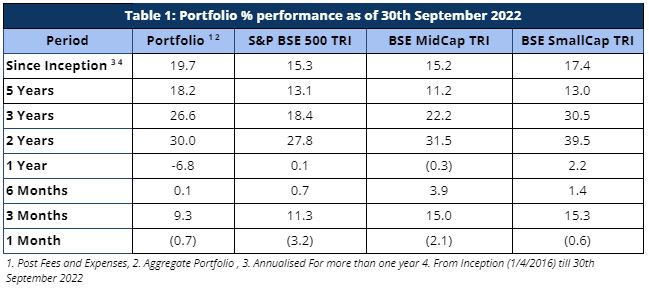
As defined by our strategy, we have maintained relatively higher levels of cash (14% on average over the entire period from inception) from time to time over the duration of managing the portfolio. Notwithstanding the same, from inception as well as over five and three years respectively, we have generated returns of 19.74%, 18.23% and 26.61% beating the benchmark BSE500 TRI returns of 15.29%, 13.07% and 18.36% respectively.
Portfolio Returns
For this month, the broader market ended at -3.22% returns. BSE Midcap TRI and BSE Smallcap TRI returned -2.05% and 0.56%, respectively. If August was a month of hope, September was a reality check with worsening global growth outlook, stubborn inflation both globally and domestically as well as interest rates increase by Fed as well as RBI. While banks had a slight positive impact of the rate hikes, the rate sensitive sectors like Realty, Oil & Gas, Auto took a big hit during the month. Further, Aviation, Capital goods, IT , and Insurance sectors also performed poorer than the benchmark. The other sectors that gave negative returns during the month but still performed better than the benchmark BSE500TRI are inter alia Banks, Media and Entertainment, and Telecom. The Healthcare sector generated positive returns and outperformed the benchmark. For this month, Sameeksha PMS has outperformed the benchmark by generating -0.68% returns. As our portfolio was not concentrated towards the sectors that suffered this month i.e. Auto and Oil & Gas, we could manage the outperformance. However, our performance was impacted by the negative returns in the IT, Realty and Insurance sectors.
While our returns are significant for longer periods, we are not happy with our performance over the last one year. Much of the underperformance for the last one year ending September 2022 is attributed to our performance for the last financial year and the same is discussed in our annual investor letter, including what did and did not work well for us.
As can be observed in Table 1, we have strongly outperformed our benchmark index across all the other relevant key periods –
Performance within the PMS Universe
We continue to maintain our top rankings both within the multicap PMS universe as well as the entire PMS universe for key periods of three and five years. The multicap PMS universe rankings are more relevant to us since we follow multicap strategy.
For the three year period, we are ranked 15th out of 105 PMSes. Further, we are ranked 3rd out of 61 funds for the five year period comparison within the Multicap universe – highlighting our superior performance over the long term (Table 2).
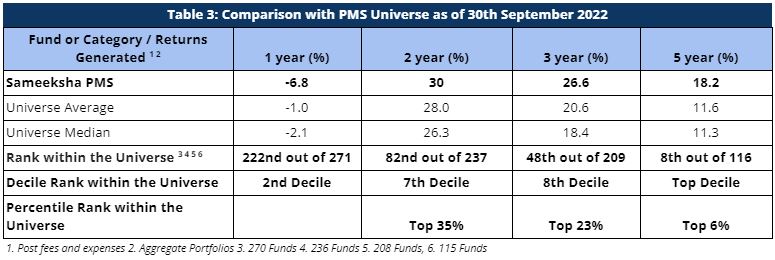
When compared with the entire PMS universe, we have maintained top rankings for longer key periods. We are consistently ranked in the Top Decile for the five year period (Table 3).
Fund Performance on a Financial Year and Calendar Year basis
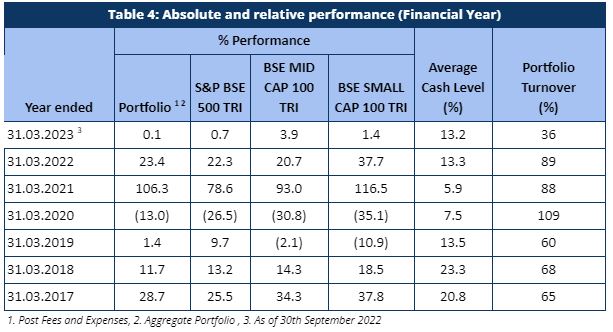
For the first 6 months of the current financial year ending March 2023 (April 2022 to September 2022), Sameeksha PMS has underperformed the benchmark BSE 500 TRI by generating 0.1% returns for the period against the benchmark 0.7% returns (Table 4). It is pertinent to note that for the financial year ending March 2023, one would consider our performance reasonable considering the cash level of 13.2%. Further, we would like to highlight that while our portfolio turnover is high, our risk adjusted ratios since inception (discussed in the ensuing paragraphs) are very strong, indicating lower portfolio volatility compared to the benchmark. We believe that maintaining lower volatility of the portfolio is more important than lower turnover ratio, and we continue to deliver lower portfolio volatility.
Looking at our performance over the financial years, we have outperformed our benchmark in four out of seven financial years. Key however is that the sum of outperformance in those four years far exceeds the sum of underperformance in the remaining three years (including the current incomplete financial year).
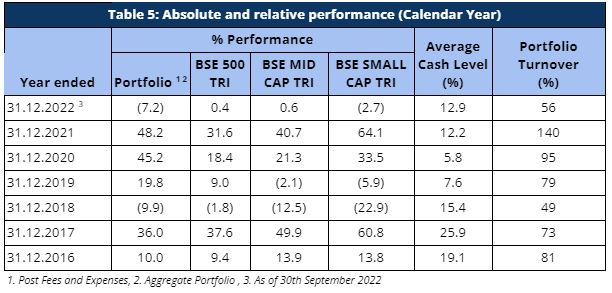
The performance pattern on a calendar year basis has been quite similar as well (Table 5). Although, for the current calendar year 2022, we are underperforming the benchmark, for the recently completed calendar year ending 2021, we have generated a return of 48.2% with an alpha of 16.6% over our benchmark BSE 500 TRI.
Rolling Returns and Rankings
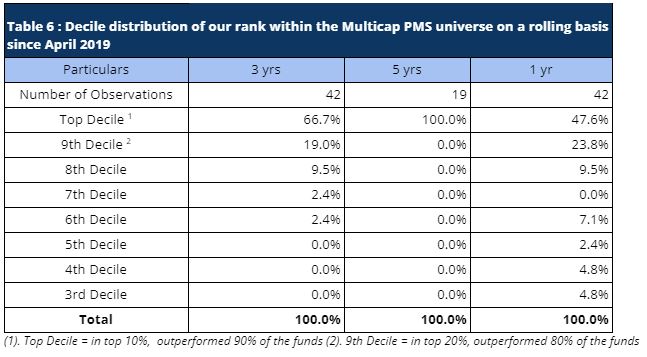
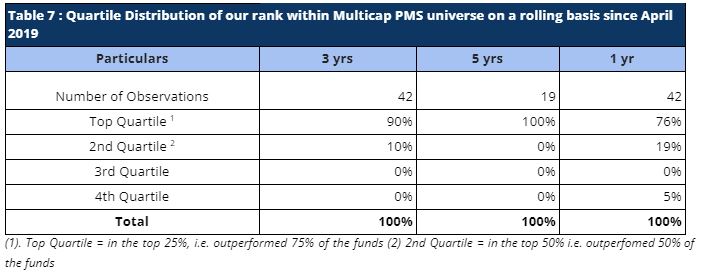
Rolling returns are a more useful indicator of consistency in performance versus single period returns. For the rolling three year periods applicable for our entire operating history, we have been ranked among the multicap universe in the top decile 66.7% of the time (28 out of 42 observations) and in top Quartile 90% of the time (38 out of 42 observations). For the remaining 10% observations, we were ranked in the second quartile (Tables 6 and 7). For the rolling five year periods applicable for our entire operating history, we have been ranked among the multicap universe in the Top Decile 100% of the time (19 out of 19 observations).
Performance Of Individual Portfolios
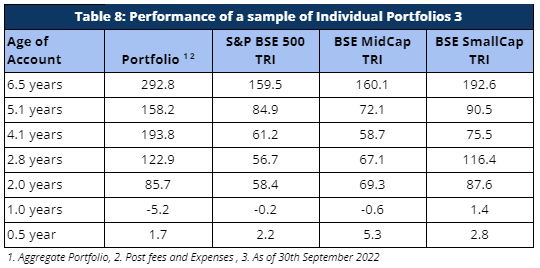
Portfolio returns for clients, except for investors starting with us over the last one year have seen remarkably strong alpha (Table 8). For a long term investor, Sameeksha PMS has proven to be a valuable partner for their investments. Performance of portfolios of clients who joined us in the last one year is a matter of concern that we hope to be able to address over time.
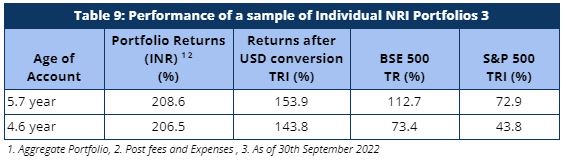
Our NRI clients have seen strong returns even after factoring in rupee depreciation against US dollars. The portfolio returns are significantly higher than both BSE 500 TRI and S&P 500 TRI, generating strong alpha over both these indices (Table 9).
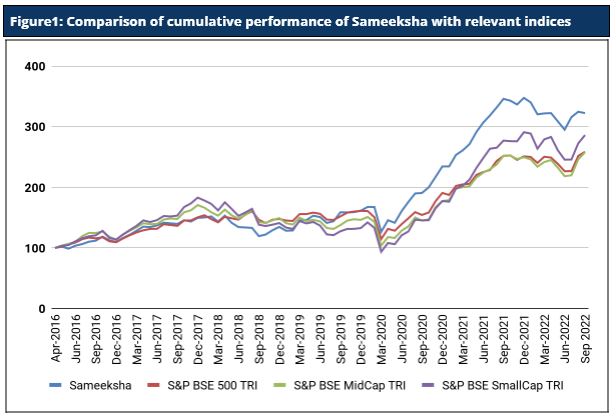
Cumulative Performance versus the benchmark
Sameeksha’s outperformance over its benchmark has continued to widen positively over the years. An investment of Rs. 100 with us since inception (April 2016) would have grown to Rs. 322, far outpacing what one would have earned by investing in a fund that achieved benchmark returns (Figure 1).
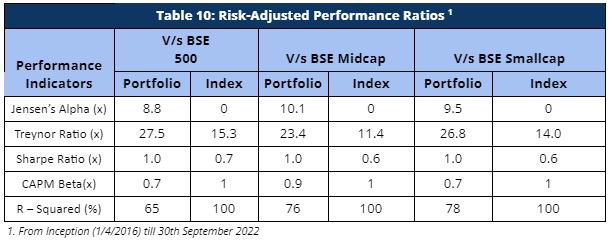
Risk Adjusted Ratios
When compared on a risk-adjusted basis (Table 10), our PMS shows even stronger performance with a risk-adjusted alpha generation of 8.8% over the broad market benchmark since its inception. While our portfolio beta has been materially lower than our benchmark, our returns have been higher than the benchmark since inception, implying superior strong risk adjusted returns.
Furthermore, other risk-adjusted returns – Sharpe ratio and Treynor ratio, are also significantly higher than the benchmark indices (Table 10). It is worth noting that we offer superior risk adjusted returns not only compared to the broad BSE 500 index heavily weighted towards large cap but also the small cap and mid cap benchmarks as demonstrated by our Sharpe ratio, Alpha, Treynor ratio and Beta.
Disclaimer : The information contained in this update is based on data provided by our fund accounting platform and is not audited