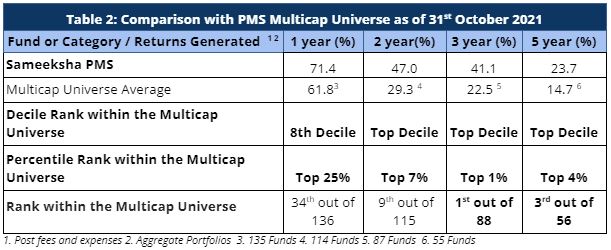
Sameeksha PMS continues to rank among the best for the long term performance. For the three year period ending October 31st 2021, we are ranked 1st out of 88 multicap PMSes reporting to PMS Bazaar. For the five year period also ending 31st October 2021, we are ranked 3rd out of 56 multicap PMSes.
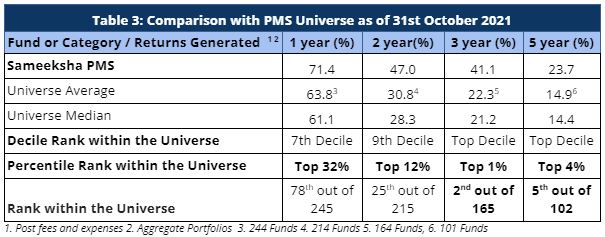
In addition, we also rank among the best across the entire PMS universe tracked by PMS Bazaar. We are ranked 2nd out of 165 PMSes for the three year period and 5th out of 102 PMSes for the five year period.
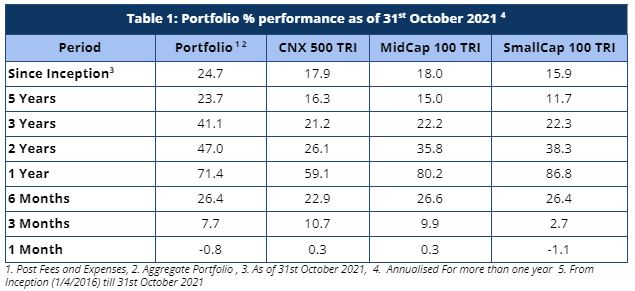
As defined by our strategy, we have maintained relatively higher levels of cash (14% on average over the entire period from inception) from time to time over the duration of managing the portfolio. Notwithstanding that, from inception (five and half years+) as well as over five and three years respectively, we have generated returns of 24.7%, 23.7% and 41.1% versus the benchmark CNX500 TRI returns of 17.9%, 16.3% and 21.2%. Most notably, clients investing with us across extended time periods have enjoyed meaningful alpha irrespective of the time of their entry.
Weak October and lower alpha over last one year
Broader markets remained volatile in October 2021 with the broader index (CNX 500 TRI) remaining flat and small-caps generating negative returns after rallying significantly for most part of the last 18 months (Table 1). For October 2021, we had a marginally negative return of -0.8% after a string of consecutive positive returns for the last 8 months and only second in the last 16 months.
However, we notice that while our performance over the last 12 months is materially superior relative to our benchmark, we are only among the top quartile within our multicap universe. We also acknowledge under performance relative to small and mid cap indices over the last one year. We have consciously chosen to be very selective in investing in small and mid cap space and have remained wedded to our core investment strategy of not chasing BAAP (Buy At Any Price) stocks. Still, more work needs to be done to evaluate what we have missed and how we can improve. We will discuss this through a separate communication.
Performance within the PMS Universe
We continue to maintain our top rankings both within the multicap PMS universe as well as the entire PMS universe. The multicap PMS universe rankings are more relevant to us since we follow multicap strategy.
For the three year period, we are ranked number one out of eighty eight PMSes. In the same vein, we are ranked third out of fifty six funds for the five year period comparison within the Multicap universe – highlighting our superior performance over the long term.
Strong performance in mid and small-cap stocks for most part of the year has enabled PMSes focussed on those categories to deliver strong one-year performance. However, over longer periods of three and five years, we have retained our top decile position when compared with the entire PMS universe (Table 3). We are ranked 5th out of 102 funds based on five-year data and 2nd out of 165 funds for three-year data.
Comparison of Rolling Returns with other funds
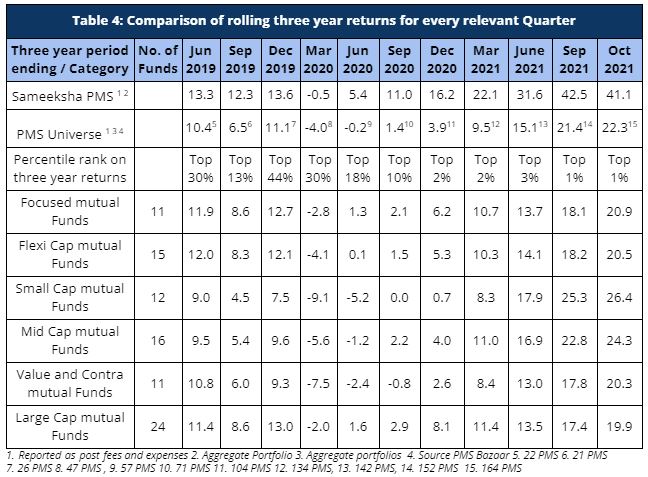
Rolling returns provide a much better comparison than a snapshot of one period. We continue to come out extremely well on this measure on a three-year basis when compared to the PMS universe as well as relevant categories of mutual funds – focused, flexi-cap, small-cap, mid-cap, value, and contra funds (Table 4). We have continued to maintain our top decile ranking across both our comparable universe of Multicap PMSes as well as across the entire PMS universe.
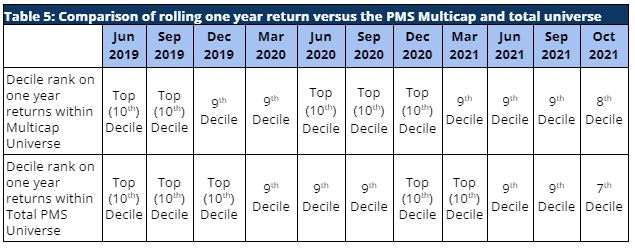
Similarly, our rolling one-year returns have been strong as well and we have maintained our rankings in the top two deciles across the PMS universe over most part of the last two years (Table 5).
Performance Of Individual Portfolios
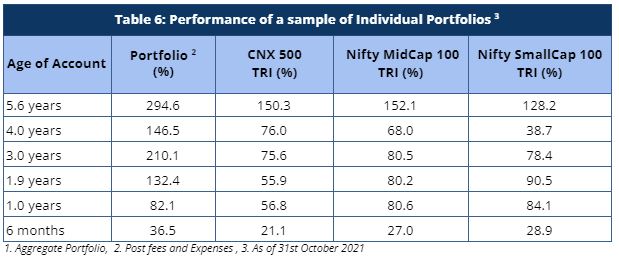
Irrespective of their investment timings, the portfolio returns of our clients continue to outpace the benchmarks by a significant margin (Table 6). Portfolio returns for clients who have been with us for longer periods have seen remarkably strong alpha. For a long term investor, Sameeksha PMS has proven to be a valuable partner for their investments.
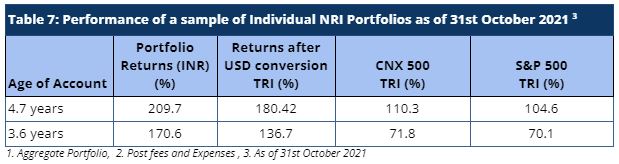
Similarly, our NRI clients have seen strong returns even after factoring in rupee depreciation against US dollars. The portfolio returns are significantly higher than both CNX 500 TRI and S&P 500 TRI, generating strong alpha over both these indices.
Cumulative Performance versus the benchmark
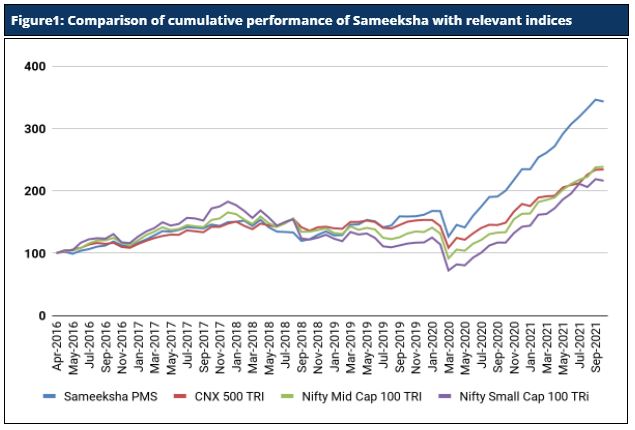
Sameeksha’s outperformance over its benchmark has continued to widen positively over the years. An investment of Rs. 100 with us since inception (April 2016) would have grown to Rs. 343, far outpacing what one would have earned by investing in a fund that achieved benchmark returns (Figure 1).
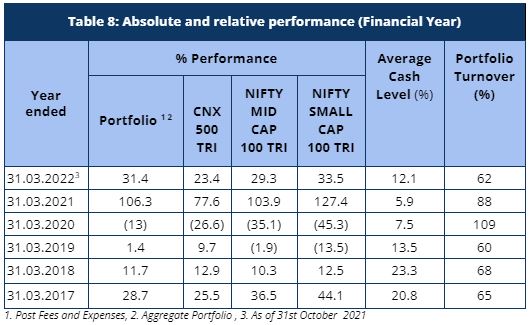
Fund Performance on a Financial Year basis
Sameeksha PMS generated a return of 31.4% in five months (April – October 2021) of the current financial year ending March 2022, outperforming its benchmark index CNX 500 TRI – which returned 23.4% over the same period (Table 8). Discerning investors would notice that we have delivered this performance despite maintaining a meaningful percentage of our portfolio in cash from time to time and that is well reflected in our risk-adjusted-performance outcomes.
When we compare the portfolio performance across financial years, we have clearly out-performed our benchmark almost all financial years except for one notable underperformance. However, our cumulative out-performance far exceeds the under-performance in that year.
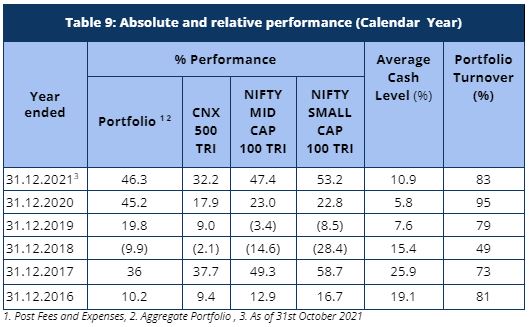
Similarly, when we compare our performance across calendar years, we have again outperformed the benchmark consistently (Table 9) despite maintaining such high cash levels.
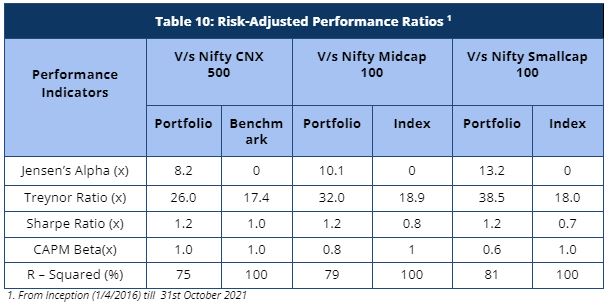
Risk Adjusted Ratios
When compared on a risk-adjusted basis (Table 10), our PMS shows even stronger performance with a risk-adjusted alpha generation of 8.2% over the broad market benchmark since its inception.
Furthermore, other risk-adjusted returns – Sharpe ratio and Treynor ratio, are also significantly higher than the benchmark indices (Table 8). It is worth noting that we offer superior risk adjusted returns not only compared to the broad CNX500 index heavily weighted towards large cap but also the small cap and mid cap benchmarks as demonstrated by our sharpe ratio, alpha, Treynor ratio and beta.
Please let us know if you have any questions.
Disclaimer : The information contained in this update is based on data provided by our fund accounting platform and is not audited.