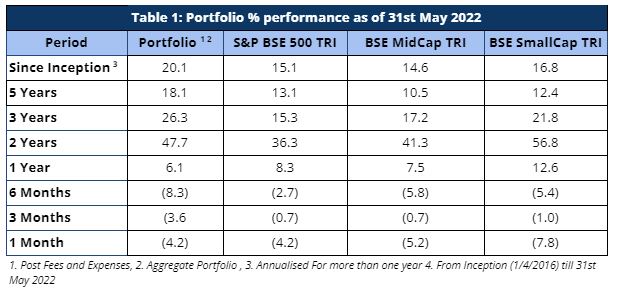
While April called for cautious moves, May brought in its share of surprises to the Indian stock markets. In May, RBI shocked the Indian markets with a 40-basis-point repo rate hike after an unscheduled MPC meeting. With headline retail inflation surging and global commodity prices remaining elevated, it is taken as a given that the RBI will further tighten the monetary policy. In this backdrop, the performance of the market indices for May 2022 was weak with benchmark BSE 500 TRI generating returns of -4.2%. Notwithstanding that we had higher exposure to small and mid cap stocks (48%) versus the benchmark (21%) and the mid cap (-5.2%) and small cap (-7.8%) indices both declined more than the multicap benchmark, our portfolio declined by the same (-4.2%) as the BSE 500 TRI benchmark.
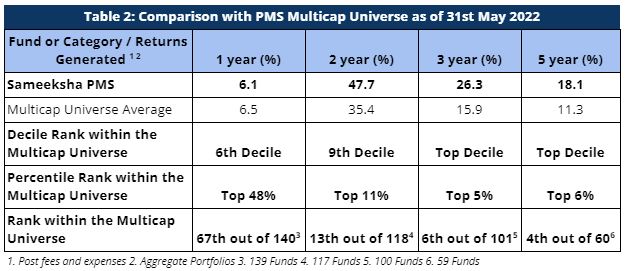
Notwithstanding weak performance over the last one year, we continue to rank among the best for the long term performance. For the three year period ending May 2022, we are ranked 6th out of 101 multicap PMSes reporting to PMS Bazaar. For the five year period as well, we are ranked 4th out of 60 multicap PMSes.
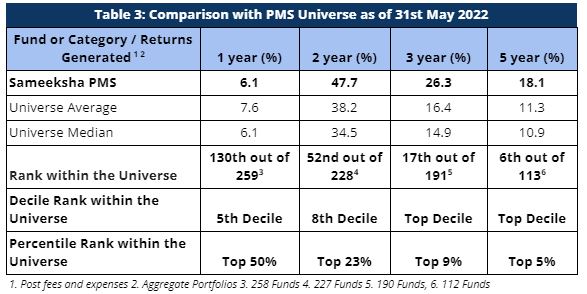
Despite the volatile movement of the market for the last several months, we are still ranked in the top decile among the entire PMS universe by being the 17th among 191 PMSes for the three year period and the 6th among 113 PMSes for the five year period.
As defined by our strategy, we have maintained relatively higher levels of cash (14% on average over the entire period from inception) from time to time over the duration of managing the portfolio. Notwithstanding the same, from inception as well as over five and three years respectively, we have generated returns of 20.1%, 18.1% and 26.3% beating the benchmark BSE500 TRI returns of 15.1%, 13.1% and 15.3% respectively.
Portfolio Returns
For the month of May 2022, broader markets ended on a poor note with BSE 500 TRI generating a return of -4.2% and the midcap and small cap indices also performing poorly, generating a return of -5.2% and -7.8% respectively. We also had a down month with a return of -4.2%. Our performance over last year is nothing to ride home about, However, it is pertinent to note that for longer periods where the outperformance is much more relevant, we have strongly outperformed our benchmark index across all the relevant key periods (>1 year) – as can be observed in Table 1.
Performance within the PMS Universe
We continue to maintain our top rankings both within the multicap PMS universe as well as the entire PMS universe for key periods of three and five years. The multicap PMS universe rankings are more relevant to us since we follow multicap strategy.
For the three year period, we are ranked 6th out of 101 PMSes. In the same vein, we are ranked 4th out of 60 funds for the five year period comparison within the Multicap universe – highlighting our superior performance over the long term.
When compared with the entire PMS universe, we have maintained top rankings for longer key periods. We are ranked 17th out of 191 PMSes for the three year period and 6th out of 113 PMSes for the five year period.
Rolling Returns and Rankings
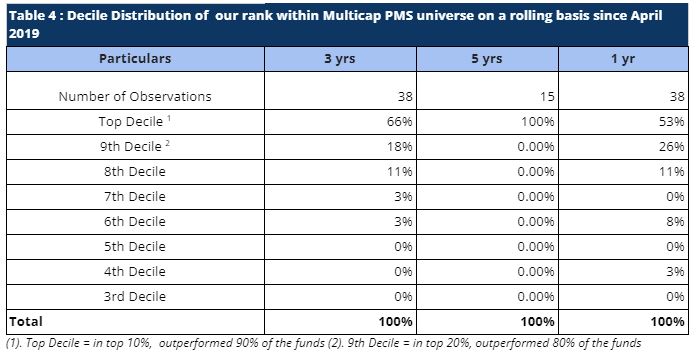
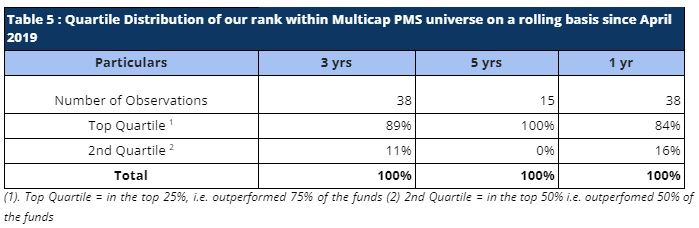
Rolling returns are a more useful indicator of consistency in performance versus single period returns. For the rolling three year periods applicable for our entire operating history, we have been ranked among the multicap universe in the top decile 66% of the time (25 out of 38 observations) and in top Quartile 89% of the time (34 out of 38 observations). For the remaining 11% observations, we were ranked in the second quartile (Tables 4 and 5). Also, for the three year period, we have remained in top decile every single month on a consecutive basis for almost two years since July 2020. Similarly, for the rolling five year periods applicable for our entire operating history, we have been ranked among the multicap universe in the Top Decile 100% of the time (15 out of 15 observations).
Performance Of Individual Portfolios
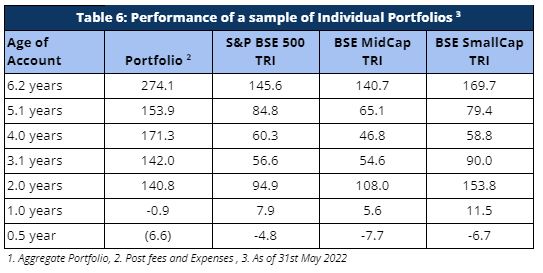
Portfolio returns for clients, except for investors starting with us over the last eight months have seen remarkably strong alpha (Table 6). Performance of portfolios of clients who joined us in the last one year is a matter of concern that we hope to be able to address over time. We will also cover this in detail in a separate note.
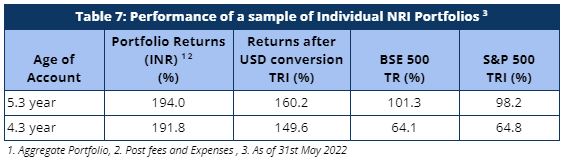
Our NRI clients have seen strong returns even after factoring in rupee depreciation against US dollars. The portfolio returns are significantly higher than both BSE 500 TRI and S&P 500 TRI, generating strong alpha over both these indices.
Cumulative Performance versus the benchmark
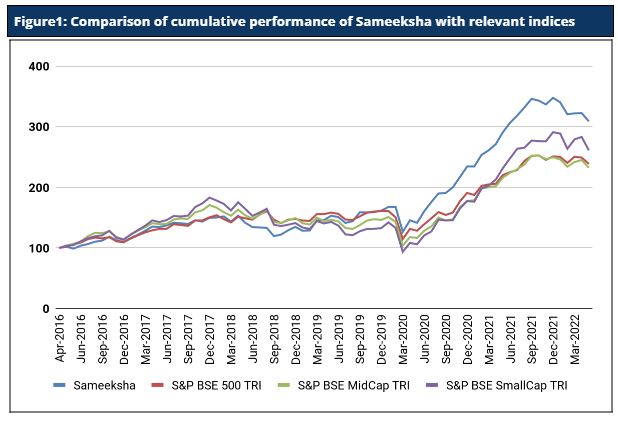
Sameeksha’s outperformance over its benchmark has continued to widen positively over the years. While the performance of the fund has been choppy in the last 12 months, an investment of Rs. 100 with us since inception (April 2016) would have grown to Rs. 309, far outpacing what one would have earned by investing in a fund that achieved benchmark returns (Figure 1).
Fund Performance on a Financial Year and Calendar Year basis
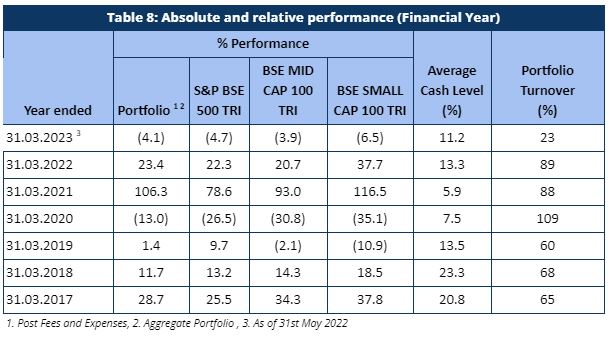
For the first 2 months of the current financial year ending March 2023 (April 2022 to May 2022), Sameeksha PMS marginally outperformed the benchmark BSE 500 TRI by generating -4.1% returns against the benchmark -4.7% returns (Table 8).
Looking at our performance over the financial years, we have outperformed our benchmark in five out of six financial years (including the current incomplete year). Key however is that the sum of outperformance in those five years far exceeds the sum of underperformance in the remaining two years. Also important is that after adjusting for cash exposure, we underperformed the benchmark only in one out of six years.
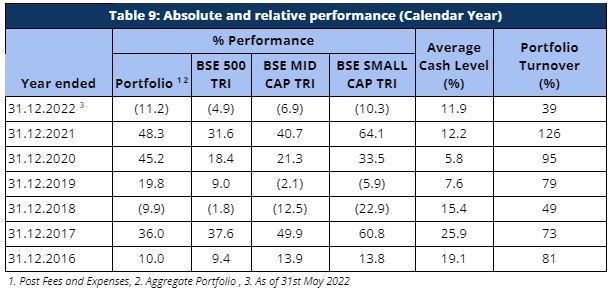
The performance pattern on a calendar year basis has been quite similar as well (Table 9). Although, for the current calendar year 2022, we are underperforming the benchmark (largely due to application of performance fees in March 2022), for the recently completed calendar year ending 2021, we have generated a return of 48.3% with an alpha of 16.7% over our benchmark BSE 500 TRI.
Risk Adjusted Ratios
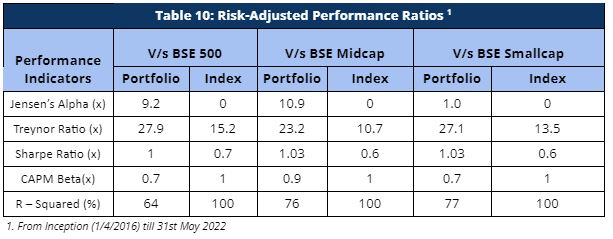
When compared on a risk-adjusted basis (Table 10), our PMS shows even stronger performance with a risk-adjusted alpha generation of 9.2% over the broad market benchmark since its inception. While our portfolio beta has been materially lower than our benchmark, our returns have been higher than the benchmark implying superior strong risk adjusted returns.
Furthermore, other risk-adjusted returns – Sharpe ratio and Treynor ratio, are also significantly higher than the benchmark indices (Table 10). It is worth noting that we offer superior risk adjusted returns not only compared to the broad BSE 500 index heavily weighted towards large cap but also the small cap and mid cap benchmarks as demonstrated by our Sharpe ratio, Alpha, Treynor ratio and Beta.
Disclaimer : The information contained in this update is based on data provided by our fund accounting platform and is not audited