Financial year 2022-23 was not a great year overall for the Indian equity markets. The year ended with the market continuing to clock a monthly slide in the month of March on the back of global uncertainties fueled by a banking crisis. For the financial year, our benchmark index BSE500 TRI was down by 0.9%. This is in contrast to the sharp gains the index achieved in the past two financial years. The Indian equity markets for the year 2022-23 wrestled with many headwinds. Elevated inflation levels and supply chain constraints triggered by the Russia-Ukraine war was the biggest negative catalyst for the equity market. The Covid-19 lockdown in China amplified the said issues. To tame the elevated inflation levels, central banks across the globe, including RBI, hiked interest rates. The higher prices and borrowing costs have raised recession fears in the U.S. and other major economies. Moreover, major events such as the collapse of the Silicon Valley Bank (SVB) and Credit Suisse’s buyout by rival UBS kept the stock markets on the edge by the end of the financial year. FPIs turned net sellers during the financial year, being wary of expensive valuations. However, strong domestic participation cushioned some losses as investors showed confidence in India’s long-term growth story.
In this tough financial year 2022-23, Sameeksha PMS has managed to generate positive absolute return as well as meaningful outperformance as compared to BSE500 TRI. The PMS returned 5.1% before performance fees but with the application of performance fees, our returns came to 4.52%, performing over and above the benchmark BSE500 TRI to the tune of 5.43%.
The Magnificent Seven: As Sameeksha has completed seven years of operating the PMS, it is worth reviewing seven key aspects of our performance:
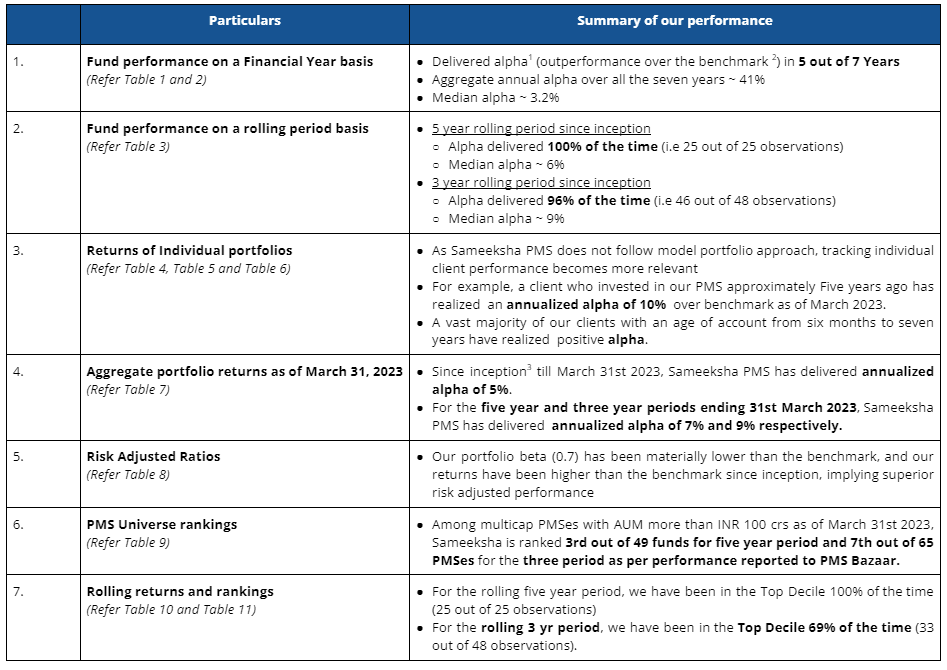
Three important things must always be kept in mind when looking at performance data. First, for funds such as ours that do not follow model portfolio strategy, the performance of individual clients for different duration is important to look at. Second, some PMSes may be charging fees outside the PMS and hence after fees, performance data may not be comparable to ours. Third, it is important to look at not only portfolio returns but also risk adjusted ratios. We provide data to address all three points later in this note.
Fund Performance on a financial year basis
For the current financial year ending March 2023 (April 2022 to March 2023), Sameeksha PMS has outperformed the benchmark BSE 500 TRI by generating 4.5% returns against the benchmark BSE500TRI returns of -0.9% (Table 1). Discerning investors would notice that we have delivered this performance despite maintaining a meaningful percentage of our portfolio in cash from time to time and that is well reflected in our risk-adjusted-performance outcomes.
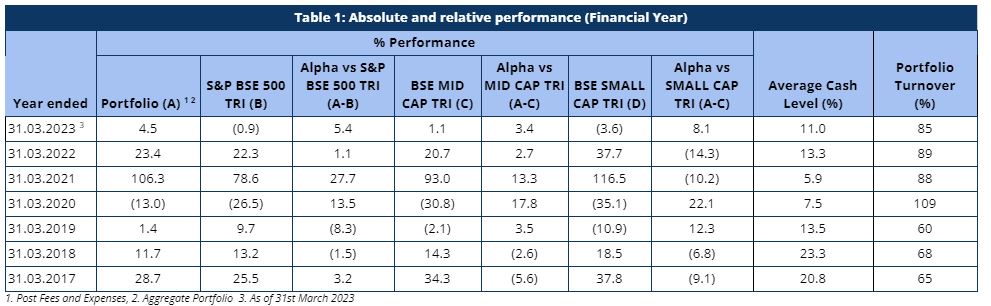
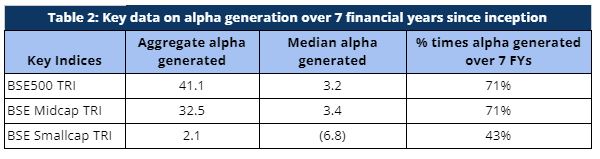
Looking at our performance over the financial years, we have outperformed the broader indices BSE500 TRI and BSE Midcap TRI in five out of seven financial years. That is to say, we managed to carve out an annual alpha 71% of the times over the seven financial years. It is important to note that we delivered this alpha despite maintaining a median cash level of 13.3% across the seven financial years. Further, our PMS has delivered a substantial aggregate annual alpha of 41.1% over BSE500 TRI with a median alpha of 3.2% (Table 2).
Fund performance on a rolling period basis
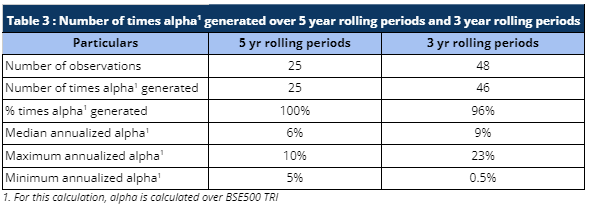
Rolling returns are a more useful indicator of consistency in performance versus single period returns. For the rolling three year periods applicable to our entire operating history, Sameeksha PMS has delivered annualized alpha 96% of the times (46 out of 48 observations) ranging from 0.5% to 23% alpha. For the rolling five year periods applicable, Sameeksha PMS has delivered annualized alpha 100% of the time (25 out of 25 observations) ranging from 5% to 10% alpha (Table 3).
Returns of Individual Portfolios
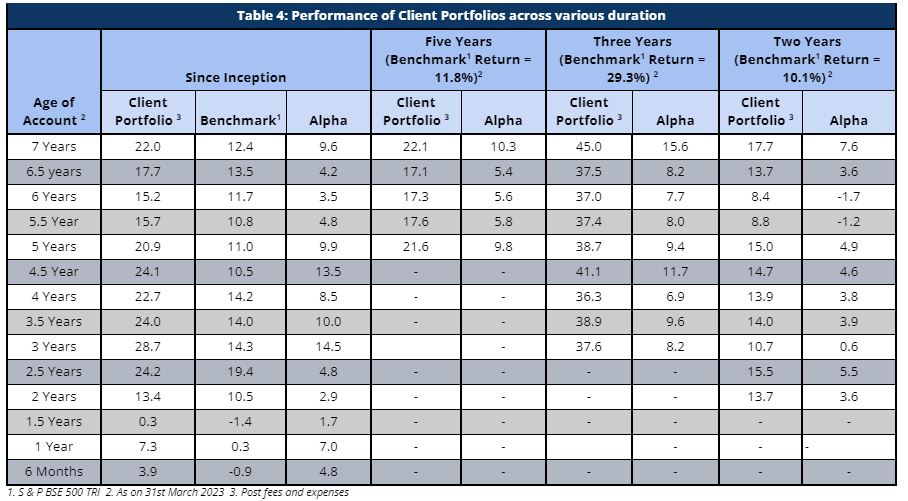
Because we don’t follow model portfolio strategy, the performance of individual clients is far more important than overall portfolio aggregate returns (Table 4). For investors who are with us for 3 years and more, Sameeksha PMS has returned a very substantial alpha with a median annualized alpha of approx. 8% for the three year period ending 31st March 2023. Similarly, for investors who are with us for 5 years and more, Sameeksha PMS has returned substantial alpha with a median annualized alpha of approx. 6% for the five year period ending 31st March 2023. As shown in Table 4, the vast majority of our clients have seen positive alpha over benchmark.
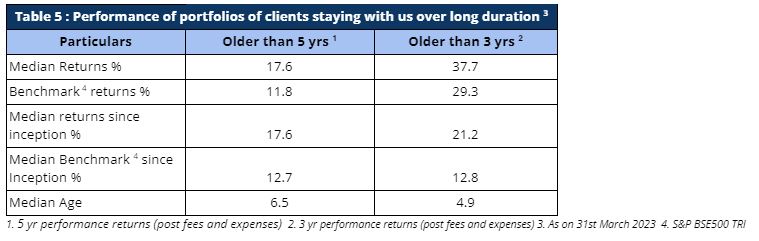
Long term investors, mainly investor accounts older than 5 years and 3 years, have carved out strong alpha, thereby proving Sameeksha PMS to be a valuable partner for their investments (Table 5).
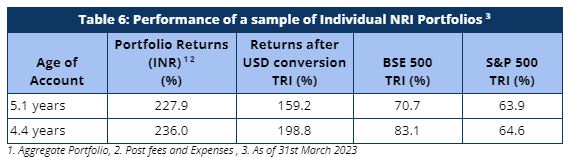
Our NRI clients have also seen strong returns even after factoring in rupee depreciation against US dollars. The portfolio returns are significantly higher than both BSE 500 TRI and S&P 500 TRI, generating strong alpha over both these indices (Table 6)
Aggregate Portfolio Returns
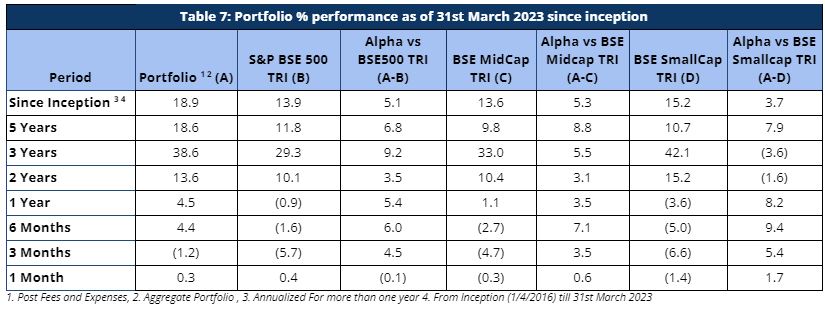
It is important to note that we have maintained relatively higher levels of cash (13.6% on average over the entire period from inception) from time to time over the duration of managing the portfolio. Notwithstanding the same, from inception as well as over five and three years respectively, we have generated returns of 18.9%, 18.6% and 38.6% beating the benchmark BSE500 TRI returns of 13.9%, 11.8% and 29.3% respectively after fees and expenses. Before deducting fees and expenses, we have generated returns of 20.3%, 19.9% and 40.8% for the period from inception (~7 years), five years and three years respectively. We have delivered strong returns relative to benchmark across various key time periods. (Table 7).
Risk Adjusted Ratios
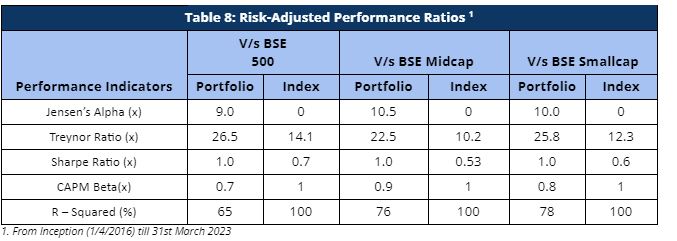
When compared on a risk-adjusted basis, our PMS shows an even stronger performance with a risk-adjusted alpha generation of 9.0% over the broader market benchmark since its inception. While our portfolio beta has been materially lower than our benchmark, our returns have been higher than the benchmark since inception, implying superior strong risk adjusted returns.
Furthermore, other risk-adjusted returns – Sharpe ratio and Treynor ratio, are also significantly higher than the benchmark indices (Table 8). It is worth noting that we offer superior risk adjusted returns not only compared to the broad BSE500 index heavily weighted towards large cap but also the small cap and mid cap benchmarks as demonstrated by our Sharpe ratio, Alpha, Treynor ratio and Beta.
Performance within the PMS Universe
We continue to maintain our top rankings both within the multicap PMS universe as well as the entire PMS universe for key periods of three and five years. The multicap PMS universe rankings are more relevant to us since we follow the multicap strategy.
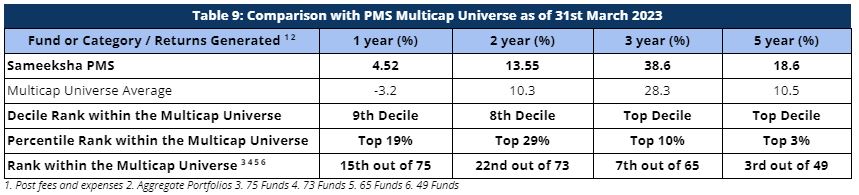
In the interest of a fair comparison, we present our rankings among those multicap PMSes with AUM more than INR 100 crs. For the three year period, we are ranked 7th out of 65 PMSes. Further, we are ranked 3rd out of 49 PMSes for the five year period comparison within the multicap universe – highlighting our superior performance over the long term periods (Table 9). Among the multicap universe (considering all AUM), we are consistently ranked in the Top Decile for the five year period for all 25 out of 25 observations reflecting well on the consistency of our performance.
Rolling Returns and Rankings
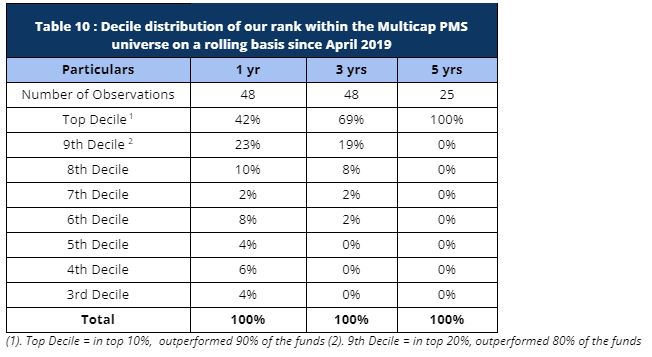
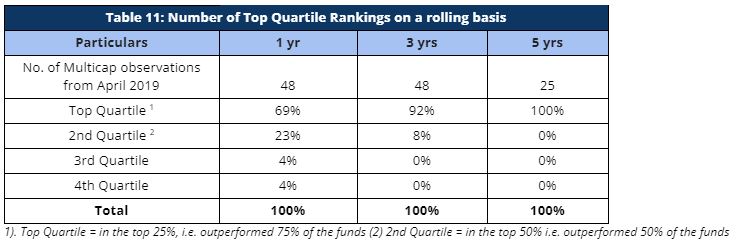
For the rolling three year periods applicable to our entire operating history, we have been ranked among the multicap universe in the Top Decile 69% of the time (33 out of 48 observations) and in the Top Quartile 92% of the time (44 out of 48 observations). For the remaining 8% observations, we were ranked in the Second Quartile (Tables 10 and 11). For the rolling five year periods applicable for our entire operating history, we have been ranked among the multicap universe in the Top Decile 100% of the time (25 out of 25 observations).
Cumulative Performance versus the benchmark
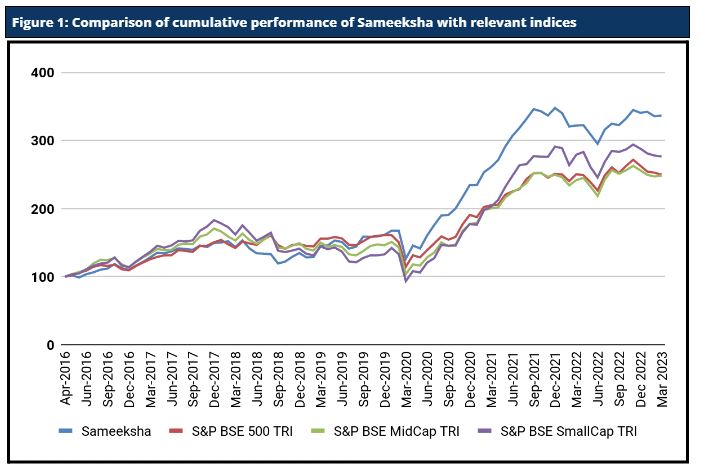
Sameeksha’s outperformance over its benchmark has continued to widen positively over the years. An investment of Rs. 100 with us since inception (April 2016) would have grown to Rs. 336, far outpacing what one would have earned by investing in a fund that achieved benchmark returns (Figure 1).
Analyzing the performance during the month of March 23
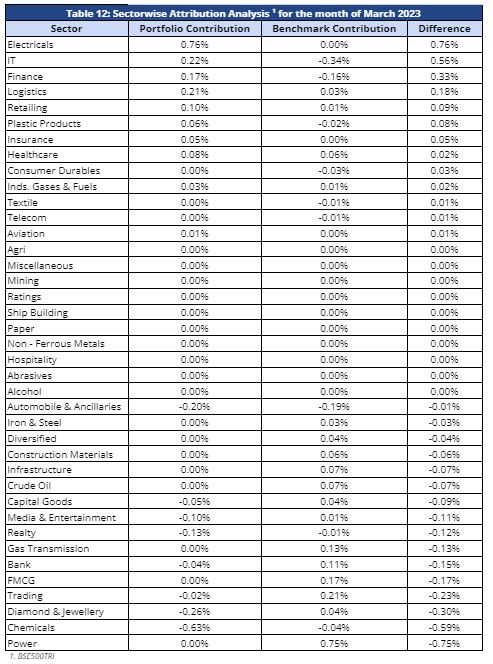
For the month of March 2023, the broader indices BSE500 TRI, BSE Midcap TRI and BSE Smallcap TRI returned 0.36%, -0.32%, -1.37%, respectively. Sameeksha PMS generated a return of 0.8% before fees but with the application of performance fees, our returns came down to 0.29%. Our conversation with PMS Bazaar suggests that there might be some differences in how various PMSes report their performance (with or without all fees) and we are told that PMS Bazaar is working to eliminate such differences. Key for us is to consistently deliver superior risk adjusted returns.
During the month, the IT & Electricals sectors were outperformers for us, whereas the benchmark was negative. However, what hurt us is the underperformance of the Chemicals, Diamond and Jewellery, Trading and Realty sectors where the portfolio struggled compared to the benchmark. We also missed out on participating in the Power sector rally. Below is the attribution analysis for the month of March 2023 (Table 12).