Despite continued global uncertainty, Indian equity markets recovered in March 2022 with our benchmark generating returns of 4.2% . Our PMS also generated returns of 3.8% before fees but with application of performance fees our after fees returns came down to 0.5%. Our conversation with PMS Bazaar suggests that there might be some differences in how various PMSes report their performance (with or without all fees) and we are told that PMS Bazaar is working to eliminate such differences. Key for us is to consistently deliver superior risk adjusted returns.
We continue to rank among the best for the long term performance. For the three year period ending March 2022, we ranked 7th out of 88 multicap PMSes reporting to PMS Bazaar. For the five year period as well, we ranked 5th out of 56 multicap PMSes.
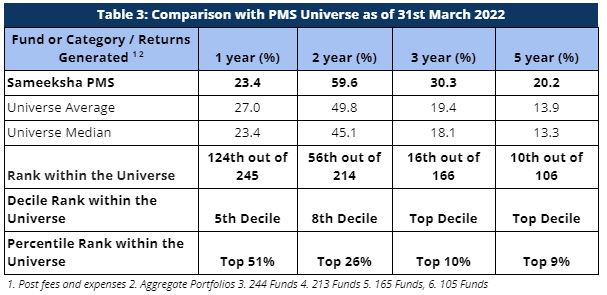
Even after accounting for spillover effects from Feb 2022, we are still ranked in the top 10% PMSes in the entire PMS universe by being the 16th of the 166 PMSes for the three year period and the 10th of the 106 PMSes for the five year period.
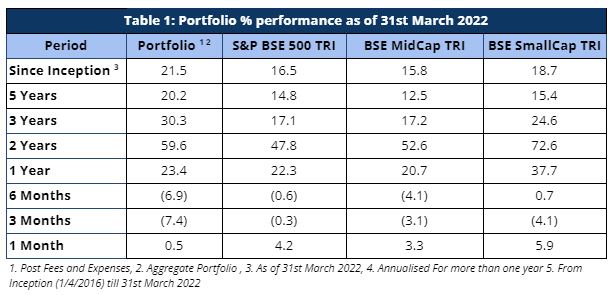
As defined by our strategy, we have maintained relatively higher levels of cash (14.2% on average over the entire period from inception) from time to time over the duration of managing the portfolio. Notwithstanding the same, from inception as well as over five and three years respectively, we have generated returns of 21.5%, 20.2% and 30.3% beating the benchmark BSE500 TRI returns of 16.5%, 14.8% and 17.1%.
Portfolio Returns
For the month of March 2022, the broader markets ended on a strong note with small caps rallying significantly in this month. We had a relatively healthier month as compared to Feb 2022; however our performance this month i.e. 0.5% was still lower than the benchmark BSE500 TRI returns of 4.2% – largely attributable to the fees charged for the financial year 2022.
For longer periods where the outperformance is much more meaningful, we have strongly outperformed our benchmark index across all the relevant key periods (>1 year) – as can be observed in Table 1.
Performance within the PMS Universe
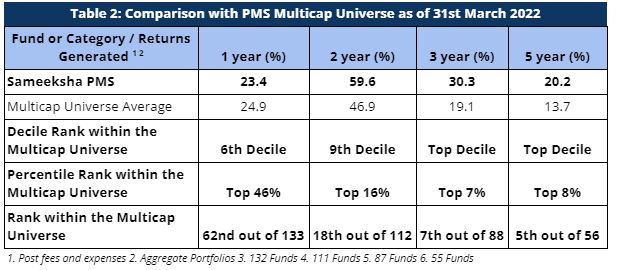
We continue to maintain our top rankings both within the multicap PMS universe as well as the entire PMS universe for longer key periods. The multicap PMS universe rankings are more relevant to us since we follow multicap strategy.
For the three year period, we are ranked 7th out of 88 PMSes. In the same vein, we are ranked 5th out of 56 funds for the five year period comparison within the Multicap universe – highlighting our superior performance over the long term.
Our one year performance has been far less impressive and we will analyze the reasons for the same in a separate note.
When compared with the entire PMS universe, we again come out on top 10% ranking for longer key periods. We are ranked 16th out of 166 PMSes for the three year period and 10th out of 106 PMSes for the five year period.
Comparison of Rolling Returns with other funds
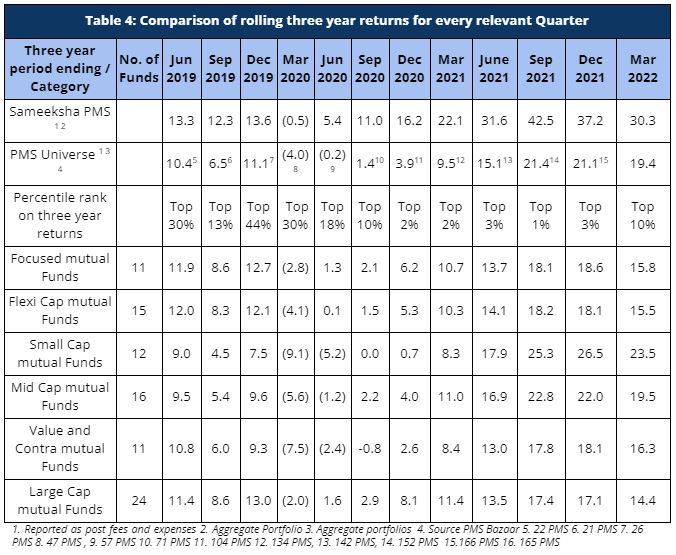
Rolling returns are a more useful indicator of consistency in performance versus single period returns. For the three year period ending March 2022, we have meaningfully outperformed all the major relevant mutual fund categories that we are comparable with and have maintained our top decile ranking across both our comparable universe of Multicap PMSes as well as across the entire PMS universe (Table 4). Furthermore, we have been consistently ranked among the top 10% for the last one and a half years.
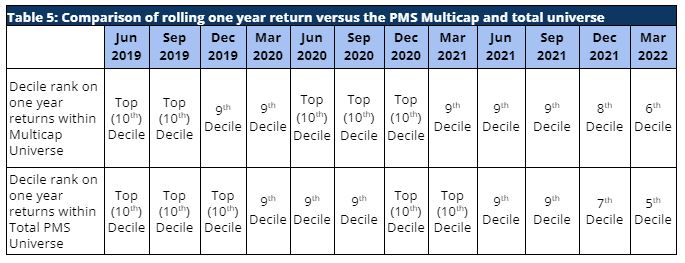
In recent months, our rolling one-year returns have been less impressive compared to the last two years. However, we still have maintained our rankings in the upper half of the table across the PMS universe consistently over the last two years (Table 5).
Performance Of Individual Portfolios
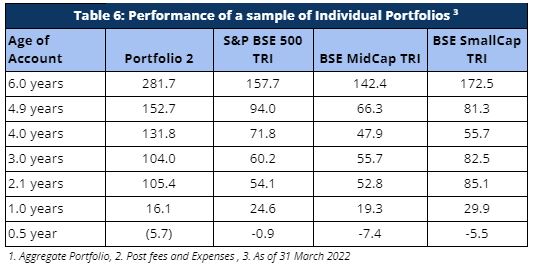
Portfolio returns for clients, except for investors starting with us over the last eight months have seen remarkably strong alpha (Table 6). Performance of portfolios of clients who joined us in the last one year is a matter of concern that we hope to be able to address over time.
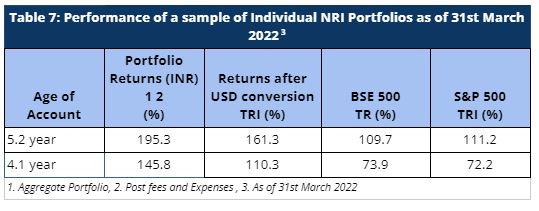
Similarly, our NRI clients have seen strong returns even after factoring in rupee depreciation against US dollars. The portfolio returns are significantly higher than both BSE 500 TRI and S&P 500 TRI, generating strong alpha over both these indices.
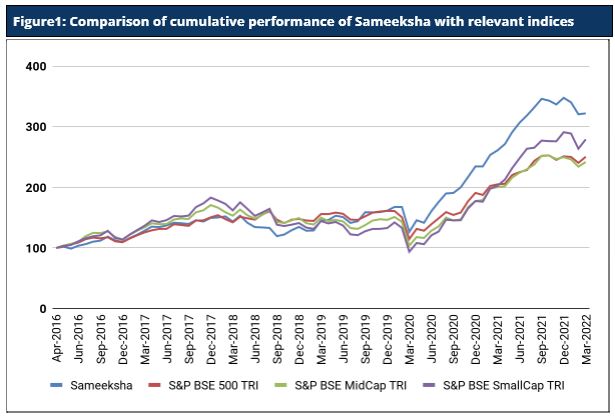
Cumulative Performance versus the benchmark
Sameeksha’s outperformance over its benchmark has continued to widen positively over the years. An investment of Rs. 100 with us since inception (April 2016) would have grown to Rs. 322, far outpacing what one would have earned by investing in a fund that achieved benchmark returns (Figure 1).
Fund Performance on a Financial Year and Calendar Year basis
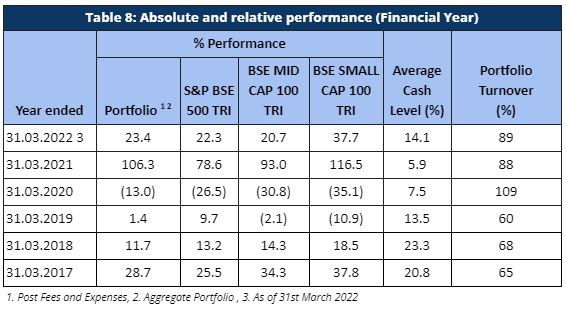
Sameeksha PMS generated a return of 23.4% for the current financial year ending March 2022, outperforming its benchmark index BSE500 TRI – which returned 22.3% over the same period (Table 8). Discerning investors would notice that we have delivered this performance despite maintaining a meaningful percentage of our portfolio in cash from time to time and that is well reflected in our risk-adjusted-performance outcomes.
Looking at our performance over the financial years, it is evident that we have clearly out-performed our benchmark in four out of six financial years. Key however is that the sum of outperformance in those four years far exceeds the sum of underperformance in the remaining two years. Also important is that after adjusting for cash exposure, we underperformed the benchmark only in one out of six years.
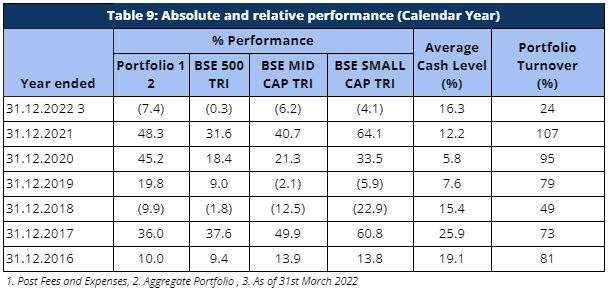
The performance pattern on a calendar year basis has been quite similar as well (Table 9). Although, for the current calendar year 2022, we are underperforming the benchmark (largely due to application of performance fees in March 2022), for the recently completed calendar year ending 2021, we have generated a return of 48.3% with an alpha of 16.7% over our benchmark BSE 500 TRI.
Risk Adjusted Ratios
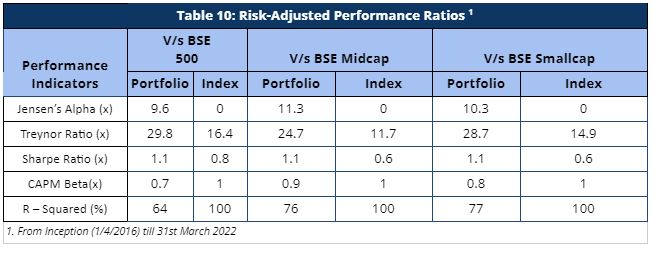
When compared on a risk-adjusted basis (Table 10), our PMS shows even stronger performance with a risk-adjusted alpha generation of 9.6% over the broad market benchmark since its inception.
Furthermore, other risk-adjusted returns – Sharpe ratio and Treynor ratio, are also significantly higher than the benchmark indices (Table 10). It is worth noting that we offer superior risk adjusted returns not only compared to the broad BSE 500 index heavily weighted towards large cap but also the small cap and mid cap benchmarks as demonstrated by our sharpe ratio, alpha, Treynor ratio and beta.
Disclaimer : The information contained in this update is based on data provided by our fund accounting platform and is not audited.