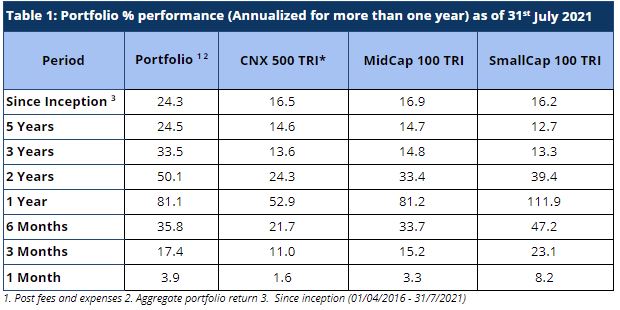
Sameeksha PMS outperformed its benchmark CNX500 TRI for a consecutive 8th month, generating an alpha of 2.3% for July 2021 over the benchmark returns of 1.6%.
Since its inception, Sameeksha PMS has generated a return of 24.3% versus the benchmark CNX500 TRI returns of 16.5%. Notwithstanding a very strong rally in small and mid-cap stocks over the last 16 months, we continue to rank among the top 3-4 funds (top 2-4%) across not only the multi-cap universe but also across the entire PMS universe based on three and five-year performance. Discerning investors would notice that we have delivered this performance despite maintaining a meaningful percentage of our portfolio in cash from time to time and that is well reflected in our risk-adjusted-performance outcomes.
Portfolio Returns
Broader markets remained upbeat for July 2021 with small-caps rallying significantly. For July 2021, We had another good month on an absolute (up 3.9%) and relative basis, with an alpha generation of 2.3% over our benchmark CNX500 TRI’s returns of 1.6%. As can be observed in Table 1, we have strongly outperformed our benchmark index across all the relevant key periods. With small caps forming only a small part of our portfolio, we have underperformed the small-cap index over the last year.
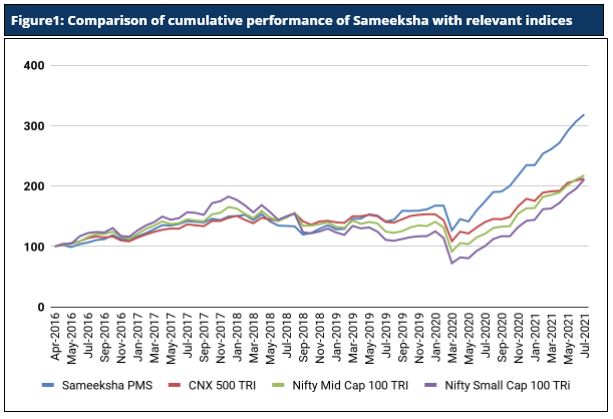
Sameeksha’s outperformance over its benchmark has continued to widen positively over the years. An investment of Rs. 100 with us since inception (April 2016) would have grown to Rs. 319, far outpacing what one would have earned by investing in a fund that achieved benchmark returns (Figure 1).
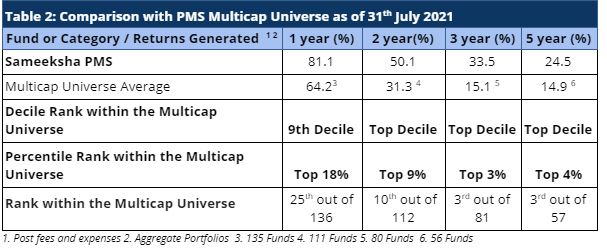
Performance within the PMS Universe
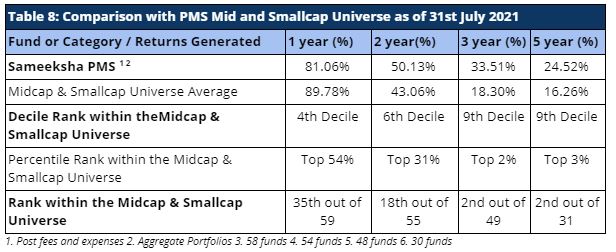
We continue to maintain our top rankings both within the multi-cap PMS universe as well as the entire PMS universe. For longer time horizons, i.e. for two, three, and five-year periods, we have maintained top decile ranking within the Multicap universe, and top two decile ranking for all the periods.
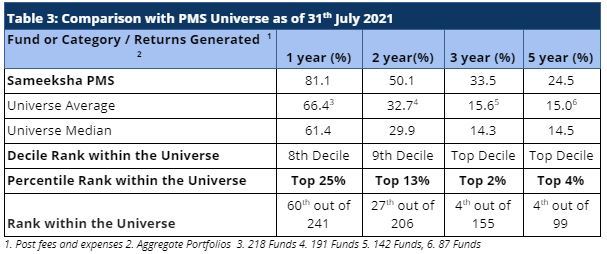
Strong performance in mid and small-cap stocks has enabled PMSes focussed on those categories to deliver strong one-year performance. However, over longer periods of three and five years, we have retained our top decile position when compared with the entire PMS universe (Table 3). We are ranked 4th out of 99 funds based on five-year data and 4th out of 155 funds for three-year data.
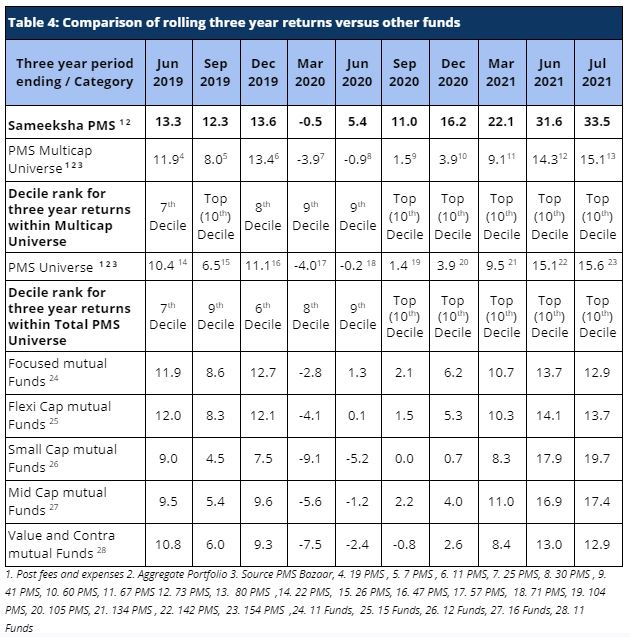
Comparison of Rolling Returns with other funds
Rolling returns provide a much better comparison than a snapshot of one period. We continue to come out extremely well on this measure on a three-year basis when compared to the PMS universe as well as relevant categories of mutual funds – focused, flexi-cap, small-cap, mid-cap, value, and contra funds (Table 4). We have continued to maintain our top decile ranking across both our comparable universe of Multicap PMSes as well as across the entire PMS universe.
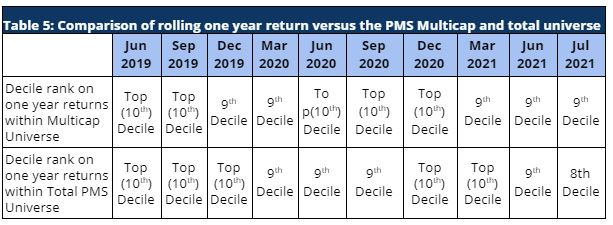
Similarly, our rolling one-year returns have been strong and we have maintained our rankings in the top two deciles across the PMS universe, consistently in the last two years (Table 5).
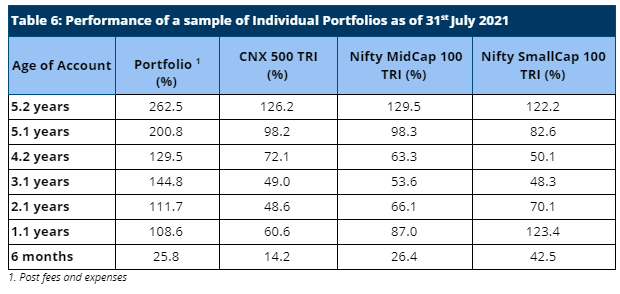
Performance Of Individual Portfolios
The portfolio returns of our clients continue to outpace the benchmarks by a significant margin irrespective of their investment timings, (Table 6). For a long-term investor, Sameeksha PMS has proven to be a valuable partner for their investments.
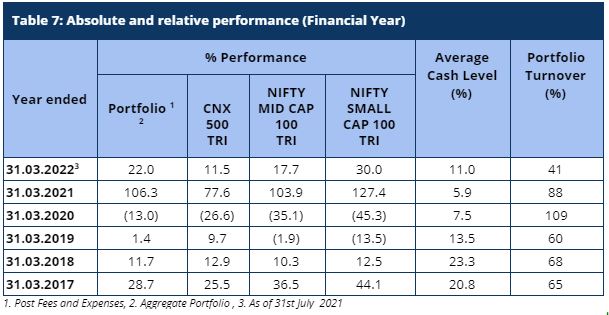
Fund Performance on a Financial Year basis
Sameeksha PMS generated a return of 22% in four months (April – July 2021) of the current financial year ending March 2022, outperforming its benchmark index CNX 500 TRI – which returned 11.5% over the same period (Table 7).
This outperformance has been achieved despite maintaining average cash levels of 11% in our portfolio – indicating strong risk-adjusted returns as well.
Impact of limited exposure to small and mid caps
As a key risk management practice, we limit our exposure to small and mid caps both in terms of position size as well as in terms of number of total positions in the portfolio. Our exposure to small and mid cap has remained within a band over the tenure of our fund and in particular over the last twelve months with that exposure further coming down in recent months because we are painfully aware of the havoc high exposure to small caps can cause when there is a correction in the overall market. When measured from a sample period of 2006 to 2021, the Small cap valuations based on P/B are two SD (Standard Deviation) above median and the ratio of small cap to large cap valuation is almost three SD above median today and within 10% of its highest value ever. On an absolute basis, we saw higher valuations for small cap only in the euphoric period of 2007.
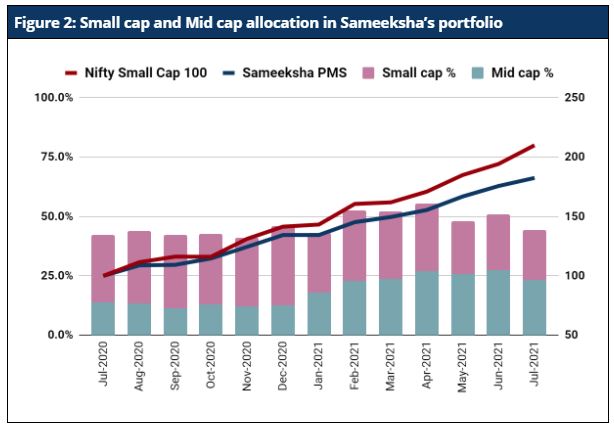
With our exposure to small cap ranging from 21% to 33% over the last twelve months and a recent print being down to 21%, we have clearly underperformed small cap index as well as several PMSes that follow small and mid cap strategy. Still, we rank as the second best among all such PMSes for three and five year periods. We believe that our strategy should offer a better balance of volatility and returns compared to most of the pure small and mid cap strategies. Given where small and mid cap valuations are today, the outperformance of these segments appears less likely in future.
Risk-Adjusted Ratios
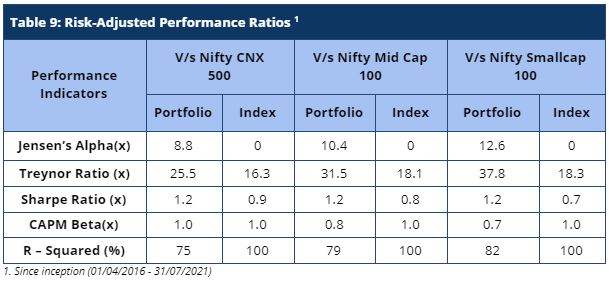
When compared on a risk-adjusted basis (Table 9), our PMS shows even stronger performance with a risk-adjusted alpha generation of 8.8% over the broad market benchmark since its inception.
Furthermore, other risk-adjusted returns – Sharpe ratio and Treynor ratio, are also significantly higher than the benchmark indices (Table 9).
Please let us know if you have any questions.
Disclaimer : The information contained in this update is based on data provided by our fund accounting platform and is not audited.