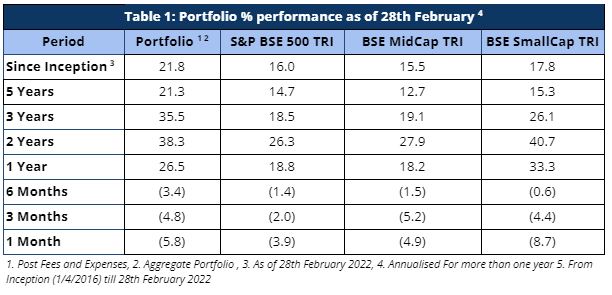
Markets remained weak in the month of February especially due to the invasion of Ukraine by Russia. Sameeksha PMS underperformed both on an absolute as well as relative basis for the month, generating a return of -5.8% versus benchmark return of -3.9%. Over the last six months, Sameeksha PMS has delivered returns of -3.4% versus benchmark at 1.8%. So indeed, February accounts for the entire under performance over the last six months. For investors who opened accounts with us over the last six months, this underperformance may not be comforting even though our performance over the last one year and beyond continues to remain very strong
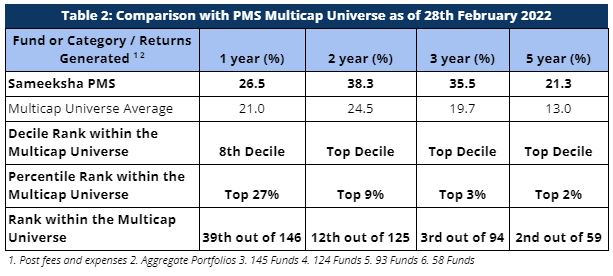
For longer key periods, we continue to rank among the best for the long term performance. For the three year period ending February 2022, we are ranked 3rd out of 94 multicap PMSes reporting to PMS Bazaar. For the five year period as well, we are ranked 2nd out of 59 multicap PMSes.
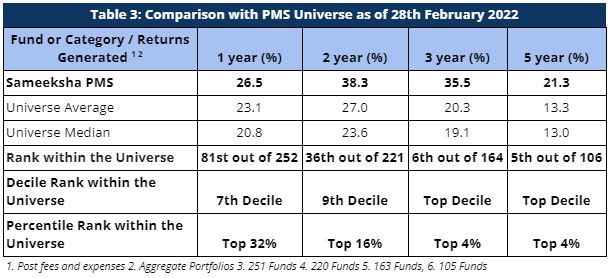
Even within the entire PMS universe, we are ranked 6th out of 164 PMSes for the three year period and 5th out of 106 PMSes for the five year period.
As defined by our strategy, we have maintained relatively higher levels of cash (14% on average over the entire period from inception) from time to time over the duration of managing the portfolio. Notwithstanding that, from inception as well as over five and three years respectively, we have generated returns of 21.8%, 21.3% and 35.5% versus the benchmark BSE500 TRI returns of 16.0%, 14.7% and 18.5%. Most importantly, clients investing with us across extended time periods have enjoyed meaningful alpha irrespective of the time of their entry.
Portfolio Returns
For the month of February 2022, broader markets had a down month due to the ongoing Russia-Ukraine conflict, with BSE 500 TRI generating a return of -3.9%. We had a down month as well with a return of -5.8% (Table 1).
Performance within the PMS Universe
We continue to maintain our top rankings both within the multicap PMS universe as well as the entire PMS universe for longer key periods. The multicap PMS universe rankings are more relevant to us since we follow multicap strategy.
For the three year period, we are ranked 3rd out of 94 PMSes. In the same vein, we are ranked 2nd out of 59 funds for the five year period comparison within the Multicap universe – highlighting our superior performance over the long term.
When compared with the entire PMS universe,we again come out on top ranking for longer key periods. We are ranked 6th out of 164 PMSes for the three year period and 5th out of 106 PMSes for the five year period.
Comparison of Rolling Returns with other funds
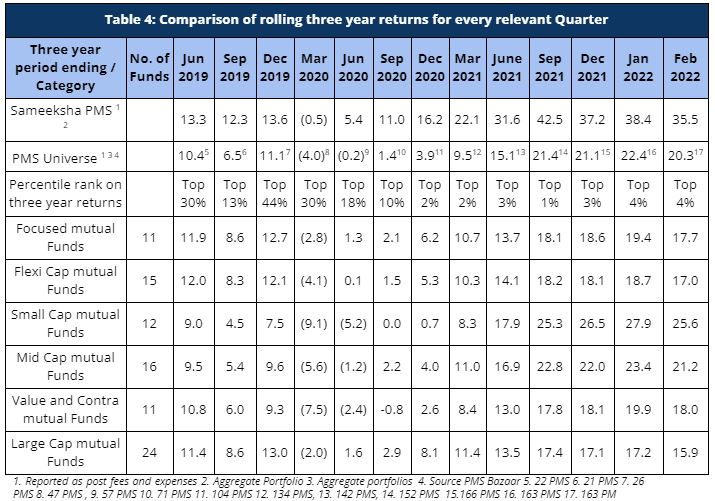
Rolling returns provide a much better comparison than a snapshot of one period. We continue to come out extremely well on this measure on a three-year basis when compared to the PMS universe as well as relevant categories of mutual funds – focused, flexi-cap, small-cap, mid-cap, value, and contra funds (Table 4). We have continued to maintain our top decile ranking across both our comparable universe of Multicap PMSes as well as across the entire PMS universe. In fact, for the last 6 quarters, we are in the top 5% on three year returns within the entire PMS universe.
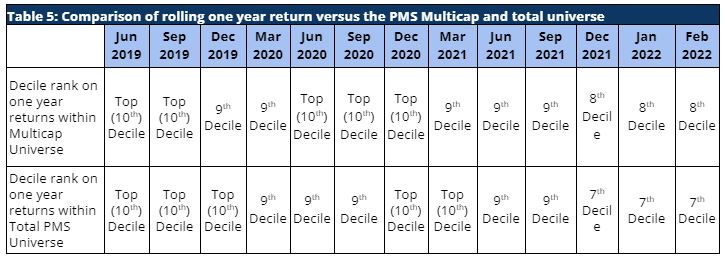
In recent months, our rolling one-year returns have been a bit less impressive compared to the last two years. However, we outperformed over 70% of multicap PMSes over the last one year and over 60% of total PMSes during the same time (Table 5).
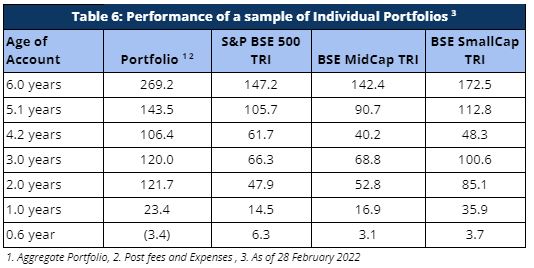
Portfolio returns for clients, except for investors starting with us over the last six months have seen remarkably strong alpha (Table 6). Performance of portfolios of clients who joined us in the last six months is a matter of concern that we hope to be able to address over time.
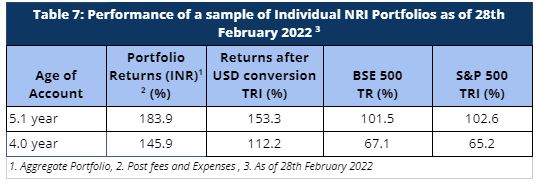
Similarly, our NRI clients have seen strong returns even after factoring in rupee depreciation against US dollars. The portfolio returns are significantly higher than both BSE 500 TRI and S&P 500 TRI, generating strong alpha over both these indices.
Cumulative Performance versus the benchmark
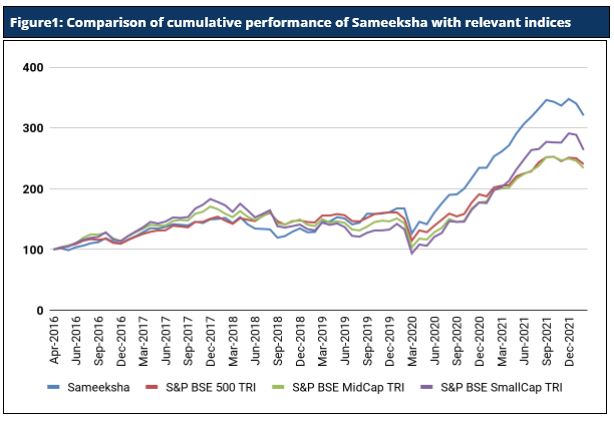
Sameeksha’s outperformance over its benchmark has continued to widen positively over the years. An investment of Rs. 100 with us since inception (April 2016) would have grown to Rs. 320, far outpacing what one would have earned by investing in a fund that achieved benchmark returns (Figure 1).
Fund Performance on a Financial Year basis
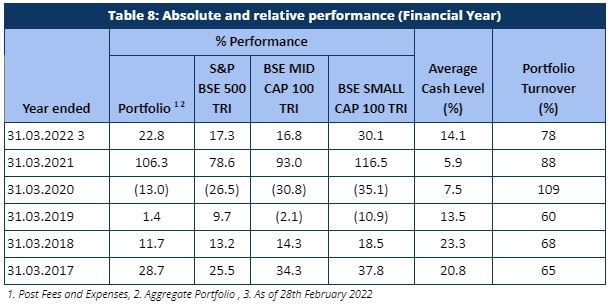
Sameeksha PMS generated a return of 22.8% in eleven months (April 2021 – Feb 2022) of the current financial year ending March 2022, outperforming its benchmark index BSE500 TRI – which returned 17.3% over the same period (Table 8). Discerning investors would notice that we have delivered this performance despite maintaining a meaningful percentage of our portfolio in cash from time to time and that is well reflected in our risk-adjusted-performance outcomes.
Looking at our performance over the financial years, it is evident that we have clearly out-performed our benchmark in four out of six financial years (including the current incomplete year). Key however is that the sum of outperformance in those four years far exceeds the sum of underperformance in the remaining two years. Also important is that after adjusting for cash exposure, we underperformed the benchmark only in one out of six years.
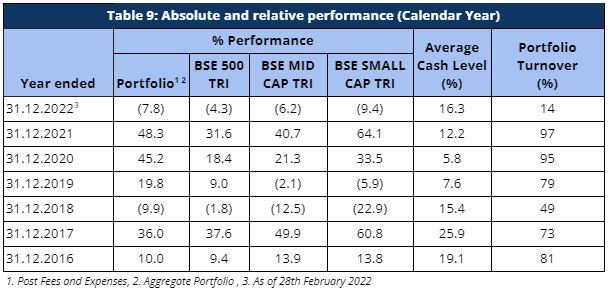
The performance pattern on a calendar year basis has been quite similar. (Table 9) For the just completed calendar year ending 2021, we have generated a return of 48.3% with an alpha of 16.7% over our benchmark BSE 500 TRI.
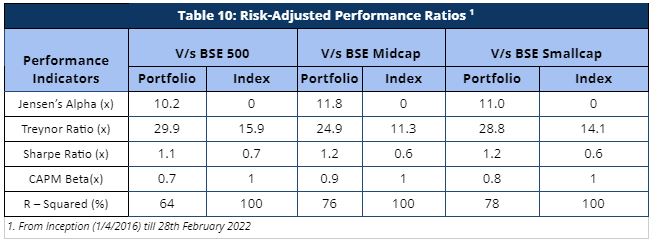
When compared on a risk-adjusted basis (Table 10), our PMS shows even stronger performance with a risk-adjusted alpha generation of 10.2% over the broad market benchmark since its inception.
Furthermore, other risk-adjusted returns – Sharpe ratio and Treynor ratio, are also significantly higher than the benchmark indices. It is worth noting that we offer superior risk adjusted returns not only compared to the broad BSE500 index heavily weighted towards large cap but also the small cap and mid cap benchmarks as demonstrated by our sharpe ratio, alpha, Treynor ratio and beta.
Please let us know if you have any questions.