From the prolonged Russia-Ukraine war disrupting supply chains and the hawkish notes by the US Fed on the interest rates to the continued selling by the FPIs, the fiscal year of 2022-23 started off on a cautious note. One can say that the slew of volatility experienced in the last six months has entered the month of April as well. For the month of April 2022 , the performance of the market indices was weak with benchmark BSE 500 TRI generating returns of -0.6%. In this cautiously moving landscape, our PMS has managed to hold up, outperforming the benchmark index by returning 0.14%, and generating a marginal alpha of 0.74%.
We continue to rank among the best for the long term performance. For the three year period ending April 2022, we ranked 6th out of 97 multicap PMSes reporting to PMS Bazaar. For the five year period as well, we ranked 5th out of 60 multicap PMSes.
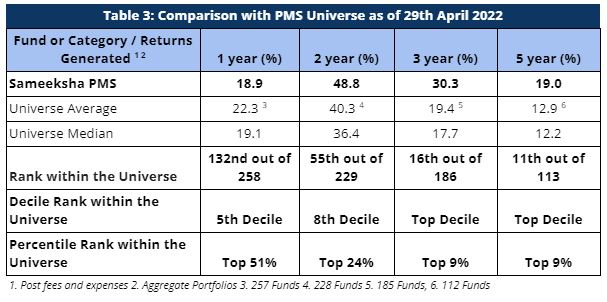
Despite the volatile movement of the market for the last several months, we are still ranked in the top 9% in the entire PMS universe by being the 16th of the 186 PMSes for the three year period and the 11th of the 113 PMSes for the five year period.
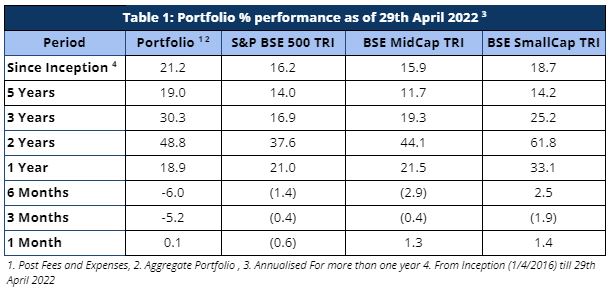
As defined by our strategy, we have maintained relatively higher levels of cash (13.9% on average over the entire period from inception) from time to time over the duration of managing the portfolio. Notwithstanding the same, from inception as well as over five and three years respectively, we have generated returns of 21.24%, 19% and 30.25% beating the benchmark BSE500 TRI returns of 16.19%, 14.04% and 16.91%.
Portfolio Returns
For the month of April 2022, broader markets ended on a poor note with BSE 500 TRI generating a return of -0.6% and the midcap and small cap indices performing relatively poorly as compared to March 2022. While we managed to beat the benchmark BSE 500 TRI for this month, our performance for the last one year has been average.
However, it is pertinent to note that for longer periods where the outperformance is much more meaningful, we have strongly outperformed our benchmark index across all the relevant key periods (>1 year) – as can be observed in Table 1.
Performance within the PMS Universe
Our one year performance has been far less impressive. This is mainly attributable to a choppy market and our underperformance in the last 6 months wherein Sameeksha PMS generated -6.9% returns against the -0.6% returned by our benchmark BSE 500 TRI during the same period. We shall be analyzing the underperformance of the fund in a separate note.
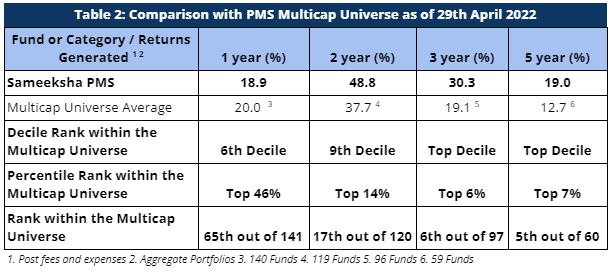
However, we continue to maintain our top rankings both within the multicap PMS universe as well as the entire PMS universe for longer key periods. The multicap PMS universe rankings are more relevant to us since we follow multicap strategy.
For the three year period, we are ranked 6th out of 97 PMSes. Further, we are ranked 5th out of 60 funds for the five year period within the Multicap universe – highlighting our superior performance over the long term.
When compared with the entire PMS universe, we have maintained top rankings for longer key periods. We are ranked 16th out of 186 PMSes for the three year period and 11th out of 113 PMSes for the five year period.
Comparison of Rolling Returns with other funds
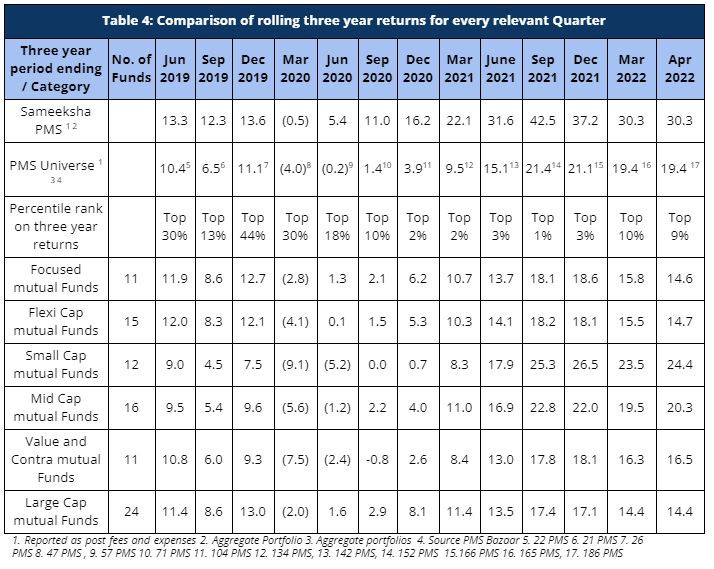
Rolling returns provide a much better comparison than a snapshot of one period. We continue to come out extremely well on this measure on a three-year basis when compared to the PMS universe as well as relevant categories of mutual funds (Table 4). We have continued to maintain our top rankings across both our comparable universe of Multicap PMSes as well as across the entire PMS universe. In fact, we have been consistently ranked in the top 10% for the entire period of the last one and a half years and have been ranked in the top quartile for 75% of the observations available since June 2019.
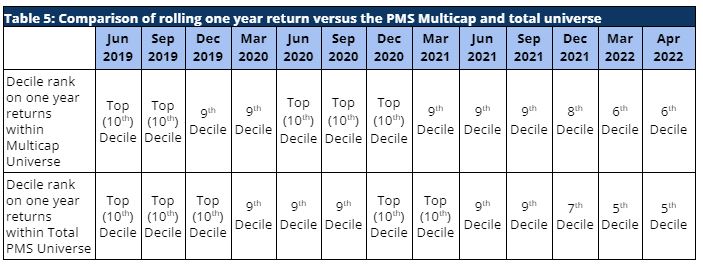
In the recent months, our rolling one-year returns have been less impressive compared to the last two years. However, we still have maintained our decile rankings in the upper half of the table across the PMS universe consistently over the last two years (Table 5).
Performance Of Individual Portfolios
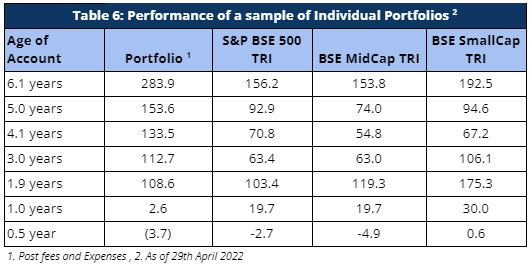
Portfolio returns for clients, except for investors starting with us over the last eight months have seen remarkably strong alpha (Table 6). Performance of portfolios of clients who joined us in the last one year is a matter of concern that we hope to be able to address over time. We will also cover this in a separate note.
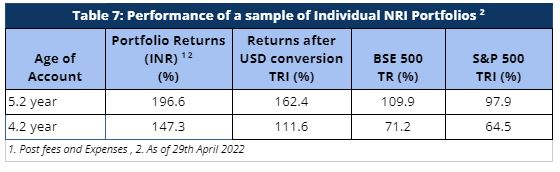
Similarly, our NRI clients have seen strong returns even after factoring in rupee depreciation against US dollars. The portfolio returns are significantly higher than both BSE 500 TRI and S&P 500 TRI, generating strong alpha over both these indices.
Cumulative Performance versus the benchmark
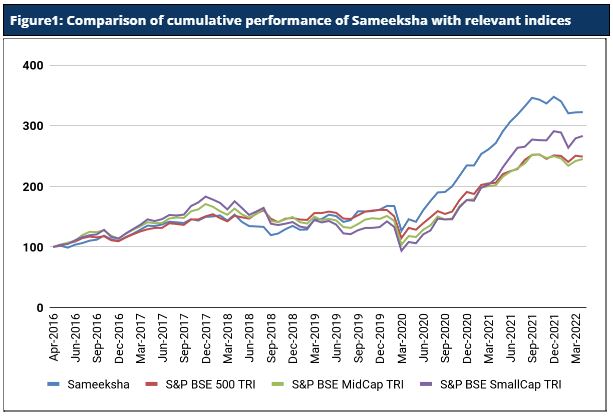
Sameeksha’s outperformance over its benchmark has continued to widen positively over the years. An investment of Rs. 100 with us since inception (April 2016) would have grown to Rs. 322, far outpacing what one would have earned by investing in a fund that achieved benchmark returns (Figure 1).
Fund Performance on a Financial Year and Calendar Year basis
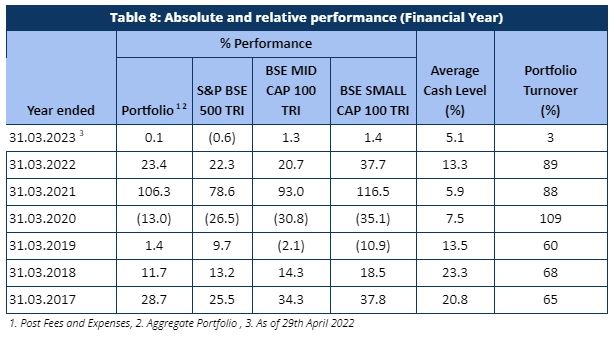
Sameeksha PMS generated a return of 0.14% in one month (March 2022 – April 2022) of the current financial year ending March 2023, outperforming its benchmark index BSE 500 TRI – which returned -0.6% over the same period (Table 8). Discerning investors would notice that we have delivered this performance despite maintaining a meaningful percentage of our portfolio in cash from time to time and that is well reflected in our risk-adjusted-performance outcomes.
Looking at our performance over the financial years, we have outperformed our benchmark in five out of six financial years (including the current incomplete year). Key however is that the sum of outperformance in those five years far exceeds the sum of underperformance in the remaining two years. Also important is that after adjusting for cash exposure, we underperformed the benchmark only in one out of six years.
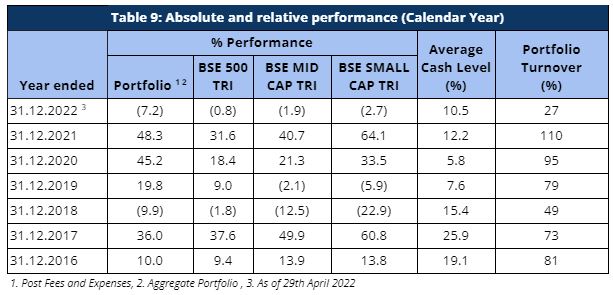
The performance pattern on a calendar year basis has been quite similar as well (Table 9). Although, for the current calendar year 2022, we are underperforming the benchmark (largely due to application of performance fees in March 2022), for the recently completed calendar year ending 2021, we have generated a return of 48.3% with an alpha of 16.7% over our benchmark BSE 500 TRI.
Risk Adjusted Ratios
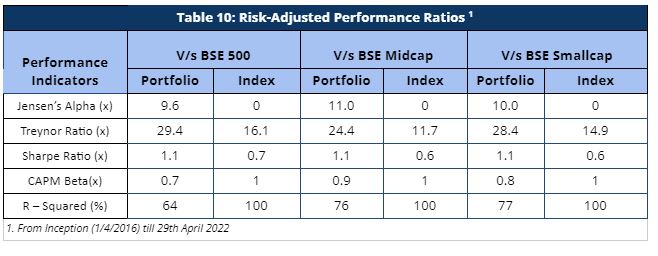
When compared on a risk-adjusted basis (Table 10), our PMS shows even stronger performance with a risk-adjusted alpha generation of 9.6% over the broad market benchmark since its inception.
Furthermore, other risk-adjusted returns – Sharpe ratio and Treynor ratio, are also significantly higher than the benchmark indices (Table 10). It is worth noting that we offer superior risk adjusted returns not only compared to the broad BSE 500 index heavily weighted towards large cap but also the small cap and mid cap benchmarks as demonstrated by our Sharpe ratio, Alpha, Treynor ratio and Beta.
Disclaimer : The information contained in this update is based on data provided by our fund accounting platform and is not audited